. 2018 Mar 16;8(1):4733.
doi: 10.1038/s41598-018-23042-w.

Mechanical stretch induced transcriptomic profiles in cardiac myocytes

Affiliations

Mechanical stretch induced transcriptomic profiles in cardiac myocytes

Jaana Rysä et al. Sci Rep. .

Abstract

Mechanical forces are able to activate hypertrophic growth of cardiomyocytes in the overloaded myocardium. However, the transcriptional profiles triggered by mechanical stretch in cardiac myocytes are not fully understood. Here, we performed the first genome-wide time series study of gene expression changes in stretched cultured neonatal rat ventricular myocytes (NRVM)s, resulting in 205, 579, 737, 621, and 1542 differentially expressed (>2-fold, P < 0.05) genes in response to 1, 4, 12, 24, and 48 hours of cyclic mechanical stretch. We used Ingenuity Pathway Analysis to predict functional pathways and upstream regulators of differentially expressed genes in order to identify regulatory networks that may lead to mechanical stretch induced hypertrophic growth of cardiomyocytes. We also performed micro (miRNA) expression profiling of stretched NRVMs, and identified that a total of 8 and 87 miRNAs were significantly (P < 0.05) altered by 1-12 and 24-48 hours of mechanical stretch, respectively. Finally, through integration of miRNA and mRNA data, we predicted the miRNAs that regulate mRNAs potentially leading to the hypertrophic growth induced by mechanical stretch. These analyses predicted nuclear factor-like 2 (Nrf2) and interferon regulatory transcription factors as well as the let-7 family of miRNAs as playing roles in the regulation of stretch-regulated genes in cardiomyocytes.


Conflict of interest statement

The authors declare no competing interests.

Figures

Figure 1
Figure 1
Differentially expressed genes in stretched neonatal rat ventricular myocytes. (A,B) Numbers of differentially expressed genes in response to 1–48 hours of cyclic mechanical stretch in cultured cardiac myocytes with (A) 2-fold difference and (B) 1.5 fold difference. Black columns, upregulated genes; white columns downregulated genes, n = 5 in all groups. (CI) Venn diagrams indicate the overlap of the genes that were significantly (C) upregulated (>2-fold) or (D) downregulated (<2-fold) and (E) upregulated (>1.5-fold) or (F) downregulated (<1.5-fold) after 1, 4 or 12 hours of stretch as compared to controls. A Venn diagram indicating the overlap of the genes that were significantly (G) upregulated (>2-fold) or (H) downregulated (<2-fold) and (I) upregulated (>1.5-fold) or (J) downregulated (<1.5-fold) after 24 or 48 hours of stretch compared to controls.
Figure 2
Figure 2
The ten most up- and down-regulated genes in stretched myocytes at 1–48 hours after the initiation of the mechanical stretch. Fold change indicates statistically significant (P < 0.05) difference in gene expression between stretched and unstretched neonatal rat ventricular myocytes. Green columns, downregulated genes; red columns upregulated genes.
Figure 3
Figure 3
Functional analysis of differentially expressed genes in stretched neonatal rat ventricular myocytes. Differentially expressed genes (1.5-fold upregulation or downregulation compared to controls; P < 0.05) were used in the functional analysis in the IPA-software. A positive or negative z-score value (columns) indicates that a function would be predicted to be either increased (A) or decreased (B) in stretched myocytes. Only those functional annotations that obtained a significant regulation z-score (>2) are presented. The p-value (red dots) reflects the likelihood that the association between a set of genes in our dataset and a related biological function would be significant [p-value < 0.05 (i.e., −log10 ≥ 1.3), Fisher’s Exact test]. A maximum 10 genes per activation/inactivation-route and P < 1.00E-9 are shown per timepoint. Numbers of differentially expressed genes in each functional class are shown in parentheses.
Figure 4
Figure 4
Significant canonical pathways associated with differentially expressed genes in stretched neonatal ventricular myocytes. Ingenuity pathway analysis showing the canonical pathways that were most significant in the data sets of differentially expressed genes after (A) 1–12 and (B) 24–48 hours of mechanical stretch in cardiac myocytes. The entries that have a −log (p-value) greater than 1.3 and an absolute z-score value greater than 2 are displayed. Colors of the bars in the chart indicate their activation z-scores: orange, overall increase in the activity of the pathway; blue, decrease in activity. The intensity of the color indicates the degree of increase or decrease.
Figure 5
Figure 5
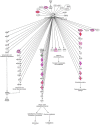
NRF2-mediated oxidative stress response –signaling in the nucleus. Significant canonical pathways associated with differentially expressed genes in response to 12 hours of mechanical stretch in neonatal rat ventricular myocytes are shown. Up- and down-regulated genes are displayed in red and green, respectively. The intensity of the color indicates the degree of up-regulation or downregulation. Genes are represented as various shapes that represent the functional class of the gene product. Full annotations for genes and molecules in this canonical pathway and whole figure of this canonical pathway are provided in Supplementary Datafile 1and Fig. S2, respectively.
Figure 6
Figure 6
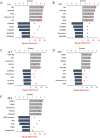
Upstream analysis of mechanical stretch regulated genes. The top five upstream regulators that were predicted to be activated and inhibited in response to (A) 1 hour, (B) 4 hours (C), 12 hours (D), 24 hours and (E) 48 hours of mechanical stretch in neonatal rat ventricular myocytes are shown. Z-scores ≥2 or ≤−2 indicate that the upstream regulator was predicted to be activated or inhibited, respectively. The p-value (red dots) calculated by a Fisher’s Exact Test was used to determine the significance of the overlap [p-value < 0.05 (i.e., −log10 ≥ 1.3) between the regulator and stretch-responsive genes. Only functional annotations that obtained a significant regulation z-score (>2) are presented. CREB1, cAMP-responsive element binding protein 1; LPS, lipopolysaccharide; EGF, epidermal growth factor; IFNB1, interferon beta 1; IRF3, interferon regulatory factor 3; IRF7, interferon regulatory factor 7; PDGF-BB, platelet-derived growth factor BB-isoform; PMA, phorbol myristate acetate (activator of protein kinase C, PKC); NAC, N-acetyl-L-cysteine; NFE2L2, NRF2 transcription factor; TGFβ1, transforming Growth Factor β1, TNF, tumor necrosis factor; TRIM24, tripartite motif-containing 24. The targets of the inhibitors are LY294002, P13K inhibitor; PD98059, MEK-inhibitor, SB203580, MAPK-inhibitor, SP600125, JNK-inhibitor; U0126, MEK1 and MEK2 inhibitor.
Figure 7
Figure 7
Differentially expressed miRNAs in stretched neonatal rat ventricular myocytes. The heat map diagram shows the results of unsupervised hierarchical clustering of miRNA expression by LNA microarray in cardiac myocytes in response to (A) 1, 4 and 12 hrs (P < 0.05) and (B) 24 and 48 hrs (P < 0.001) of mechanical stretching (n = 3 in all groups, except n = 2 at 1-hour time point). The clustering was performed on log2(Hy5/Hy3) ratios which passed the filtering criteria by applying a two-tailed t-test between the control and experimental groups. Each row represents a miRNA and each column represents a sample. The miRNA clustering tree is shown on the left. The color scale shown at the bottom illustrates the relative expression level of miRNA across the samples: red color, expression level above mean; blue color, expression lower than the mean; gray color, signal below background.
Figure 8
Figure 8
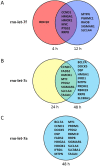
Differentially expressed targets shared by relevant miRNAs. Putative stretch regulated targets for (A) let-7f, (B) let-7c and (C) let-7a were obtained from the IPA-analysis.

Similar articles

Cited by

References

    1. Lorell, B. H. & Carabello, B. a. Clinical Cardiology: New Frontiers Left Ventricular Hypertrophy. 470–479, 10.1161/01.CIR.102.4.470 (2000). - PubMed
    1. Van Berlo JH, Maillet M, Molkentin JD. Signaling effectors underlying pathologic growth and remodeling of the heart. J. Clin. Invest. 2013;123:37–45. doi: 10.1172/JCI62839. - DOI - PMC - PubMed
    1. Xin M, Olson EN, Bassel-duby R. NIH Public Access. Nat. Rev. Mol. Cell Biol. 2013;14:529–541. doi: 10.1038/nrm3619. - DOI - PMC - PubMed
    1. El-Armouche A, Eschenhagen T. β-Adrenergicstimulation and myocardial function in the failing heart. Heart Fail. Rev. 2009;14:225–241. doi: 10.1007/s10741-008-9132-8. - DOI - PubMed
    1. Mudd JO, Kass DA. Tackling heart failure in the twenty-first century. Nature. 2008;451:919–928. doi: 10.1038/nature06798. - DOI - PubMed

Publication types