. 2018 Mar 16;8(1):4663.
doi: 10.1038/s41598-018-22869-7.

Targeted metabolomic profiling in rat tissues reveals sex differences

Affiliations

Targeted metabolomic profiling in rat tissues reveals sex differences

Margherita Ruoppolo et al. Sci Rep. .

Abstract

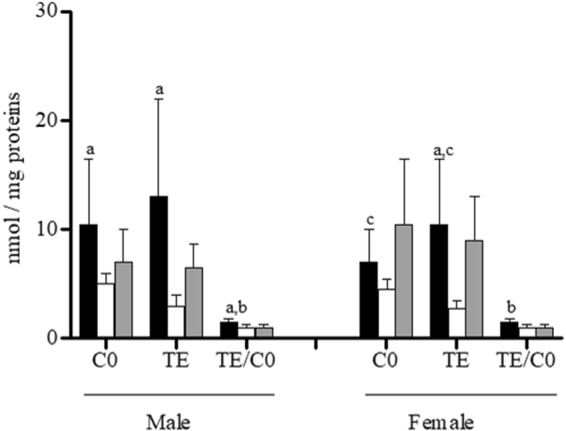
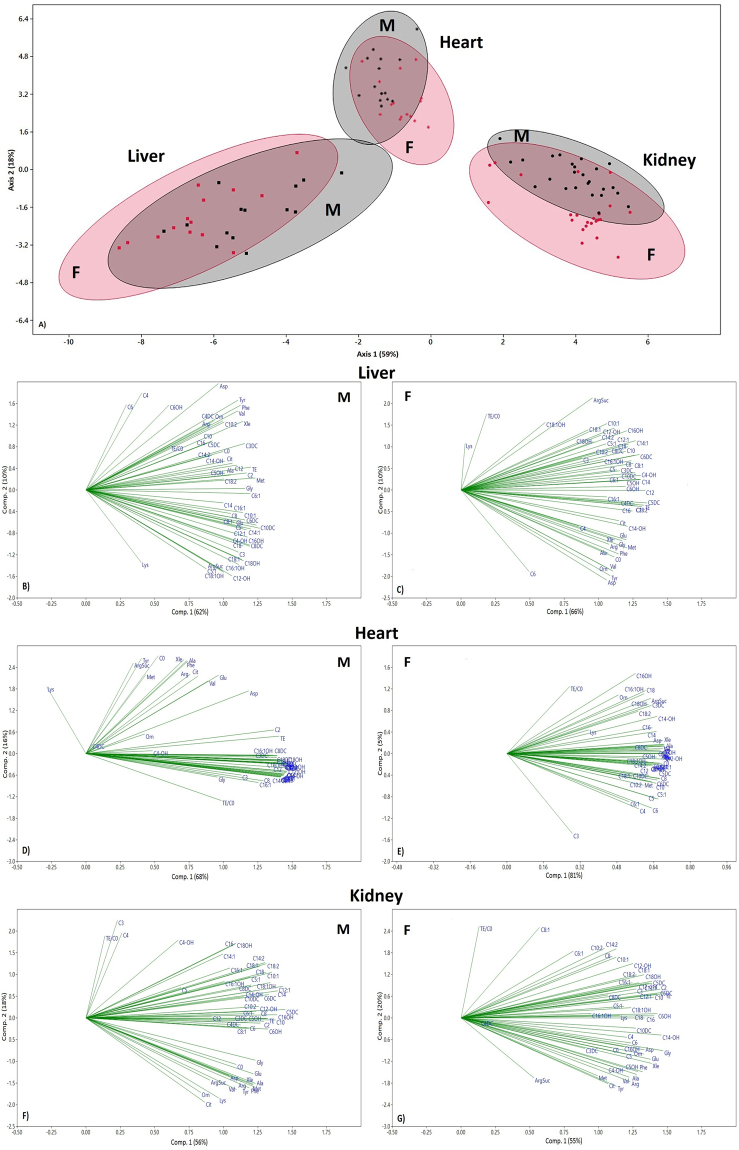
Sex differences affect several diseases and are organ-and parameter-specific. In humans and animals, sex differences also influence the metabolism and homeostasis of amino acids and fatty acids, which are linked to the onset of diseases. Thus, the use of targeted metabolite profiles in tissues represents a powerful approach to examine the intermediary metabolism and evidence for any sex differences. To clarify the sex-specific activities of liver, heart and kidney tissues, we used targeted metabolomics, linear discriminant analysis (LDA), principal component analysis (PCA), cluster analysis and linear correlation models to evaluate sex and organ-specific differences in amino acids, free carnitine and acylcarnitine levels in male and female Sprague-Dawley rats. Several intra-sex differences affect tissues, indicating that metabolite profiles in rat hearts, livers and kidneys are organ-dependent. Amino acids and carnitine levels in rat hearts, livers and kidneys are affected by sex: male and female hearts show the greatest sexual dimorphism, both qualitatively and quantitatively. Finally, multivariate analysis confirmed the influence of sex on the metabolomics profiling. Our data demonstrate that the metabolomics approach together with a multivariate approach can capture the dynamics of physiological and pathological states, which are essential for explaining the basis of the sex differences observed in physiological and pathological conditions.


Conflict of interest statement

The authors declare no competing interests.

Figures

Figure 1
Figure 1
Intra-sex analysis of amino acids in livers (black bars), hearts (white bars) and kidneys (grey bars) of male (M) and female (F) rats. Data are the medians ± MAD of 15 samples for each tissue and sex. aP < 0.05 between liver and heart; bP < 0.05 between kidney and liver; cP < 0.05 between heart and kidney.
Figure 2
Figure 2
(A) Amino acids levels in male (black bars) and female (white bars) hearts. (B) C0, TE and TE/C0 ratio in male (black bars) and female (white bars) hearts. Data are the medians ± MAD of 15 independent samples for each sex. *P < 0.05 and **P < 0.001, versus females. Percentage of variation in females is reported under amino acid names.
Figure 3
Figure 3
Intra-sex and inter-organ analysis of C0, TE and TE/C0 ratio in male and female livers (black bars), hearts (white bars) and kidneys (grey bars). Data are the medians ± MAD of 15 samples for each tissue and sex. aP < 0.05 between liver and heart; bP < 0.05 between kidney and liver; cP < 0.05 between heart and kidney. aP < 0.05 between liver and heart; bP < 0.05 between liver and kidney; cP < 0.05 between heart and kidney.
Figure 4
Figure 4
Intra-sex and inter-organ analysis of ACs in livers (black bars), hearts (white bars) and kidneys (grey bars) of male (M) and female (F) rats. Data are the medians ± MAD of 15 samples for each tissue and sex. aP < 0.05 between liver and heart; bP < 0.05 between liver and kidney; cP < 0.05 between heart and kidney.
Figure 5
Figure 5
Inter-sex analysis of AC levels (nmol/mg protein) in male (M) and female (F) rat hearts. Values are the medians ± MAD of 15 independent samples for each sex. *P < 0.05 versus females.
Figure 6
Figure 6
Cluster analysis depicting liver (A), heart (B) and kidney (C) sample distribution on the basis of Ward’s method used for hierarchical clustering. All dendrograms were constructed using together male and female samples per each organ metabolomic dataset. Male samples are depicted using a blue dot while female samples are in red.
Figure 7
Figure 7
LDA score plot of all molecules (Panel A) and PCA of all molecules stratified according to sex and organ (panel B–F). Panel A, black and the red colours indicate male and female samples, respectively. Plotted ellipses estimate a region where 95% of population points are expected to fall. Panels B and C represent PCA loading plots in male and female liver samples; Panels D and E represent PCA loading plots in male and female heart samples; and Panels F and G represent PCA loading plots in male and female kidney samples.

References

    1. Legato MJ. Boston. Amsterdam: Elsevier Academic Press; 2017. Principles of gender-specific medicine. Gender in the genomic era.
    1. Regitz-Zagrosek V, et al. Gender in cardiovascular diseases: impact on clinical manifestations, management, and outcomes. Eur Heart J. 2015;37:24–34. - PubMed
    1. Campesi I, Franconi F, Seghieri G, Meloni M. Sex-gender-related therapeutic approaches for cardiovascular complications associated with diabetes. Pharmacol Res. 2017;119:195–207. doi: 10.1016/j.phrs.2017.01.023. - DOI - PubMed
    1. Wang X, Magkos F, Mittendorfer B. Sex differences in lipid and lipoprotein metabolism: it’s not just about sex hormones. J Clin Endocrinol Metab. 2011;96:885–93. doi: 10.1210/jc.2010-2061. - DOI - PMC - PubMed
    1. Blaak E. Gender differences in fat metabolism. Curr Opin Clin Nutr Metab Care. 2001;4:499–502. doi: 10.1097/00075197-200111000-00006. - DOI - PubMed

LinkOut - more resources