. 2018 Mar 16;8(1):4727.
doi: 10.1038/s41598-018-23143-6.

Association between localized geohazards in West Texas and human activities, recognized by Sentinel-1A/B satellite radar imagery

Affiliations

Association between localized geohazards in West Texas and human activities, recognized by Sentinel-1A/B satellite radar imagery

Jin-Woo Kim et al. Sci Rep. .

Abstract

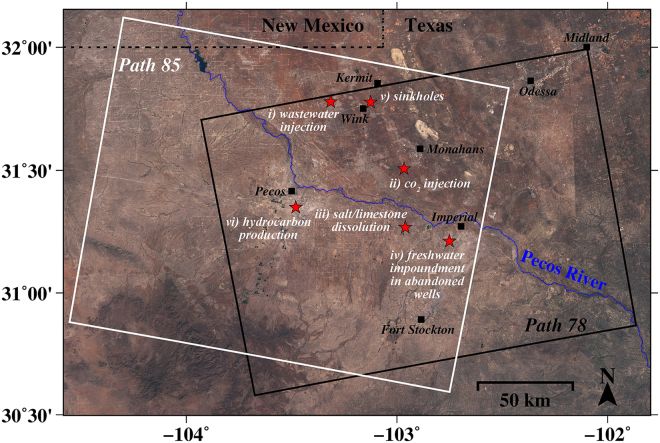
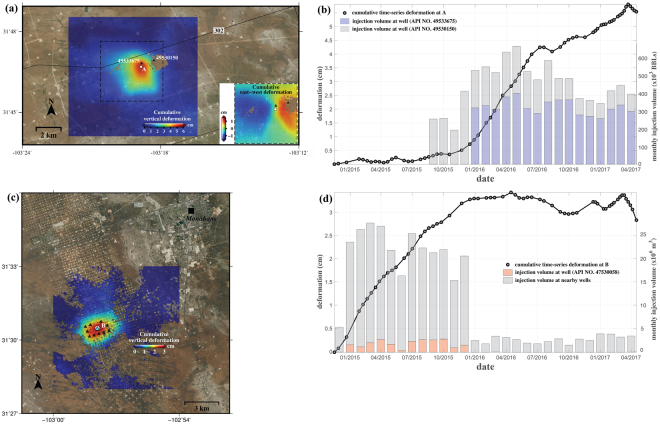
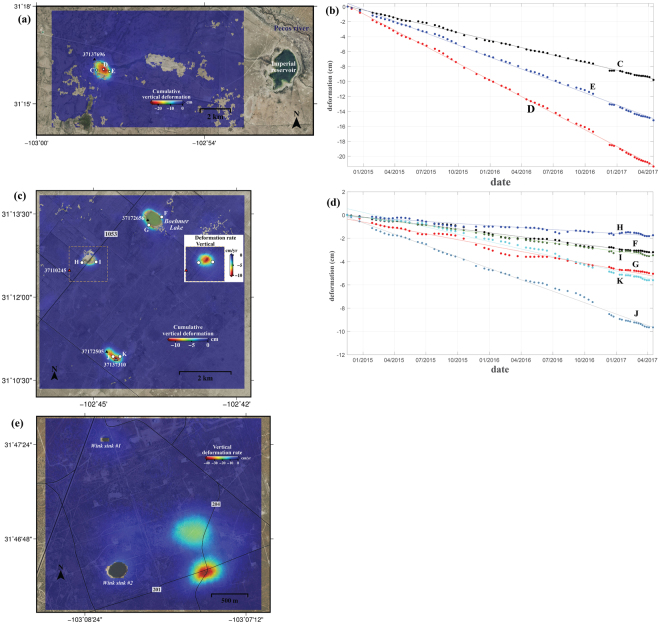
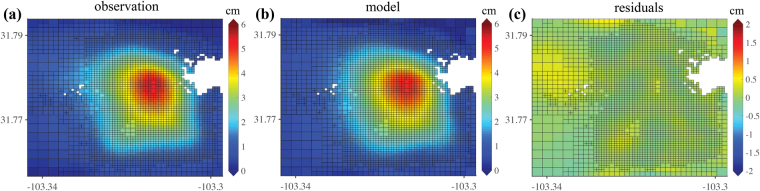
West Texas' Permian Basin, consisting of ancient marine rocks, is underlain by water-soluble rocks and multiple oil-rich formations. In the region that is densely populated with oil producing facilities, many localized geohazards, such as ground subsidence and micro-earthquakes, have gone unnoticed. Here we identify the localized geohazards in West Texas, using the satellite radar interferometry from newly launched radar satellites that provide radar images freely to public for the first time, and probe the causal mechanisms of ground deformation, encompassing oil/gas production activities and subsurface geological characteristics. Based on our observations and analyses, human activities of fluid (saltwater, CO2) injection for stimulation of hydrocarbon production, salt dissolution in abandoned oil facilities, and hydrocarbon extraction each have negative impacts on the ground surface and infrastructures, including possible induced seismicity. Proactive continuous and detailed monitoring of ground deformation from space over the currently operating and the previously operated oil/gas production facilities, as demonstrated by this research, is essential to securing the safety of humanity, preserving property, and sustaining the growth of the hydrocarbon production industry.


Conflict of interest statement

The authors declare no competing interests.

Figures

Figure 1
Figure 1
Locations of ground deformation in West Texas. 6 major sites (red stars) in West Texas display the locations influenced by human activities identified based on Sentinel-1A/B multi-temporal interferometry (background image is from Sentinel-2). To estimate 2D (east-west and vertical) deformation, the ascending (path 78; black box) and descending (path 85; white box) track Sentinel-1A/B images were integrated over the overlapped regions. West Texas’ Permian Basin contains two major aquifer systems under the influence of the Pecos River, the Pecos Valley aquifer and the Edwards-Trinity aquifer. The figure has been created using open-source software Generic Mapping Tools (GMT) 5.2.2_r15292 available at http://gmt.soest.hawaii.edu/projects/gmt/wiki/Download. The Sentinel-1A/B data used in this study were downloaded in 2017 through the Vertex online archive https://vertex.daac.asf.alaska.edu provided by Alaska Satellite Facility (ASF) and the Sentinel-2 data used as a background image for this figure were obtained in 2017 through Copernicus open access hub https://scihub.copernicus.eu provided by the European Space Agency (ESA)’s Copernicus Programme.
Figure 2
Figure 2
Ground uplift due to fluid (wastewater, CO2) injection. (a) Uplift in Winker County, TX, induced by wastewater injection in nearby wells (API No. 49533675, 49530150). Inset illustrates cumulative east-west deformation in the box outlined by a dashed rectangle. (b) Time-series cumulative vertical deformation in a point A (Fig. 2a) and the volume of injected wastewater (blue and gray bars) in two injection wells. (c) Uplift in Ward County, TX, induced by CO2 injection in an EOR field (triangles). (d) Time-series cumulative vertical deformation in a point B of Fig. 2c and the volume of injected CO2 (orange and gray bars) in EOR injection wells of Fig. 2c. The figures including spatial information have been created using open-source software GMT 5.2.2_r15292 available at http://gmt.soest.hawaii.edu/projects/gmt/wiki/Download. The National Agriculture Imagery Program (NAIP) images used as a background of the figures were downloaded in 2017 through Geospatial Data Gateway https://datagateway.nrcs.usda.gov provided by United States Department of Agriculture (USDA).
Figure 3
Figure 3
Ground subsidence in karst terrain underlain by limestone and salt. (a) Cumulative vertical deformation in Santa Rosa Spring. (b) Time-series cumulative vertical deformation at C, D, and E points of Fig. 3a. (c) Cumulative vertical deformation around abandoned wells in Imperial, Texas. Inset represents the averaged deformation rate in a boxed region by stacking interferograms of less than 12 days. (d) Time-series cumulative vertical deformation at F, G, H, I, J, and K of Fig. 3c. (e) Vertical deformation rate around Wink sinkholes. The figures including spatial information have been created using open-source software GMT 5.2.2_r15292 available at http://gmt.soest.hawaii.edu/projects/gmt/wiki/Download. The NAIP images used as a background of the figures were downloaded in 2017 through Geospatial Data Gateway https://datagateway.nrcs.usda.gov provided by USDA.
Figure 4
Figure 4
Ground deformation in Pecos, Texas, induced by hydrocarbon production. (a) Cumulative ground deformation in a hydrocarbon production field of Pecos, Texas. (b) Time-series cumulative vertical deformation in points (L, M, N, O) of Fig. 4a. Yellow stars represent seismic events (along with magnitude and depth) occurring less than 15 km from the subsidence area between late 2014 and April 2017. Oil production (blue and orange bars) volumes in the surrounding wells correlate to the triangles in Fig. 4a. The figure has been created using open-source software GMT 5.2.2_r15292 available at http://gmt.soest.hawaii.edu/projects/gmt/wiki/Download. The NAIP images used as a background of the figures were downloaded in 2017 through Geospatial Data Gateway https://datagateway.nrcs.usda.gov provided by USDA.
Figure 5
Figure 5
Modeled results of cumulative InSAR vertical deformation around wastewater injection wells. (a) observed cumulative vertical deformation in the box outlined by a dashed rectangle (Fig. 2a). (b) modeled vertical deformation. (c) residuals (observation – model). The figure has been created using MATLAB R2017a licensed by Southern Methodist University.

References

    1. Hyndman, D. & Hyndman, D. Natural Hazards and Disasters (Brooks Cole, 2016).
    1. Yuan H, Romanowicz B. Lithospheric layering in the North American craton. Nature. 2010;466:1063–1069. doi: 10.1038/nature09332. - DOI - PubMed
    1. McGarr A, et al. Coping with earthquakes induced by fluid injection. Science. 2015;347:830–831. doi: 10.1126/science.aaa0494. - DOI - PubMed
    1. Qu F, et al. Mapping ground deformation over Houston-Galveston, Texas using multi-temporal InSAR. Remote Sens. Environ. 2015;169:290–306. doi: 10.1016/j.rse.2015.08.027. - DOI
    1. Buckley SM, Rosen PA, Hensley S, Tapley BD. Land subsidence in Houston, Texas, measured by radar interferometry and constrained by extensometers. J. Geophys. Res. Solid Earth. 2003;108:B11. doi: 10.1029/2002JB001848. - DOI

Publication types

LinkOut - more resources