. 2018 Mar 16;8(1):4698.
doi: 10.1038/s41598-018-23090-2.

A proteomic insight into vitellogenesis during tick ovary maturation

Affiliations

A proteomic insight into vitellogenesis during tick ovary maturation

Marina Amaral Xavier et al. Sci Rep. .

Abstract

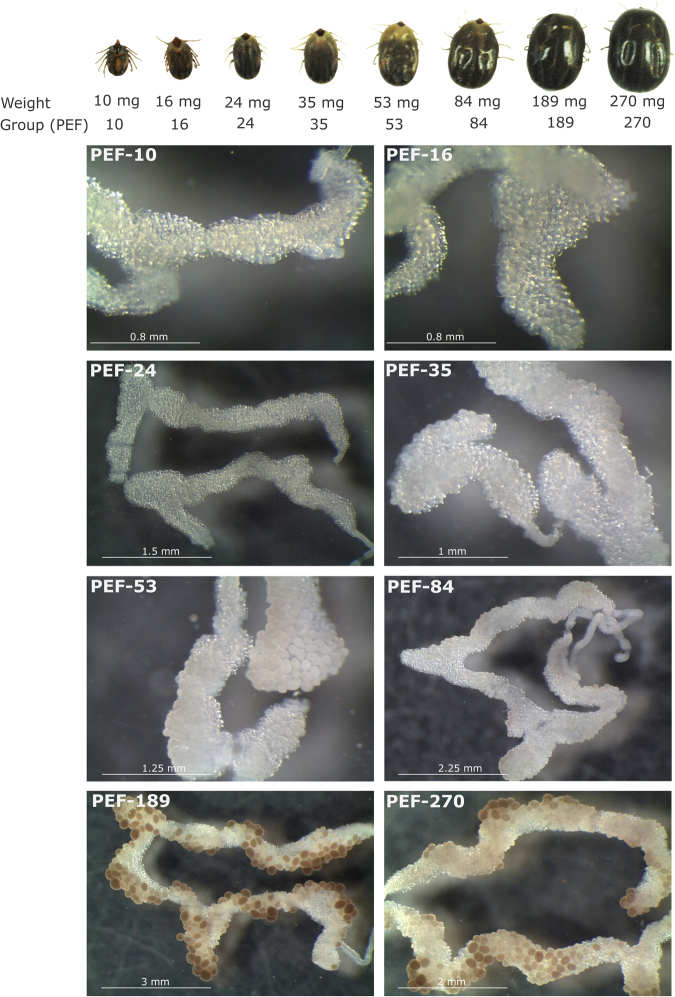
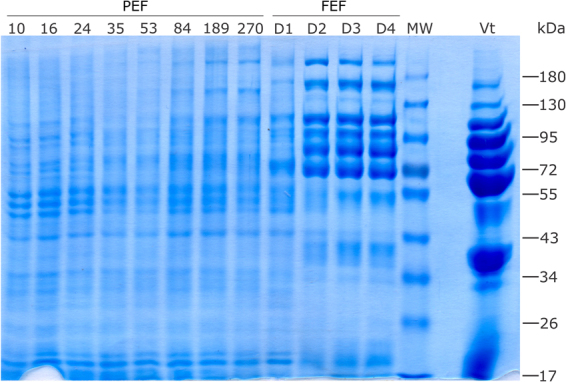
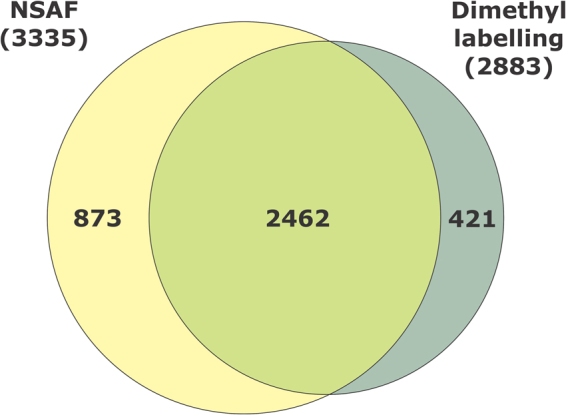
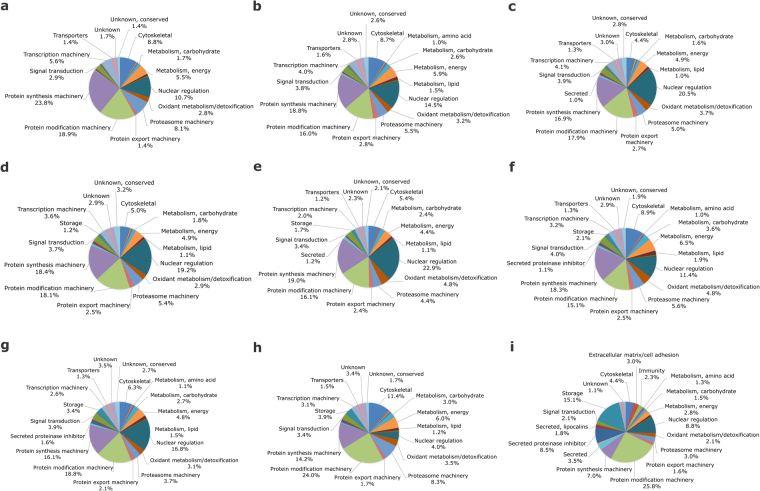
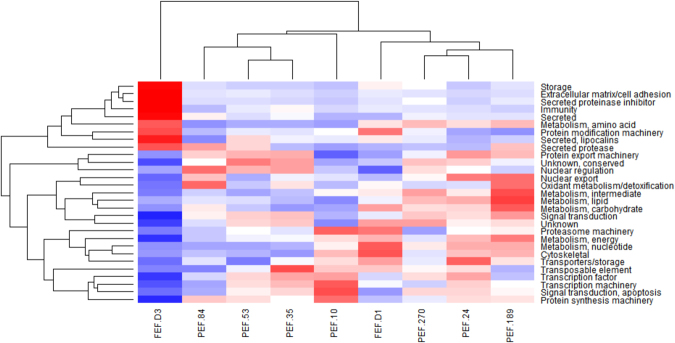
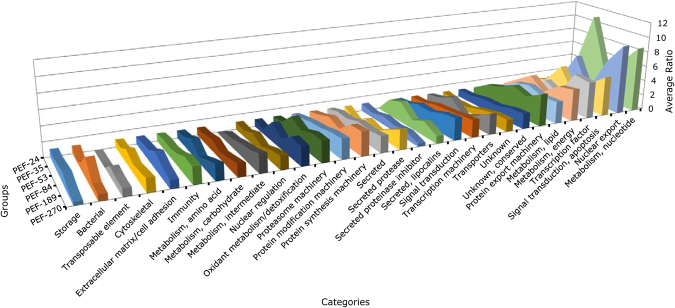
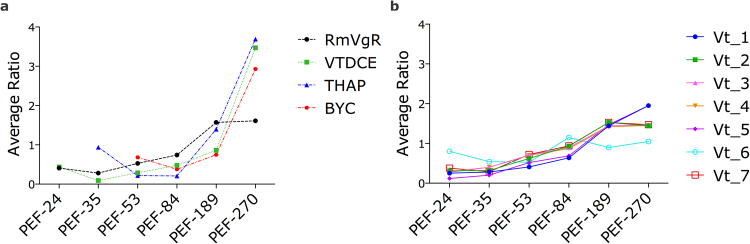
Ticks are arthropod ectoparasites of importance for public and veterinary health. The understanding of tick oogenesis and embryogenesis could contribute to the development of novel control methods. However, to date, studies on the temporal dynamics of proteins during ovary development were not reported. In the present study we followed protein profile during ovary maturation. Proteomic analysis of ovary extracts was performed by liquid chromatography-tandem mass spectrometry (LC-MS/MS) using shotgun strategy, in addition to dimethyl labelling-based protein quantification. A total of 3,756 proteins were identified, which were functionally annotated into 30 categories. Circa 80% of the annotated proteins belong to categories related to basal metabolism, such as protein synthesis and modification machineries, nuclear regulation, cytoskeleton, proteasome machinery, transcriptional machinery, energetic metabolism, extracellular matrix/cell adhesion, immunity, oxidation/detoxification metabolism, signal transduction, and storage. The abundance of selected proteins involved in yolk uptake and degradation, as well as vitellin accumulation during ovary maturation, was assessed using dimethyl-labelling quantification. In conclusion, proteins identified in this study provide a framework for future studies to elucidate tick development and validate candidate targets for novel control methods.


Conflict of interest statement

The authors declare no competing interests.

Figures

Figure 1
Figure 1
Representative images of specimens and ovaries of Rhipicephalus microplus partially engorged females (PEF) groups. PEF were grouped according to average weight of individuals (10 ± 1.73 mg, 16 ± 1.22 mg, 24 ± 1.90 mg, 35 ± 2.84 mg, 53 ± 2.49 mg, 84 ± 8.36 mg, 189 ± 17.17 mg, 270 ± 16.71 mg). Ovary images (from PEF-10 to PEF-270) exemplify the ovaries from PEF groups used in this study, which correspond to ovarian growth phase (OGP) categorisation: PEF-10, -16 and -24 (OGP 1); PEF-35 (OGP 2); PEF-53 and -84 (OGP 3); PEF-189 and -270 (OGP 4). Numbers of ticks composing each group are: PEF-10 (n = 10), PEF-16 (n = 9), PEF-24 (n = 28), PEF-35 (n = 23), PEF-53 (n = 8), PEF-84 (n = 9), PEF-189 (n = 5), PEF-270 (n = 5). FEF groups D1, D2, D3, and D4 were composed by ovaries from 5 ticks.
Figure 2
Figure 2
Electrophoretic profile of Rhipicephalus microplus ovary proteins. The protein profile of ovaries from partially engorged female groups (PEF-10, -16, -24, -35, -53, -84, -189, and -270) and fully engorged females (FEF) groups, which were categorised according to post-detachment day (D1, D2, D3 and D4), were analysed by SDS-PAGE. Approximately 50 µg of total protein was resolved on 10% gels and stained with Coomassie blue. MW: molecular weight standards, indicated in kDa on the right; Vt: purified Rhipicephalus microplus vitellin. Numbers of ticks composing each group are: PEF-10 (n = 10), PEF-16 (n = 9), PEF-24 (n = 28), PEF-35 (n = 23), PEF-53 (n = 8), PEF-84 (n = 9), PEF-189 (n = 5), PEF-270 (n = 5). FEF groups D1, D2, D3, and D4 were composed by ovaries from 5 ticks. This image is representative of two independent SDS-PAGE experiments.
Figure 3
Figure 3
Number of proteins identified in Rhipicephalus microplus ovaries using two different approaches. Venn diagram comparing number of proteins identified in semi-quantitative normalised spectral abundance factor (NSAF) analysis, and quantitative dimethyl labelling analysis.
Figure 4
Figure 4
Functional clusterisation of Rhipicephalus microplus ovary proteins. Proteomic analysis was performed in partially engorged females, groups PEF-10 (a), -24 (b), -35 (c), -53 (d), -84 (e), -189 (f), and -270 (g); and fully engorged females, groups FEF-D1 (h) and -D3 (i). Pie charts represent the percentage of proteins found in each group respective to normalised spectral counting (NSAF) for each sample. Numbers of ticks composing each group are: PEF-10 (n = 10), PEF-16 (n = 9), PEF-24 (n = 28), PEF-35 (n = 23), PEF-53 (n = 8), PEF-84 (n = 9), PEF-189 (n = 5), PEF-270 (n = 5). FEF groups D1, D2, D3, and D4 were composed by ovaries from 5 ticks.
Figure 5
Figure 5
Protein abundance in Rhipicephalus microplus ovaries. Heat map of NSAF data for each protein is expressed as a per cent of total NSAF per group within each category. Z-scores were calculated and used to generate heat maps as described in Material and Methods section. Red colour indicates proteins of high abundance and blue colour indicates proteins of low abundance. Dendrogram on the left shows protein clustering according to functional annotation.
Figure 6
Figure 6
Quantitative proteomic analysis of Rhipicephalus microplus partially engorged females (PEF) ovaries. Dimethyl labelling quantification of ovary proteins in PEF groups -24, -35, -53, -84, -189 and -270 was performed. Area chart shows the variation in protein levels (y axis) as a function of ovary maturation (z axis). The x axis shows the categories in which proteins were clustered. The data from each group was normalised relative to the group PEF-24. Numbers of ticks composing each group are: PEF-10 (n = 10), PEF-16 (n = 9), PEF-24 (n = 28), PEF-35 (n = 23), PEF-53 (n = 8), PEF-84 (n = 9), PEF-189 (n = 5), PEF-270 (n = 5).
Figure 7
Figure 7
Profiles of abundance of proteins involved in yolk processing and vitellin (Vt) accumulation in Rhipicephalus microplus ovaries. Dimethyl labelling quantification was performed in ovary extracts of partially engorged female groups PEF-24, -35, -53, -84, 189, -270. For dimethyl labelling quantification, the ratio is the intensity detected for each peptide, relative to the internal standard (a protein pool of all samples used in this study). The average ratio of a protein is calculated as the mean ratio of its peptides. Chart (a) shows protein average ratio of the receptor involved in yolk uptake, Rhipicephalus microplus Vitellogenin Receptor (RmVgR), and the proteases implicated in yolk degradation, namely Vitellin-Degrading Cysteine Endopeptidase (VTDCE), Tick Haeme-binding Aspartic Proteinase (THAP), and Boophilus Yolk pro-Cathepsin (BYC). Chart (b) shows average ratio of Vt polypeptides. Numbers of ticks composing each group are: PEF-10 (n = 10), PEF-16 (n = 9), PEF-24 (n = 28), PEF-35 (n = 23), PEF-53 (n = 8), PEF-84 (n = 9), PEF-189 (n = 5), PEF-270 (n = 5).
Figure 8
Figure 8
Vitellin (Vt) and vitellin degrading cysteine endopeptidase (VTDCE) in Rhipicephalus microplus ovaries analysed by western blot. Protein extracts from partially (PEF) and fully engorged females (FEF) ovaries were probed with rabbit antibodies (a) anti-Vt and (b) anti-VTDCE. PEF groups: -10, -16, -24, -35, -53, -84, -189, -270; FEF groups: -D1, -D2, -D3 and -D4. Gaps were created in the images to delineate the stages of ovary maturation, but both parts are from the same gel. This image is representative of two (for VTDCE) and four (for Vt) independent western blot. Numbers of ticks composing each group are: PEF-10 (n = 10), PEF-16 (n = 9), PEF-24 (n = 28), PEF-35 (n = 23), PEF-53 (n = 8), PEF-84 (n = 9), PEF-189 (n = 5), PEF-270 (n = 5). FEF groups D1, D2, D3, and D4 were composed by ovaries from 5 ticks. This image is representative of two (for VTDCE) and four (for Vt) independent western blot.
Figure 9
Figure 9
Quantification of proteins in selected metabolic pathways related to vitellogenesis. Dimethyl labelling quantification was performed in ovary extracts of partially engorged female (PEF) groups -24, -35, -53, -84, 189, -270. The ratio is the intensity detected for each peptide, relative to the internal standard (a protein pool of all ovary groups used in this study). The average ratio of a protein is calculated as the mean ratio of its peptides. The average ratio of each metabolic pathway presented in this graph was calculated from the average quantification (with standard deviation) of enzymes involved in each pathway (Supplementary Fig. S1). Numbers of ticks composing each group are: PEF-10 (n = 10), PEF-16 (n = 9), PEF-24 (n = 28), PEF-35 (n = 23), PEF-53 (n = 8), PEF-84 (n = 9), PEF-189 (n = 5), PEF-270 (n = 5).

References

    1. Dantas-Torres F, Chomel BB, Otranto D. Ticks and tick-borne diseases: a one health perspective. Trends in Parasitology. 2012;28:437–446. doi: 10.1016/j.pt.2012.07.003. - DOI - PubMed
    1. Grisi L, et al. Reassessment of the potential economic impact of cattle parasites in Brazil. Braz. J. Vet. Parasitol., Jaboticabal. 2014;23:150–156. doi: 10.1590/S1984-29612014042. - DOI - PubMed
    1. Roberts JA. Resistance of cattle to the tick Boophilus microplus (canestrini). II. Stages of the life cycle of the parasite against which resistance is manifest. J. Parasitol. 1968;54:667–673. doi: 10.2307/3277017. - DOI - PubMed
    1. Oliver JH. Biology and systematics of ticks (Acari:Ixodida) Annu. Rev. Ecol. Syst. 1989;20:397–430. doi: 10.1146/annurev.es.20.110189.002145. - DOI
    1. Estrela AB, Seixas A, Teixeira VDON, Pinto AFM, Termignoni C. Vitellin- and hemoglobin-digesting enzymes in Rhipicephalus (Boophilus) microplus larvae and females. Comp. Biochem. Physiol. 2010;157:326–35. doi: 10.1016/j.cbpb.2010.08.002. - DOI - PubMed

Publication types

LinkOut - more resources