. 2018 Mar 16;9(1):1107.
doi: 10.1038/s41467-018-03441-3.

A DHODH inhibitor increases p53 synthesis and enhances tumor cell killing by p53 degradation blockage

Affiliations

A DHODH inhibitor increases p53 synthesis and enhances tumor cell killing by p53 degradation blockage

Marcus J G W Ladds et al. Nat Commun. .

Erratum in

  • Publisher Correction: A DHODH inhibitor increases p53 synthesis and enhances tumor cell killing by p53 degradation blockage.
    Ladds MJGW, van Leeuwen IMM, Drummond CJ, Chu S, Healy AR, Popova G, Pastor Fernández A, Mollick T, Darekar S, Sedimbi SK, Nekulova M, Sachweh MCC, Campbell J, Higgins M, Tuck C, Popa M, Safont MM, Gelebart P, Fandalyuk Z, Thompson AM, Svensson R, Gustavsson AL, Johansson L, Färnegårdh K, Yngve U, Saleh A, Haraldsson M, D'Hollander ACA, Franco M, Zhao Y, Håkansson M, Walse B, Larsson K, Peat EM, Pelechano V, Lunec J, Vojtesek B, Carmena M, Earnshaw WC, McCarthy AR, Westwood NJ, Arsenian-Henriksson M, Lane DP, Bhatia R, McCormack E, Laín S. Ladds MJGW, et al. Nat Commun. 2018 May 22;9(1):2071. doi: 10.1038/s41467-018-04198-5. Nat Commun. 2018. PMID: 29789663 Free PMC article.
  • Publisher Correction: A DHODH inhibitor increases p53 synthesis and enhances tumor cell killing by p53 degradation blockage.
    Ladds MJGW, van Leeuwen IMM, Drummond CJ, Chu S, Healy AR, Popova G, Fernández AP, Mollick T, Darekar S, Sedimbi SK, Nekulova M, Sachweh MCC, Campbell J, Higgins M, Tuck C, Popa M, Safont MM, Gelebart P, Fandalyuk Z, Thompson AM, Svensson R, Gustavsson AL, Johansson L, Färnegårdh K, Yngve U, Saleh A, Haraldsson M, D'Hollander ACA, Franco M, Zhao Y, Håkansson M, Walse B, Larsson K, Peat EM, Pelechano V, Lunec J, Vojtesek B, Carmena M, Earnshaw WC, McCarthy AR, Westwood NJ, Arsenian-Henriksson M, Lane DP, Bhatia R, McCormack E, Laín S. Ladds MJGW, et al. Nat Commun. 2023 Aug 18;14(1):5019. doi: 10.1038/s41467-023-40764-2. Nat Commun. 2023. PMID: 37596290 Free PMC article. No abstract available.

Abstract

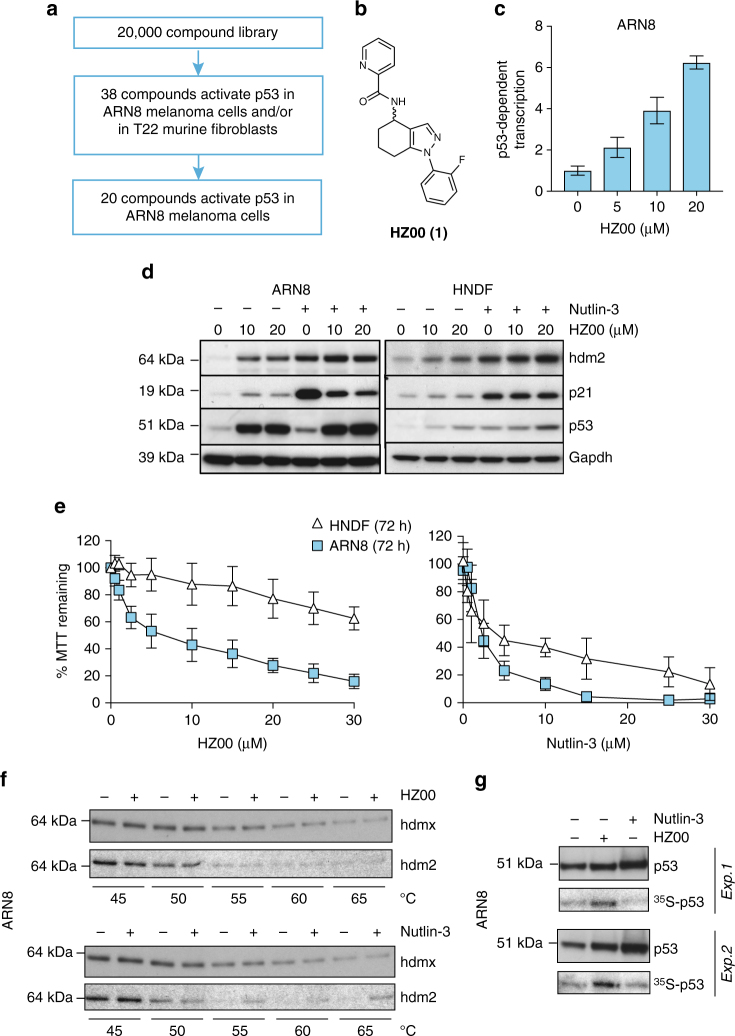
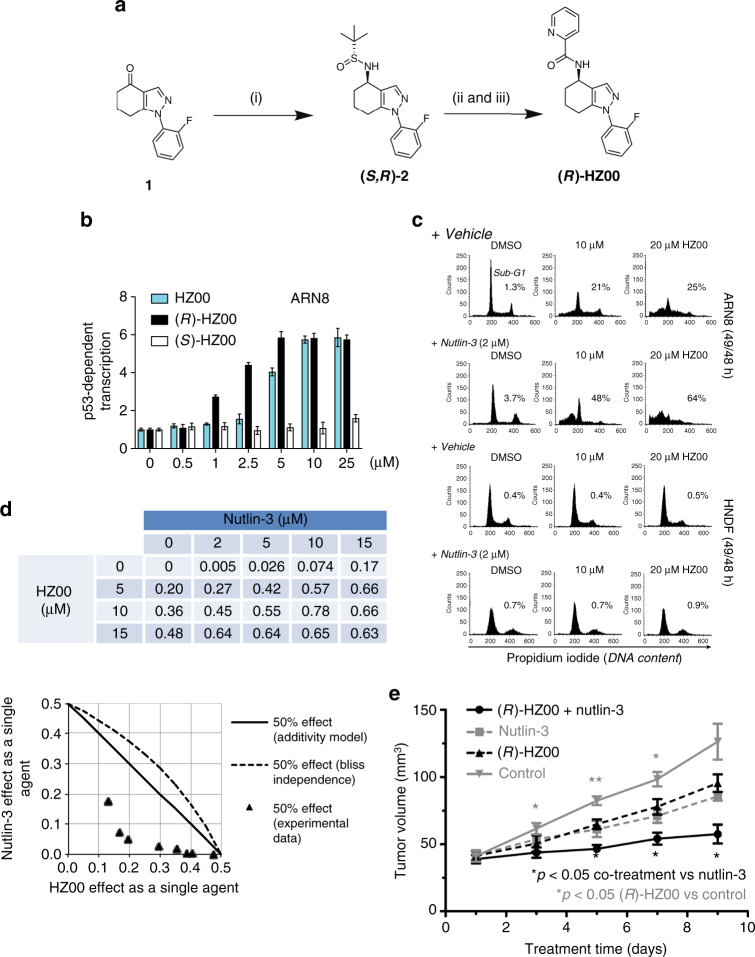
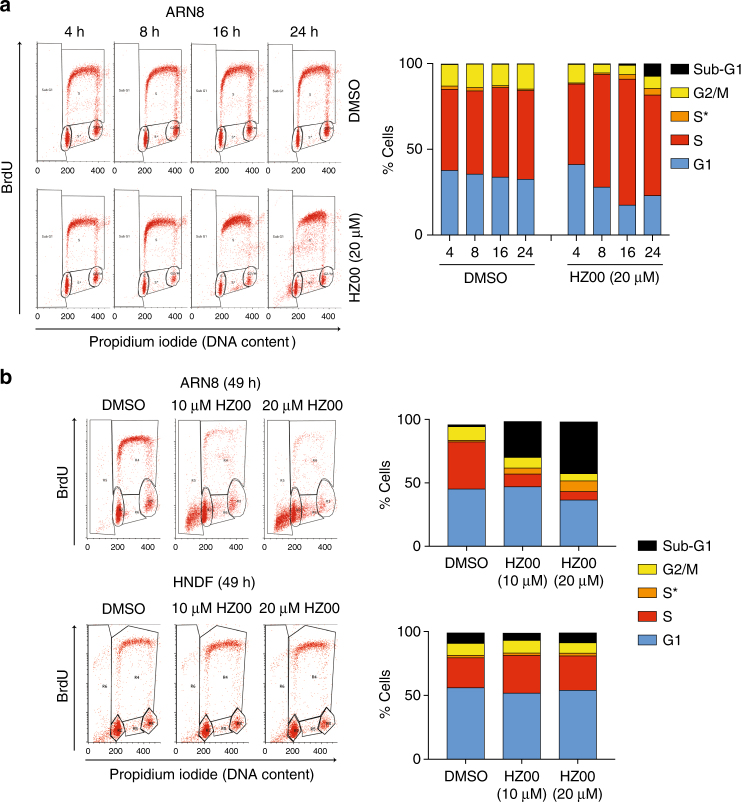
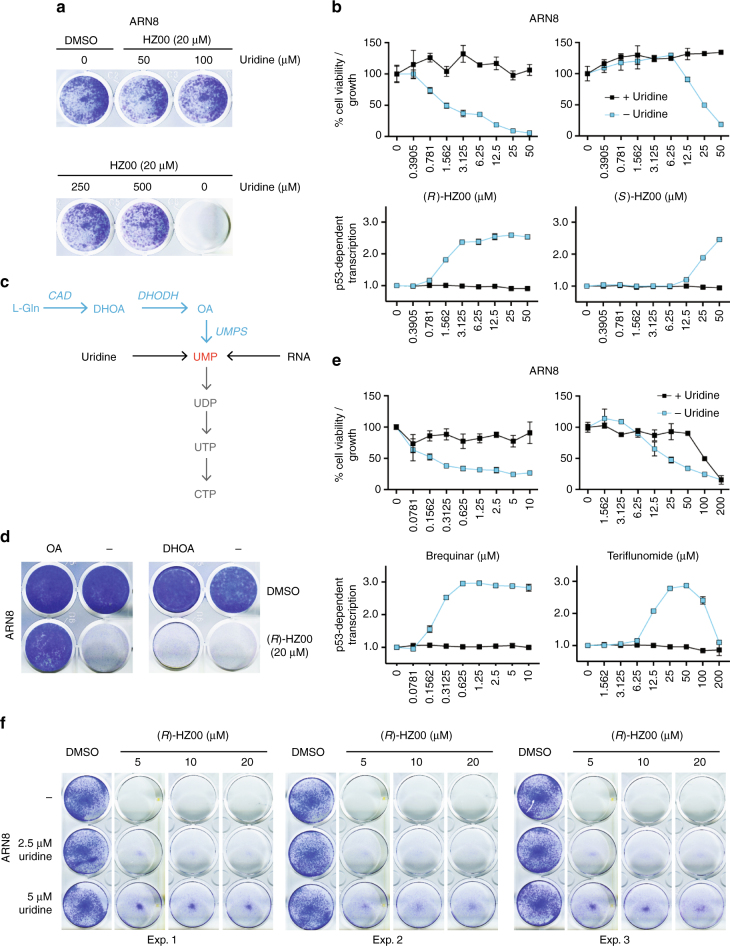
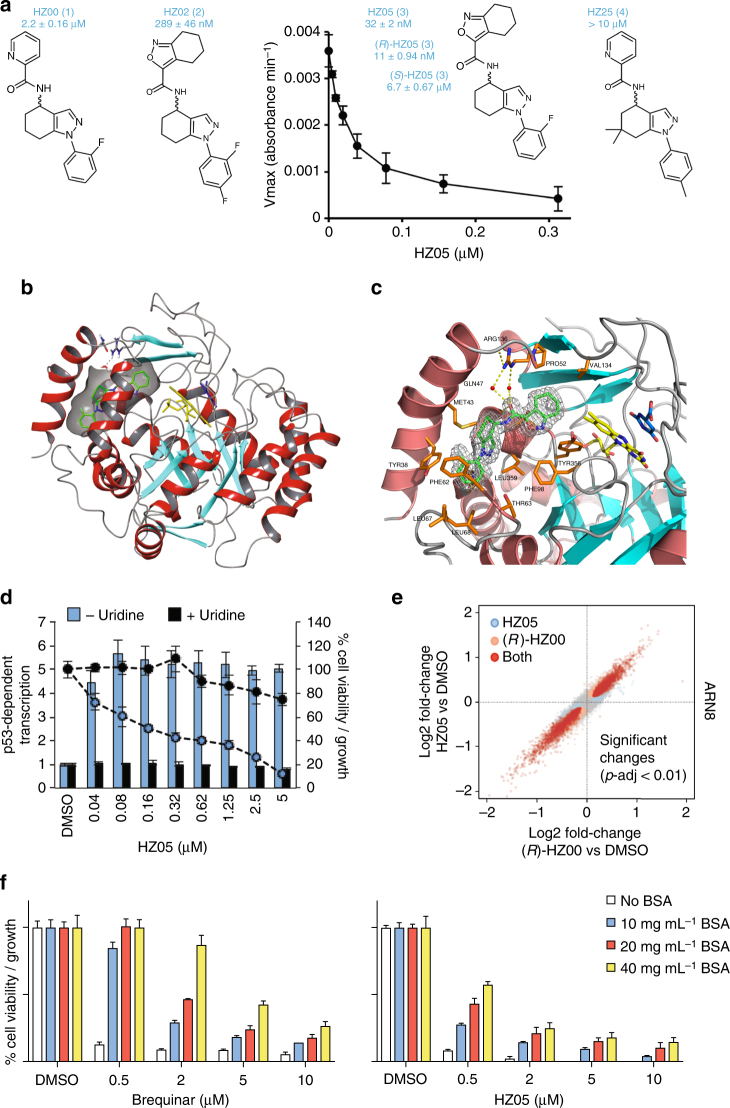
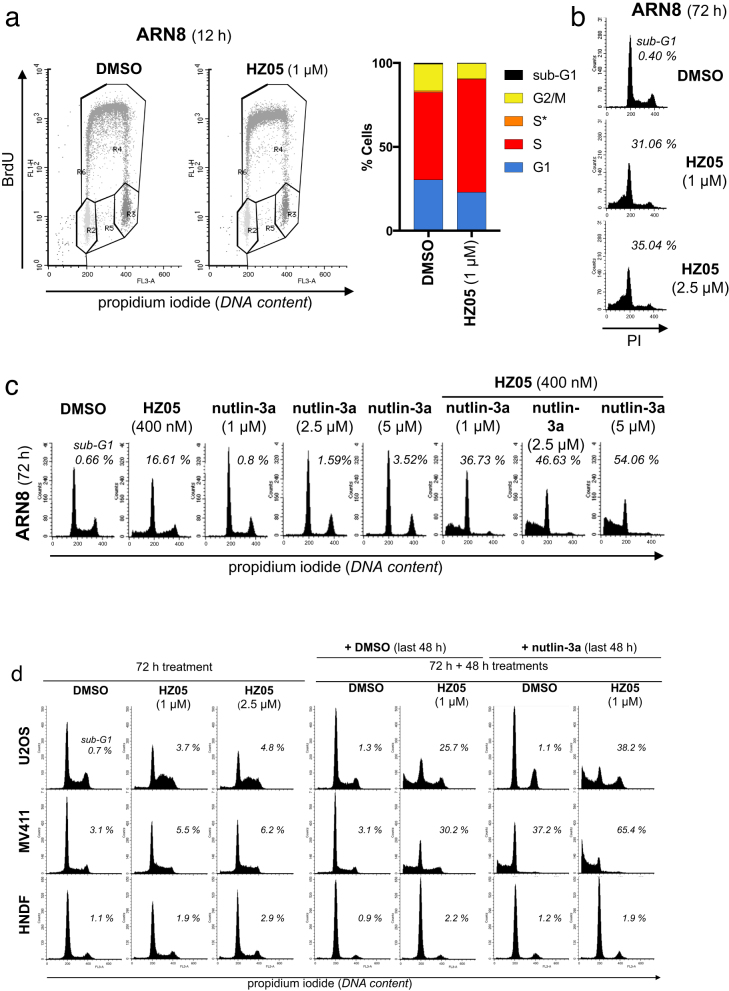
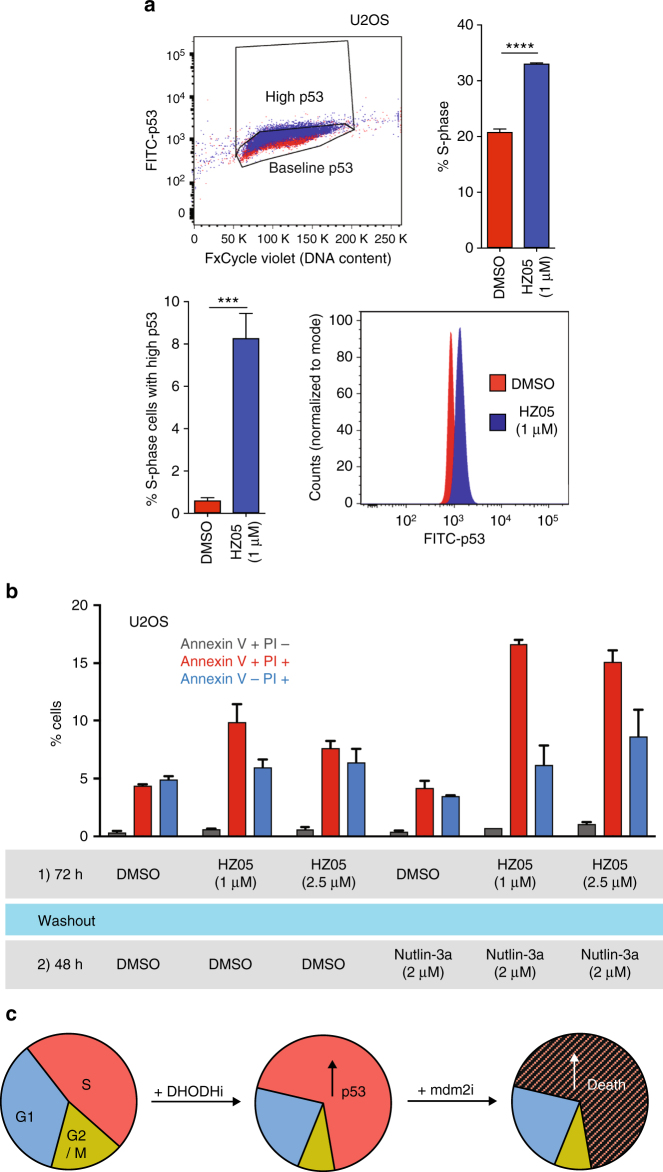
The development of non-genotoxic therapies that activate wild-type p53 in tumors is of great interest since the discovery of p53 as a tumor suppressor. Here we report the identification of over 100 small-molecules activating p53 in cells. We elucidate the mechanism of action of a chiral tetrahydroindazole (HZ00), and through target deconvolution, we deduce that its active enantiomer (R)-HZ00, inhibits dihydroorotate dehydrogenase (DHODH). The chiral specificity of HZ05, a more potent analog, is revealed by the crystal structure of the (R)-HZ05/DHODH complex. Twelve other DHODH inhibitor chemotypes are detailed among the p53 activators, which identifies DHODH as a frequent target for structurally diverse compounds. We observe that HZ compounds accumulate cancer cells in S-phase, increase p53 synthesis, and synergize with an inhibitor of p53 degradation to reduce tumor growth in vivo. We, therefore, propose a strategy to promote cancer cell killing by p53 instead of its reversible cell cycle arresting effect.


Conflict of interest statement

S.L. has filed a patent application on the use of HZ compounds for cancer treatment, which was sent for publication on 4 May 2017. The remaining authors declare no competing interest.

Figures

Fig. 1
Fig. 1
Discovery and activity of HZ00. a Compound library screening strategy to identify 20 compounds capable of activating p53 transcriptional function in ARN8 melanoma cells >1.5-fold and did not activate or did so below 1.5-fold in T22 fibroblasts. b The structure of HZ00 (1). c p53 wild-type ARN8 human melanoma cells were treated for 16 h with HZ00 and the level of p53-dependent transcription measured by CPRG assay. Values correspond to the average of three technical repeats ± SD and are representative of 5 biological replicates. d ARN8 or HNDF were treated with HZ00 for 1 h and then 2 µM nutlin-3 was added for an additional 18 h. Levels of p53, as well as downstream targets hdm2 (human mdm2) and p21 were determined. Levels of gapdh were used to monitor protein loading. e ARN8 or HNDF cells were treated with the indicated compound concentrations for 72 h and subjected to MTT assays. Values correspond to the average of 4 (HZ00) or 3 (nutlin-3) biological replicates ± SD. f ARN8 soluble cell extracts were prepared for the cellular thermal shift assay (CETSA) in PBS as described and subjected to increasing temperatures in the absence or presence of 100 μM HZ00 or nutlin-3. Samples were centrifuged and hdm2 or hdmx were detected in the supernatants. g ARN8 cells were treated with 20 μM HZ00, 5 μM nutlin-3 or vehicle (DMSO) for 5 h 50 min and pulse labeled with 35S-Met-Cys for 30 min (6 h 20 min total). p53 was immunoprecipitated and p53 protein levels were determined by western blotting. Incorporation of 35S in the p53 immunoprecipitate was determined by autoradiography. The experiment is shown in duplicate
Fig. 2
Fig. 2
Synthesis and characterization of HZ00 and its enantiomers. a Synthetic route to (R)-HZ00 involving the use of Ellman’s chiral auxillary. Reagents and conditions: (i) (1.1) (SS)-2-methyl-2-propanesulfinamide, Ti(OEt)4, THF, 75 °C, (1.2) L-Selectride, THF, −48 °C, 73%, diastereomeric excess (d.e. 84 %). (ii) HCl, MeOH, RT; (iii) 2-picolinic acid, EDC.HCl, Et3N, HOBt, DMAP, DCM, RT, 82% over 2 steps. b p53 wild-type ARN8 human melanoma cells were treated for 16 h with the indicated compounds and the level of p53-dependent transcription measured by CPRG assay. Values correspond to the average of 3 technical repeats ± SD. c ARN8 or HNDF cells were treated with HZ00 for 1 h and then 2 µM nutlin-3 was added for an additional 48 h. Cells were fixed and stained with propidium iodide (PI) and analyzed by flow cytometry. The percentages of sub-G1 cells are indicated. d ARN8 cells were treated for 72 h with HZ00 and/or nutlin-3 at the indicated doses. After treatment, cell cycle distribution was analyzed by flow cytometry following staining with PI. The effect of the compounds was quantified by obtaining the percentage of cells in sub-G1. The table shows the DMSO control subtracted effect for each dose combination (dH, dN). The curves in the normalized EC50 isobologram for the HZ00-nutlin-3 combination indicate single-effect pairs (x, y) = (Eff[dH]/100, Eff[dN]/100) expected to give a 0.5 effect in combination according to the additivity (solid line) and Bliss independence (dashed line) models, respectively. Data points (triangles) indicate pairs (x, y) that give 0.5 effect based on linear interpolation of the experimental data shown in the combination matrix above. e The combination of (R)-HZ00 (150 mg kg−1) and nutlin-3 (100 mg kg−1) was assayed in a xenograft model of ARN8, and significantly inhibited growth in this model compared with control groups (i.e., (R)-HZ00, nutlin-3 or vehicle). n = 5 mice per group. Error bars illustrate ± SEM. (***p < 0.001, **p < 0.01 and *p < 0.05). P-values were calculated using multiple Student’s t-tests
Fig. 3
Fig. 3
HZ00 accumulates cancer cells in S-phase. a, b ARN8 or HNDF cells were treated with HZ00 for the indicated times and analyzed by BrdU/PI flow cytometry with the percentage in each cell cycle phase graphed. S* indicates cells with a DNA content between 2N and 4N that do not incorporate BrdU
Fig. 4
Fig. 4
DHODH is a target of HZ00. a ARN8 cells were treated with HZ00 and the indicated amounts of uridine for 96 h followed by fixation with 50:50 methanol:acetone and subsequent staining with 7.5% Giemsa solution. b ARN8 cells were treated for 96 h with the indicated compounds in the presence and absence of uridine (100 μM) and analyzed using an SRB assay. Additionally, ARN8 cells were treated for 16 h and p53-dependent transcription was measured by CPRG assay. Values correspond to the average of three technical repeats ± SD. c Simplified description of the pyrimidine nucleotide de novo (blue) and salvage (black) pathways. d ARN8 cells were seeded in FBS supplemented DMEM with a change to serum replacement medium 24 h post seeding. Cells were treated for 6 days with (R)-HZ00 in the presence of 1.5 mM orotic acid (OA, Sigma #O2750) or 1.5 mM dihydroorotic acid (DHOA, Sigma #D7003) and stained with Giemsa as described in a. e ARN8 cells were treated as in b but using DHODH inhibitors brequinar and teriflunomide. Values correspond to the average of three technical repeats ± SD. f ARN8 cells were seeded in FBS supplemented DMEM with a change to serum replacement medium 24 h post seeding. Cells were then treated with (R)-HZ00 for 72 h in the presence of 2.5 or 5 μM uridine and stained with Giemsa as described in a
Fig. 5
Fig. 5
Characterization of the more potent analog HZ05. a Compound structures and IC50 values obtained using a kinetic DHODH enzyme assay. Values correspond to the average of three independent repeats ± SD with three technical repeats each. b X-ray co-crystal structure of (R)-HZ05 (green carbons) with DHODH (6ET4). Protein helices are colored light red and the sheets in cyan. The carbons of the co-factor FMN are shown in yellow and the carbons of the reaction product orotate in blue. c (R)-HZ05, shown with green carbons, binds in the same pocket as other inhibitors such as brequinar. In this structure, the pocket is opened up as Gln47 (purple) is moved out, allowing (R)-HZ05 to make interactions with the Arg136 (orange) through two water molecules. Other amino acid residues within 4 Å from (R)-HZ05 are shown in orange. Ala55, His56, and Ala59 are located on helix number 3; however, the entire helix number 3 has been omitted for clarity. Also for clarity, Thr360 and Pro364 located below (R)-HZ05 are not labeled. The electron density of (R)-HZ05 is shown in light gray. Crystallography studies were performed as described in Supplementary Information. d p53-dependent transcription (bars) and viability/growth (lines) in ARN8 cell cultures in response to HZ05 in the absence and presence of 100 μM uridine. Values correspond to the average of three technical repeats ± SD. e Comparison between the effects of 20 μM (R)-HZ00 and 5 μM HZ05 on RNA levels (RNASeq experiment) in ARN8 cells treated with either compound for 5 h (Supplementary Data 1). f ARN8 cells were grown in DMEM supplemented with 5% FBS and treated with the indicated compounds for 72 h in the presence of increasing levels of bovine serum albumin (BSA). Following treatment, cells were processed for an SRB assay. Values correspond to the average of three technical repeats ± SD
Fig. 6
Fig. 6
HZ05 leads to an enrichment of cancer cells in S-phase. a ARN8 cells were treated with vehicle (DMSO) or HZ05 for 12 h and analyzed using BrdU/PI flow cytometry. S* indicates cells with a DNA content between 2N and 4N that do not incorporate BrdU. b ARN8 cells treated for 72 h as indicated and then analyzed using PI flow cytometry. Numbers correspond to percentage sub-G1 cells. c ARN8 cells were treated with vehicle (DMSO), HZ05, nutlin-3a, or the combination for 72 h. Cells were analyzed by flow cytometry after staining with PI. Numbers indicate % of sub-G1 cells. d U2OS, MV411, and HNDF cells were treated with vehicle (DMSO) or HZ05 for 72 h (first three columns). In the next four columns, cells were treated for 72 h with either HZ05 or vehicle (DMSO) followed by re-addition of vehicle (DMSO) or HZ05 for an additional 48 h with or without 2 μM nutlin-3a. Cells were analyzed by flow cytometry following staining with PI. Numbers indicate % of sub-G1 cells
Fig. 7
Fig. 7
HZ05 increases p53 levels in S-phase cells. a U2OS cells were treated with DMSO (vehicle) or HZ05 (1 μM) for 72 h. The upper left panel is a representative dot plot showing the gating strategy for cells expressing high p53 levels (blue: HZ05 treated and red: DMSO treated). The upper right panel shows the percentage of cells in S-phase. The lower left panel shows the percentage of S-phase cells with p53 levels above baseline according to the gating shown in the dot plot. A representative histogram of the fluorescence intensity of FITC-p53 in S-phase cells is shown in the lower right panel. Bar graphs show the average of three independent experiments. Unpaired t-test was employed to assess statistical significance using GraphPad Prism version 7 (****p < 0.0001 and ***p < 0.001). b U2OS cells were pretreated with HZ05 for 72 h, washed with medium containing DMSO or nutlin-3a, and then provided with fresh medium containing DMSO or nutlin-3a. After an additional 48 h, Annexin V and PI staining was analyzed by flow cytometry. The average of two independent experiments ± SD is shown. c Hypothetical model describing the combination of DHODH inhibition with mdm2 antagonists. Inhibition of DHODH in tumor cells leads to an increase in the number of cells in S-phase that also possess elevated levels of p53. Inhibition of p53 degradation in the form of an mdm2 antagonist leads to death of cells in S-phase

References

    1. Corbin AS, et al. Human chronic myeloid leukemia stem cells are insensitive to imatinib despite inhibition of BCR-ABL activity. J. Clin. Invest. 2011;121:396–409. doi: 10.1172/JCI35721. - DOI - PMC - PubMed
    1. Li L, et al. Activation of p53 by SIRT1 inhibition enhances elimination of CML leukemia stem cells in combination with imatinib. Cancer Cell. 2012;21:266–281. doi: 10.1016/j.ccr.2011.12.020. - DOI - PMC - PubMed
    1. Brown CJ, Lain S, Verma CS, Fersht AR, Lane DP. Awakening guardian angels: drugging the p53 pathway. Nat. Rev. Cancer. 2009;9:862–873. doi: 10.1038/nrc2763. - DOI - PubMed
    1. Vassilev LT, et al. In vivo activation of the p53 pathway by small-molecule antagonists of MDM2. Science. 2004;303:844–848. doi: 10.1126/science.1092472. - DOI - PubMed
    1. Kranz D, Dobbelstein M. Nongenotoxic p53 activation protects cells against S-phase-specific chemotherapy. Cancer Res. 2006;66:10274–10280. doi: 10.1158/0008-5472.CAN-06-1527. - DOI - PubMed

Publication types

MeSH terms