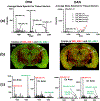
AP-MALDI Mass Spectrometry Imaging of Gangliosides Using 2,6-Dihydroxyacetophenone
- PMID: 29549666
- PMCID: PMC7549319
- DOI: 10.1007/s13361-018-1928-8
AP-MALDI Mass Spectrometry Imaging of Gangliosides Using 2,6-Dihydroxyacetophenone
Abstract
Matrix-assisted laser/desorption ionization (MALDI) mass spectrometry imaging (MSI) is widely used as a unique tool to record the distribution of a large range of biomolecules in tissues. 2,6-Dihydroxyacetophenone (DHA) matrix has been shown to provide efficient ionization of lipids, especially gangliosides. The major drawback for DHA as it applies to MS imaging is that it sublimes under vacuum (low pressure) at the extended time necessary to complete both high spatial and mass resolution MSI studies of whole organs. To overcome the problem of sublimation, we used an atmospheric pressure (AP)-MALDI source to obtain high spatial resolution images of lipids in the brain using a high mass resolution mass spectrometer. Additionally, the advantages of atmospheric pressure and DHA for imaging gangliosides are highlighted. The imaging of [M-H]- and [M-H2O-H]- mass peaks for GD1 gangliosides showed different distribution, most likely reflecting the different spatial distribution of GD1a and GD1b species in the brain. Graphical Abstract ᅟ.
Keywords: AP-MALDI; Gangliosides; Lipids; Mass spectrometry imaging; Phospholipids.
Figures


Similar articles
-
Enhanced capabilities for imaging gangliosides in murine brain with matrix-assisted laser desorption/ionization and desorption electrospray ionization mass spectrometry coupled to ion mobility separation.Methods. 2016 Jul 15;104:69-78. doi: 10.1016/j.ymeth.2016.02.014. Epub 2016 Feb 23. Methods. 2016. PMID: 26922843
-
Structural characterization of monosialo-, disialo- and trisialo-gangliosides by negative ion AP-MALDI-QIT-TOF mass spectrometry with MS(n) switching.Neurochem Res. 2012 Jun;37(6):1315-24. doi: 10.1007/s11064-012-0735-z. Epub 2012 Mar 6. Neurochem Res. 2012. PMID: 22392257
-
Evaluation of 6 MALDI-Matrices for 10 μm Lipid Imaging and On-Tissue MSn with AP-MALDI-Orbitrap.J Am Soc Mass Spectrom. 2022 May 4;33(5):760-771. doi: 10.1021/jasms.1c00327. Epub 2022 Mar 31. J Am Soc Mass Spectrom. 2022. PMID: 35358390 Free PMC article.
-
Surface analysis of lipids by mass spectrometry: more than just imaging.Prog Lipid Res. 2013 Oct;52(4):329-53. doi: 10.1016/j.plipres.2013.04.005. Epub 2013 Apr 24. Prog Lipid Res. 2013. PMID: 23623802 Review.
-
Spatial neurolipidomics-MALDI mass spectrometry imaging of lipids in brain pathologies.J Mass Spectrom. 2024 Mar;59(3):e5008. doi: 10.1002/jms.5008. J Mass Spectrom. 2024. PMID: 38445816 Free PMC article. Review.
Cited by
-
Advances in MALDI Mass Spectrometry Imaging Single Cell and Tissues.Front Chem. 2022 Feb 3;9:782432. doi: 10.3389/fchem.2021.782432. eCollection 2021. Front Chem. 2022. PMID: 35186891 Free PMC article. Review.
-
Polyamine Metabolism in Optic Nerve: Spatial Metabolomics with AP/MALDI Mass Spectrometry Imaging.Methods Mol Biol. 2025;2925:161-172. doi: 10.1007/978-1-0716-4534-5_11. Methods Mol Biol. 2025. PMID: 40498188
-
Lipid rafts and neurodegeneration: structural and functional roles in physiologic aging and neurodegenerative diseases.J Lipid Res. 2020 May;61(5):636-654. doi: 10.1194/jlr.TR119000427. Epub 2019 Dec 23. J Lipid Res. 2020. PMID: 31871065 Free PMC article. Review.
-
Characterizing and alleviating ion suppression effects in atmospheric pressure matrix-assisted laser desorption/ionization.Rapid Commun Mass Spectrom. 2019 Feb 28;33(4):327-335. doi: 10.1002/rcm.8358. Rapid Commun Mass Spectrom. 2019. PMID: 30430670 Free PMC article.
-
A Rapid Screening Method for the Detection of Additives in Electronics and Plastic Consumer Products Using AP-MALDI-qTOF-MS.Toxics. 2023 Jan 23;11(2):108. doi: 10.3390/toxics11020108. Toxics. 2023. PMID: 36850984 Free PMC article.
References
-
- Cornett DS, Reyzer ML, Chaurand P, Caprioli RM: MALDI imaging mass spectrometry: molecular snapshots of biochemical systems. Nat. Methods 4, 828–833 (2007) - PubMed
-
- Amstalden van Hove ER, Smith DF, Heeren RMA: A concise review of mass spectrometry imaging. J. Chromatogr. A 1217, 3946–3954 (2010) - PubMed
-
- Fernández JA, Ochoa B, Fresnedo O, Giralt MT, Rodriguez-Puertas R: Matrix-assisted laser desorption ionization imaging mass spectrometry in lipidomics. Anal. Bioanal. Chem 401, 29–51 (2011) - PubMed
-
- Goto-Inoue N, Hayasaka T, Zaima N, Setou M: Imaging mass spectrometry for lipidomics. Biochim. Biophys. Acta 1811, 961–969 (2011) - PubMed
Grants and funding
LinkOut - more resources
Full Text Sources
Other Literature Sources

