. 2018 May 2;26(5):1327-1342.
doi: 10.1016/j.ymthe.2018.02.014. Epub 2018 Feb 21.

Long-Term Correction of Diabetes in Mice by In Vivo Reprogramming of Pancreatic Ducts

Affiliations

Long-Term Correction of Diabetes in Mice by In Vivo Reprogramming of Pancreatic Ducts

Yuhan Wang et al. Mol Ther. .

Abstract

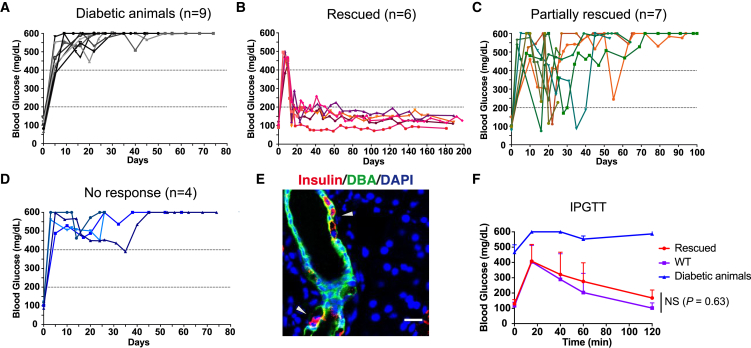
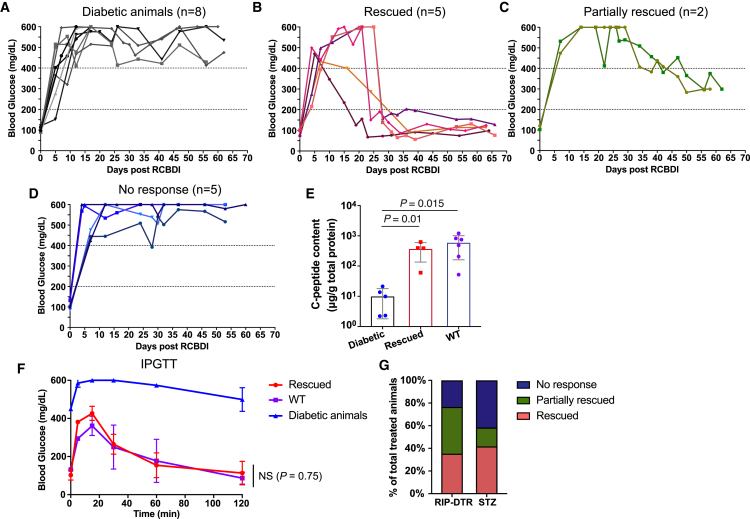
Direct lineage reprogramming can convert readily available cells in the body into desired cell types for cell replacement therapy. This is usually achieved through forced activation or repression of lineage-defining factors or pathways. In particular, reprogramming toward the pancreatic β cell fate has been of great interest in the search for new diabetes therapies. It has been suggested that cells from various endodermal lineages can be converted to β-like cells. However, it is unclear how closely induced cells resemble endogenous pancreatic β cells and whether different cell types have the same reprogramming potential. Here, we report in vivo reprogramming of pancreatic ductal cells through intra-ductal delivery of an adenoviral vector expressing the transcription factors Pdx1, Neurog3, and Mafa. Induced β-like cells are mono-hormonal, express genes essential for β cell function, and correct hyperglycemia in both chemically and genetically induced diabetes models. Compared with intrahepatic ducts and hepatocytes treated with the same vector, pancreatic ducts demonstrated more rapid activation of β cell transcripts and repression of donor cell markers. This approach could be readily adapted to humans through a commonly performed procedure, endoscopic retrograde cholangiopancreatography (ERCP), and provides potential for cell replacement therapy in type 1 diabetes patients.

Keywords: Mafa; Neurog3; Pdx1; diabetes; gene therapy; insulin; liver; pancreas; reprogramming; β cell.


Figures

None
Graphical abstract
Figure 1
Figure 1
Insulin Expression in Reprogrammed Hepatocytes Is Not Stable (A) Lineage tracing experiment to identify the origin of insulin+ cells in the liver using the Fah−/− liver chimera model. MIP-GFP hepatocytes were transplanted into Fah−/− recipients. After complete repopulation, liver chimeric animals were treated with AdPNM. Because only hepatocytes were MIP-GFP derived in this model, GFP expression in insulin+ liver cells infer hepatocyte origin. (B) Representative fluorescence images showing that the majority of induced insulin+ cells (shown in red) in the liver are of the hepatocyte lineage (GFP+, shown in green) at both 2 weeks (left) and 8 weeks (right). Scale bars: 50 μm. (C) Quantification of total and lineage marked (GFP+) insulin+ cells in (B) at 2 and 8 weeks. n = 3 animals at each time point. (D) Relative transgenes (Pdx1, Neurog3, and Mafa) expression at 2 (n = 7 animals) and 8 weeks (n = 5 animals). (E) Normalized adenoviral vector genome copy number per cell at 2 and 8 weeks. n = 4 animals at each time point. Data indicate means ± SEM.
Figure 2
Figure 2
Temporal Control of Reprogramming Factor Expression in the Liver (A) Schematic of the AdPNM (top) and the AdloxP-PNM constructs (bottom). (B) Quantification of induced insulin+ cells in the liver treated with AdloxP-PNM or AdPNM. (C) Timeline of the Cre-loxP-induced knockdown of reprogramming factors. AdloxP-PNM was delivered first on day 0 to induce transgenes and insulin expression in the liver. AdCre was then injected intravenously on day 3, 10, or 20. Tissue was harvested on day 50 for analysis. (D and E) Transgenes (Pdx1, Neurog3 and Mafa) (D) and insulin (Ins2) (E) expression in the liver with or without PNM knockdown on days 3, 10, and 20 by qRT-PCR. Data indicate means ± SEM.
Figure 3
Figure 3
Induced Insulin Expression in the Liver and Pancreas after Retrograde Common Bile Duct Injection (A) Schematic of the retrograde common bile duct injection procedure. (B) Representative immunofluorescence images of the liver (top panel) and the pancreas (bottom panel) after retrograde common bile duct injection of AdPNM. Induced insulin+ cells (shown in red) had a duct-like morphology. Expression of EpCAM (left), Nkx6.1 (middle), and Sox9 (right) are shown in green. Scale bars: 20 μm. (C) Quantification of Nkx6.1+ (left) and Sox9+ (right) cells within the induced insulin+ population in the liver (shown in green) and the pancreas (shown in yellow) after intra-ductal injection. (D) Insulin expression among pancreatic islets (islets), FACS-sorted DBA+/insulin+ pancreatic ducts (PanGFP+) and FACS-sorted insulin+ intrahepatic ducts (liverGFP+) by qRT-PCR. (E) Gene expression analysis of key β cell genes among these three cell populations (as described in D) by qRT-PCR. Data are shown as log2(ΔCt) in (D) and (E). Data indicate means ± SEM.
Figure 4
Figure 4
Induced Insulin+ Pancreatic Ductal Cells Are Mono-hormonal (A) Representative immunofluorescence images showing co-staining of induced insulin+ pancreatic ducts (red) with C-peptide (top), glucagon (Gcg) (middle), or somatostatin (Sst) (bottom) within the pancreas. Induced pancreatic ductal cells were highlighted by arrowheads. Gcg and Sst staining in islets were shown as insets. Induced insulin+ cells have a distinct morphology compared with islets and exclusively express insulin. Scale bars: 20 μm. (B) Schematic showing retrograde ductal injection into the pancreatic ducts. Clamps were placed to prevent virus from going into the liver, gallbladder, and duodenum. (C) Representative image showing induced insulin+ pancreatic ducts (shown in red) closely adjacent to blood vessels, indicated by immunofluorescence staining with the endothelial cell marker, CD31 (shown in green), at 3 weeks after intra-ductal injection. Scale bar: 20 μm.
Figure 5
Figure 5
Retrograde Common Bile Duct Injection of AdPNM in RIP-DTR Diabetic Animals (A–D) NSG RIP-DTR animals were rendered hyperglycemic within 7 days of DT treatment. Animals stayed hyperglycemic without treatment (A). Upon AdPNM treatment, 6/17 animals showed a rapid and persistent reversion of blood glucose levels (B), 7/17 animals showed transient responses (C), and 4/17 animals failed to respond to treatment (D). (E) Representative image showing induced insulin+ pancreatic ducts in a rescued RIP-DTR diabetic animal. Insulin+ pancreatic ducts were highlighted by arrowheads. Scale bar: 20 μm. (F) Glucose tolerance test in rescued RIP-DTR animals (rescued, n = 5) compared with wild-type (WT, n = 5) and untreated diabetic animals (diabetic animals, n = 2). Data indicate means ± SEM.
Figure 6
Figure 6
Retrograde Common Bile Duct Delivery of AdPNM in STZ-Induced Diabetic Animals (A–D) Blood glucose levels of STZ-induced diabetic animal models: untreated animals remained hyperglycemic throughout the experiment (A), 5/12 animals showed a rapid and persistent reversion of blood glucose levels after AdPNM treatment (B), 7/12 animals showed transient response (C), or failed to respond to treatment (D). (E) C-peptide content within the pancreas of STZ-induced diabetic animals (diabetic, n = 5), rescued animals (rescued, n = 4) and wild-type animals (WT, n = 6) measured by C-peptide ELISA. (F) Glucose tolerance test of rescued animals (rescued, n = 3; shown in B) compared with wild-type (WT, n = 3) and untreated diabetic animals (diabetic animals, n = 2). Data indicate means ± SEM. (G) Summary of blood glucose responses from both animal models.
Figure 7
Figure 7
The Majority of Induced Insulin+ Cells Are Derived from Pancreatic Ducts (A) Schematic of the Sox9 reporter animal model. Sox9-CreER2 mice were bred with ROSA-mT/mG mice, which allowed the lineage tracing of Sox9-expressing cells in the pancreas upon tamoxifen induction. (B) Experimental design of the lineage tracing experiment. Animals were first treated with tamoxifen to mark the Sox9+ cells. After a 2-week washout of tamoxifen, animals were treated with AdPNM through intra-ductal injection. Tissue was harvested 2 weeks later to determine whether induced insulin+ cells were Sox9 labeled. (C) Representative images showing that many induced insulin+ cells (shown in red) were Sox9-CreERT2 marked (mGFP+). Scale bars: 20 μm. (D) Sox9 antibody staining of induced insulin+ cells showing that the Sox9-CreERT2 marked (mGFP+) insulin+ cells no longer express Sox9 (arrowheads). Scale bars: 50 μm.
Figure 8
Figure 8
Single-Cell RNA Sequencing Analysis of Induced Insulin+ Cells (A) t-SNE projection of 444 GFP+ cells colored by clustering (cluster 1, shown in green, and cluster 2, shown in yellow). (B–G) Expression of eGFP and adenoviral vector transcript (Adeno-seq) (B), reprogramming factor Pdx1 (C), insulin (Ins1 and Ins2) (D), β cell markers (E and F), and pancreatic ductal markers (G) in isolated GFP+ cells. Gene expression heatmaps are overlaid on t-SNE plots of GFP+ cells. (H) Heatmap of representative upregulated genes in insulin+ pancreatic ductal cells, presented as relative expression. Each column represents gene expression from an individual cell; cells are ordered based on their expression of adenoviral vector transcript (Adeno-seq).

Comment in

Similar articles

Cited by

References

    1. Centers for Disease Control and Prevention . Centers for Disease Control and Prevention, US Department of Health and Human Services; 2017. National Diabetes Statistics Report, 2017.
    1. Bolli G.B. Insulin treatment in type 1 diabetes. Endocr. Pract. 2006;12(Suppl 1):105–109. - PubMed
    1. Shapiro A.M., Pokrywczynska M., Ricordi C. Clinical pancreatic islet transplantation. Nat. Rev. Endocrinol. 2017;13:268–277. - PubMed
    1. Srinivasan P., Huang G.C., Amiel S.A., Heaton N.D. Islet cell transplantation. Postgrad. Med. J. 2007;83:224–229. - PMC - PubMed
    1. Zhou Q., Brown J., Kanarek A., Rajagopal J., Melton D.A. In vivo reprogramming of adult pancreatic exocrine cells to beta-cells. Nature. 2008;455:627–632. - PMC - PubMed

Publication types

MeSH terms