. 2018 Oct;32(10):2167-2177.
doi: 10.1038/s41375-018-0071-7. Epub 2018 Feb 22.

Successes and challenges in the treatment of pediatric acute myeloid leukemia: a retrospective analysis of the AML-BFM trials from 1987 to 2012

Affiliations

Successes and challenges in the treatment of pediatric acute myeloid leukemia: a retrospective analysis of the AML-BFM trials from 1987 to 2012

Mareike Rasche et al. Leukemia. 2018 Oct.

Abstract

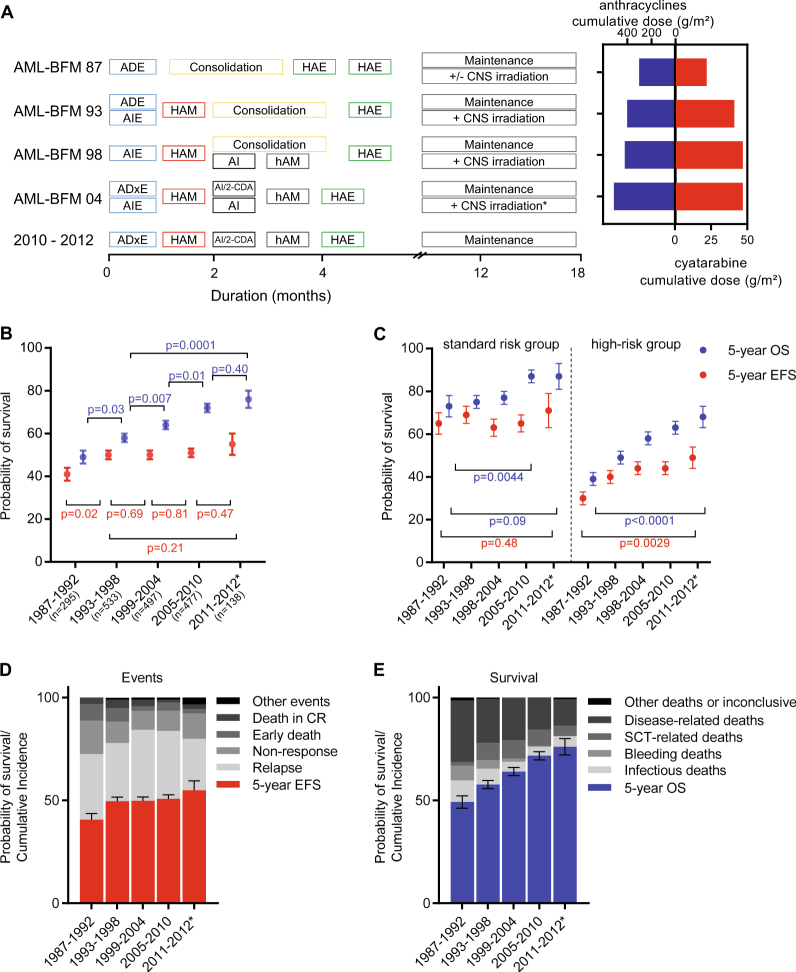
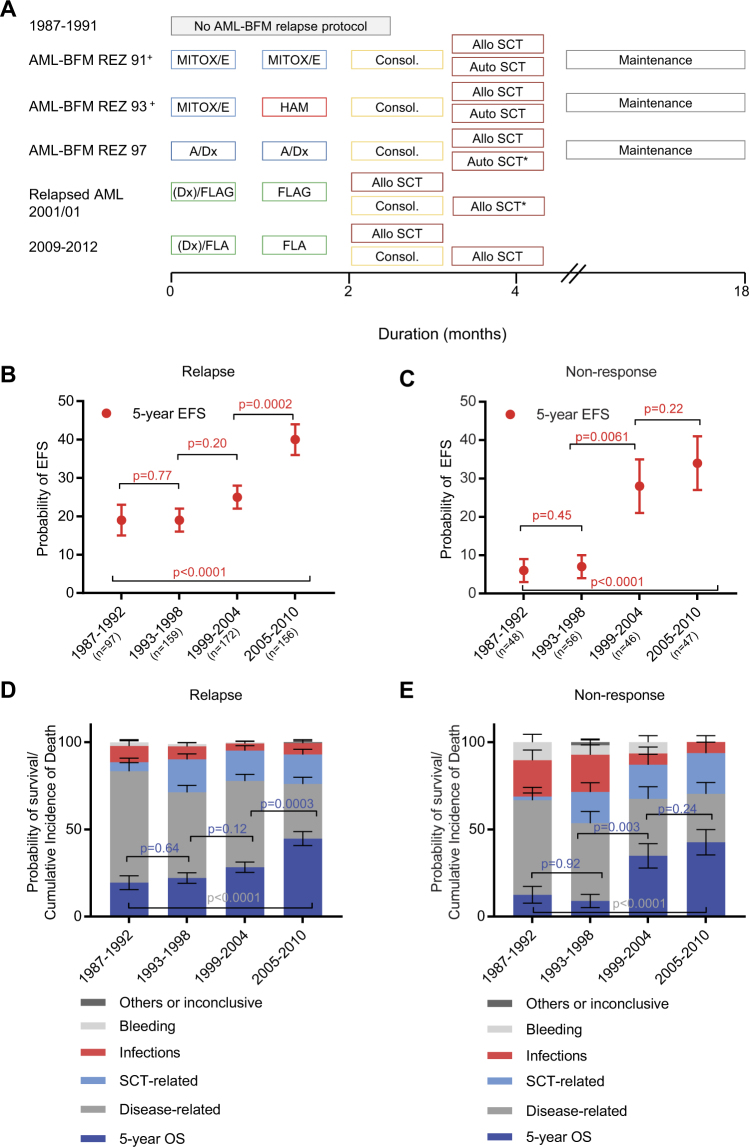
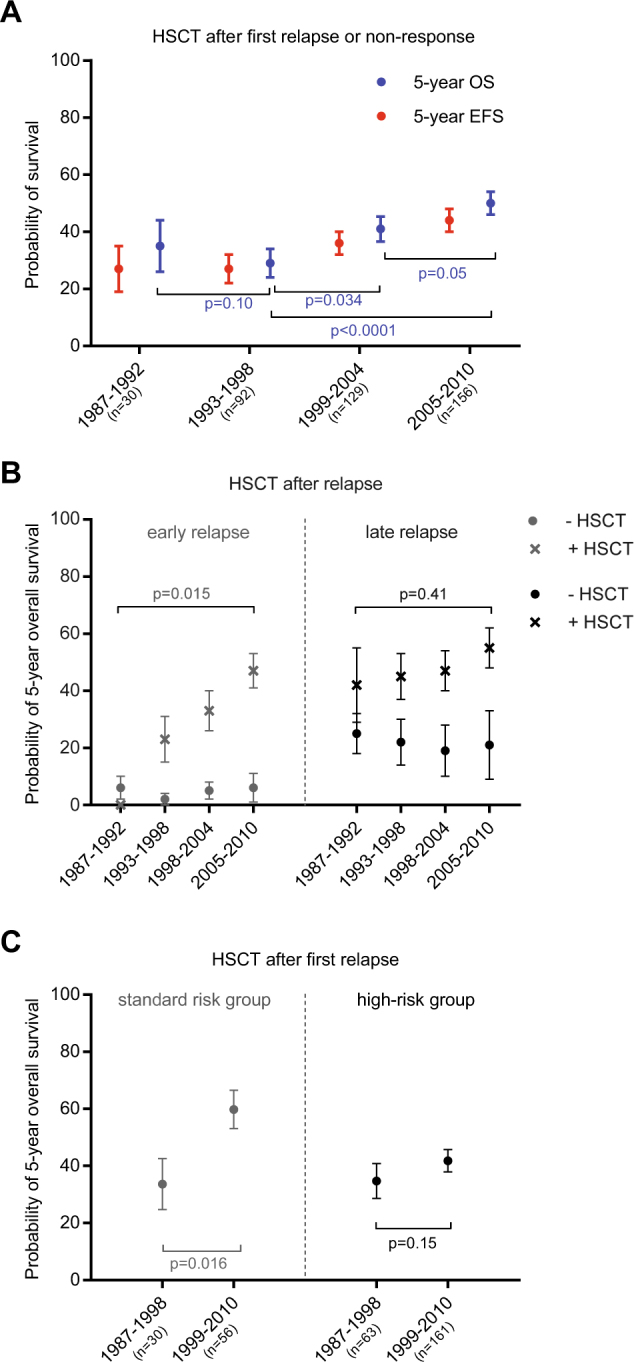
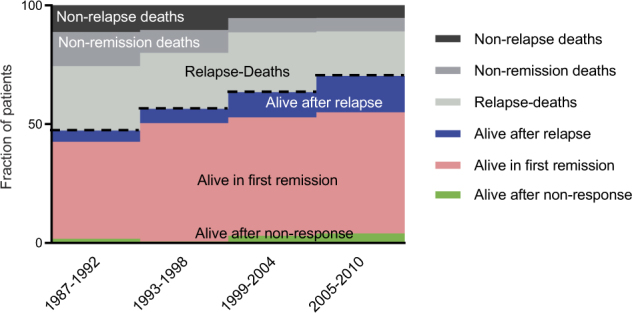
Overall survival (OS) of pediatric patients with acute myeloid leukemia (AML) increased in recent decades. However, it remained unknown whether advances in first-line treatment, supportive care, or second-line therapy mainly contributed to this improvement. Here, we retrospectively analyzed outcome and clinical data of 1940 pediatric AML patients (younger than 18 years of age), enrolled in the population-based AML-BFM trials between 1987 and 2012. While 5-year probability of OS (pOS) increased from 49 ± 3% (1987-1992) to 76 ± 4% (2010-2012; p < 0.0001), probability of event-free survival only improved from 41 ± 3% (1987-1992) to 50 ± 2% (1993-1998; p = 0.02) after introduction of high-dose cytarabine/mitoxantrone, but remained stable since then. Non-response and relapse rates stayed constant despite intensified first-line therapy (p = 0.08 and p = 0.17). Reduced fatal bleedings and leukostasis translated into fewer early deaths (8.1%vs. 2.2%; p = 0.001). Strikingly, pOS after non-response (13 ± 5% (1987-1992) vs. 43 ± 7% (2005-2010); p < 0.0001) or relapse (19 ± 4% vs. 45 ± 4%; p < 0.0001) improved. After 1999, more relapsed or refractory patients underwent hematopoietic stem cell transplantation (HSCT) with increased pOS after HSCT (29 ± 5% (1993-1998) vs. 50 ± 4% (2005-2010); p < 0.0001). Since efficacy of salvage therapy mainly contributed to better outcome in pediatric AML, our analysis indicates that a better allocation of patients, who cannot be cured with conventional chemotherapy, to an early "salvage-like" therapy is necessary.


Conflict of interest statement

J.-P.B. has consulting or advisory roles for Amgen and Roche. T.K. has consulting or advisory roles for Loxo and Novartis. T.L. receives honoraria from Gilead, Merk Sharp & Dome, Astella, Basilea, and has consulting or advisory roles and participates in speakers’ bureaus, including travel accommodation and other expenses from Gilead, Merk Sharp & Dome, Astella. T.L. receives research funding from Gilead. D.R. has consulting or advisory roles for Roche, Celgene, Hexal, Pfizer, Novartis, Boehringer and receives research funding from Celgene. D.R. received travel, accommodation or other expenses from Jazz Pharmaceuticals and Griffols. The remaining authors declare that they have no conflict of interest.

Figures

Fig. 1
Fig. 1
Development of overall and event-free survival from 1987–2012. a Protocol flow chart for pediatric patients with AML in AML-BFM trials from 87 until 2012. Consolidation: 6-week therapy consisting of seven different drugs: 6-thioguanine (60 mg/m2 per day, days 1–43 orally); prednisone (40 mg/m2 per day, days 1–28 orally); vincristine (1.5 mg/m2 per day, days 1, 8, 15, 22); cytarabine (75 mg/m2 per day, days 3–6, 10–13, 17–20, 24–27, 31–34, 38–41); doxorubicin (30 mg/m2 per day (AML-BFM 87 and 93)) or idarubicin (7 mg/m2 per day [AML-BFM 98], days 1, 8, 15, 22); intrathecal (age-dependent dose) cytarabine (days 1, 15, 29, 43); cyclophosphamide (500 mg/m2 per day, days 29, 43). *CNS irradiation was stopped in May 2009. Cumulative dosages of anthracycline (mg/m2) and cytarabine (g/m2) in AML-BFM trials are shown as maximal dosage given in each study. Cumulative doses were calculated as equivalent doses to daunorubicin using a ratio of 1:5 for idarubicin and mitoxantrone. ADE cytarabine (100  mg/m2), daunorubicin (60  mg/m2), etoposide (150  mg/m2), AIE cytarabine (100  mg/m2), idarubicin (12  mg/m2), etoposide (150  mg/m2), HAM high-dose cytarabine (3  g/m2), mitoxantrone (10  mg/m2), AI cytarabine (500  mg/m2), idarubicin (7  mg/m2), hAM intermediate-dose cytarabine (1  g/m2), mitoxantrone (10  mg/m2), HAE high-dose cytarabine (3  g/m2), etoposide (125  mg/m2), ADxE cytarabine (100  mg/m2), liposomal daunorubicin (80 mg/m2), etoposide (150  mg/m2), 2-CDA 2-chloro-2-deoxyadenosine (6  mg/m2), CNS central nervous system. b Development of survival per 6-year periods. Data shown as probability of EFS and OS ± SE. Kaplan–Meier curves of EFS and OS of distinct subgroups were compared using the log-rank test, shown as p value. c Development of survival per 6-year periods in patients with standard risk group [FAB M1/2 with Auer rods, FAB M4 with atypical eosinophils (M4Eo) and/or favorable cytogenetics, such as t(8;21) and/or AML1-ETO and inv(16) or t(16;16) and/or CBFB/MYH1, if there was no persistence of BM blasts (≥5%) on day 15, respectively), compared to all other patients (high-risk group). Data shown as probability of EFS and OS ± SE. Kaplan–Meier curves of EFS and OS of distinct subgroups were compared using the log-rank test, shown as p value. Standard risk: n = 88 (1987–1992); n = 174 (1993–1998); n = 151 (1999–2004); n = 148 (2005–2010); n = 39 (2011–2012). High-risk: n = 207 (1987–1992); n = 359 (1993–1998); n = 346 (1999–2004); n = 329 (2005–2010); n = 98 (2011–2012). d Overview of events (early death, death in CR, non-response, relapse, others) per 6-year periods. Data shown as probability of EFS ± SE and cumulative incidences of events. e Overview of survival and causes of deaths (caused by bleeding, infections or HSCT-related, disease-related deaths or others). Bleeding and infections have been evaluated in patients during initial disease and salvage treatment. Data shown as probability of OS ± SE and cumulative incidences of deaths. *Shorter interval for sufficient follow-up. n = 295 (1987–1992); n = 533 (1993–1998); n = 497 (1999–2004); n = 477 (2005–2010); n = 138 (2011–2012)
Fig. 2
Fig. 2
First-line therapy. a Causes of early death from 1987–2012. Data shown as cumulative incidences of deaths ± SE. Gray’s method was used to compare cumulative incidences, shown as p value. Death due to other reasons or inconclusive causes of deaths includes three patients who have been delayed in diagnosis and did not receive treatment in time. n = 295 (1987–1992); n = 533 (1993–1998); n = 497 (1999–2004); n = 477 (2005–2010). b Causes of death during CR from 1987–2012. Data shown as cumulative incidences of deaths ± SE. Gray’s method was used to compare cumulative incidences. n = 295 (1987–1992); n = 533 (1993–1998); n = 497 (1999–2004); n = 477 (2005–2010). c Development of survival after allogeneic HSCT in first CR from 1987–2010. Analysis of survival (pOS and pEFS ± SE) after HSCT in 6-year periods (1987–1992: n = 18; 1993–1998: n = 52; 1999–2004: n = 69; 2005–2010: n = 43). Kaplan–Meier curves of EFS and OS of distinct subgroups were compared using the log-rank test, shown as p value. d Development of survival of all patients without allogeneic HSCT in first CR from 1987–2010. Analysis of survival (pOS and pEFS ± SE) in 6-year periods (1987–1992: n = 277; 1993–1998: n = 481; 1999–2004: n = 428; 2005–2010: n = 434). Kaplan–Meier curves of EFS and OS of distinct subgroups were compared using the log-rank test, shown as p value
Fig. 3
Fig. 3
Non-response and relapse. a Protocol flow chart of trials AML-BFM REZ 91, AML-BFM REZ 93, AML-BFM REZ 97, and Relapsed AML 2001/01. HAM high-dose cytarabine, mitoxantrone, SCT stem cell transplantation, MITOX mitoxantrone, E etoposid, A cytarabine (intermediate dose), Dx liposomal daunorubicine, FLAG fludarabine, cytarabine, G-CSF, Consol. consolidation consisting of thioguanine and low-dose cytarabine for 6 weeks. +Low patient recruitment due to alternative regimens, no treatment or palliative care. *Autologous SCT if no suitable matched allogeneic donor available in late relapses. Analysis of pEFS ± SE after relapse (b) and their cumulative incidences of deaths ± SE and pOS ± SE from 1987–2010 (d). n = 97 (1987–1992); n = 159 (1993–1998); n = 172 (1999–2004); n = 156 (2005–2010). Analysis of pEFS ± SE after non-response (c) and their cumulative incidences of deaths ± SE and pOS ± SE (e). n = 48 (1987–1992); n = 56 (1993–1998); n = 46 (1999–2004); n = 47 (2005–2010). Causes of deaths are evaluated for bleeding, infections, SCT-related, disease-related, or others. be Kaplan–Meier curves of EFS and OS of distinct subgroups were compared using the log-rank test, shown as p value. BFM Berlin Frankfurt Münster, CNS central nervous system
Fig. 4
Fig. 4
Allogeneic HSCT after relapse or non-response. Development of survival after HSCT from 1987–2010. a Analysis of pOS and pEFS ± SE after allogeneic HSCT in 6-year periods in patients with relapse or non-response. (1987–1992: n = 30; 1993–1998: n = 92; 1999–2004: n = 129; 2005–2010: n = 156). b Analysis of 5-year pOS ± SE in patients with early (<1 year of date of diagnosis) or late relapse (>1 year of date of diagnosis) with (+) and without (−) allogeneic HSCT. Early relapse with HSCT n = 5 (1987–1992); n = 31 (1993–1998); n = 46 (1999–2004); n = 63 (2005–2010), early relapse without HSCT n = 35 (1987–1992); n = 52 (1993–1998); n = 43 (1999–2004); n = 18 (2005–2010). Late relapse with HSCT n = 16 (1987–1992); n = 41 (1993–1998); n = 55 (1999–2004); n = 53 (2005–2010), late relapse without HSCT n = 40 (1987–1992); n = 28 (1993–1998); n = 20 (1999–2004); n = 20 (2005–2010). c Analysis of 5-year pOS ± SE after allogeneic HSCT in relapsed AML of standard risk or high-risk AML. Data shown in two time periods ((1987–1998) and (1999–2010)). Standard risk group indicates FAB M1/2 with Auer rods, FAB M4 with atypical eosinophils (M4Eo) and/or favorable cytogenetics, such as t(8;21) and/or AML1-ETO and inv(16) or t(16;16) and/or CBFB/MYH1, if there was no persistence of BM blasts (≥5%) on day. All others were classified as high-risk group. ac EFS and OS curves of distinct subgroups were compared using the log-rank test, shown as p value
Fig. 5
Fig. 5
Pediatric AML from 1987–2010. Fractions of pediatric patients are classified regarding their status quo (alive in relapse, alive in first CR, alive after non-response, death after relapse or non-response and other deaths such as early death or death in CR) from 1987–2010. n = 295 (1987–1992); n = 533 (1993–1998); n = 497 (1999–2004); n = 477 (2005–2010)

References

    1. Abrahamsson J, Forestier E, Heldrup J, Jahnukainen K, Jonsson OG, Lausen B, et al. Response-guided induction therapy in pediatric acute myeloid leukemia with excellent remission rate. J Clin Oncol. 2011;29:310–5. doi: 10.1200/JCO.2010.30.6829. - DOI - PubMed
    1. Creutzig U, Zimmermann M, Bourquin JP, Dworzak MN, Fleischhack G, Graf N, et al. Randomized trial comparing liposomal daunorubicin with idarubicin as induction for pediatric acute myeloid leukemia: results from Study AML-BFM 2004. Blood. 2013;122:37–43. doi: 10.1182/blood-2013-02-484097. - DOI - PubMed
    1. Gibson BE, Wheatley K, Hann IM, Stevens RF, Webb D, Hills RK, et al. Treatment strategy and long-term results in paediatric patients treated in consecutive UK AML trials. Leukemia. 2005;19:2130–8. doi: 10.1038/sj.leu.2403924. - DOI - PubMed
    1. Pession A, Masetti R, Rizzari C, Putti MC, Casale F, Fagioli F, et al. Results of the AIEOP AML 2002/01 multicenter prospective trial for the treatment of children with acute myeloid leukemia. Blood. 2013;122:170–8. doi: 10.1182/blood-2013-03-491621. - DOI - PubMed
    1. Rubnitz JE, Inaba H, Dahl G, Ribeiro RC, Bowman WP, Taub J, et al. Minimal residual disease-directed therapy for childhood acute myeloid leukaemia: results of the AML02 multicentre trial. Lancet Oncol. 2010;11:543–52. doi: 10.1016/S1470-2045(10)70090-5. - DOI - PMC - PubMed

Publication types