. 2018 Apr 5;173(2):470-484.e18.
doi: 10.1016/j.cell.2018.02.048. Epub 2018 Mar 15.

B-Cell-Specific Diversion of Glucose Carbon Utilization Reveals a Unique Vulnerability in B Cell Malignancies

Affiliations

B-Cell-Specific Diversion of Glucose Carbon Utilization Reveals a Unique Vulnerability in B Cell Malignancies

Gang Xiao et al. Cell. .

Abstract

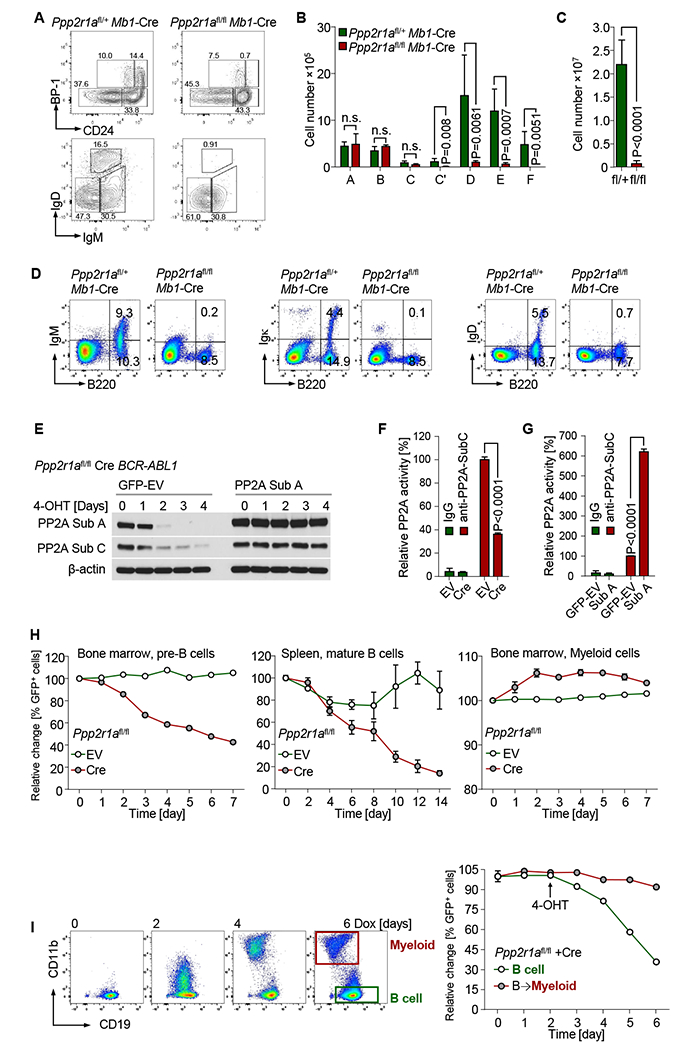
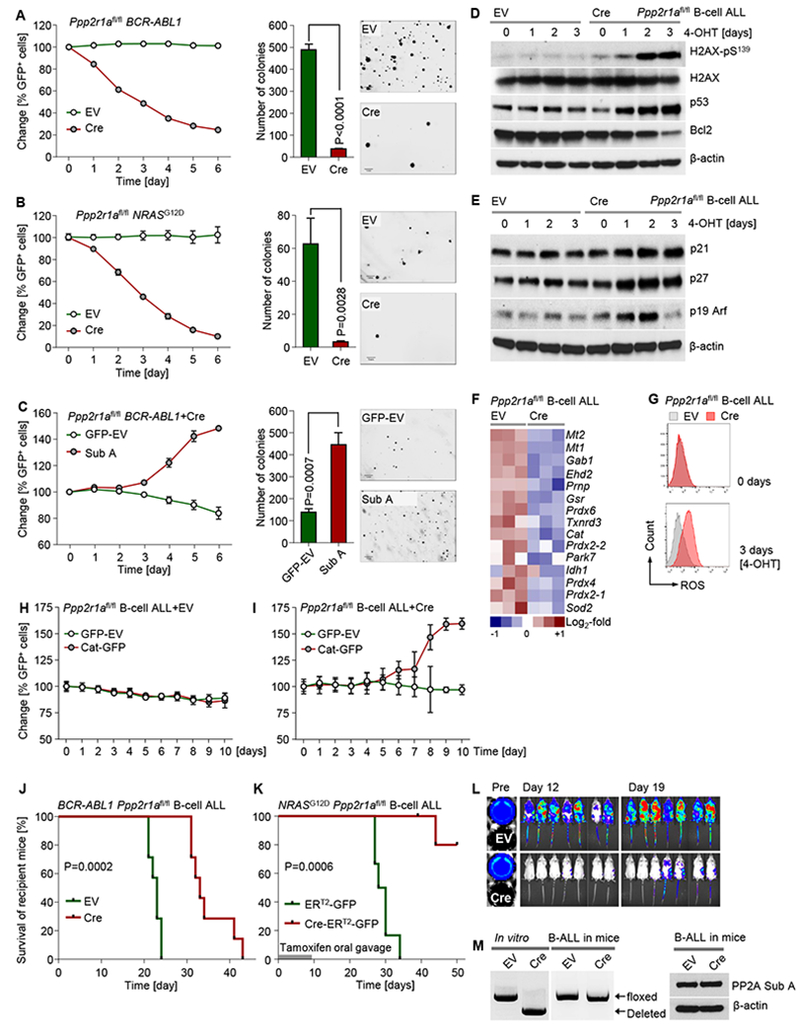
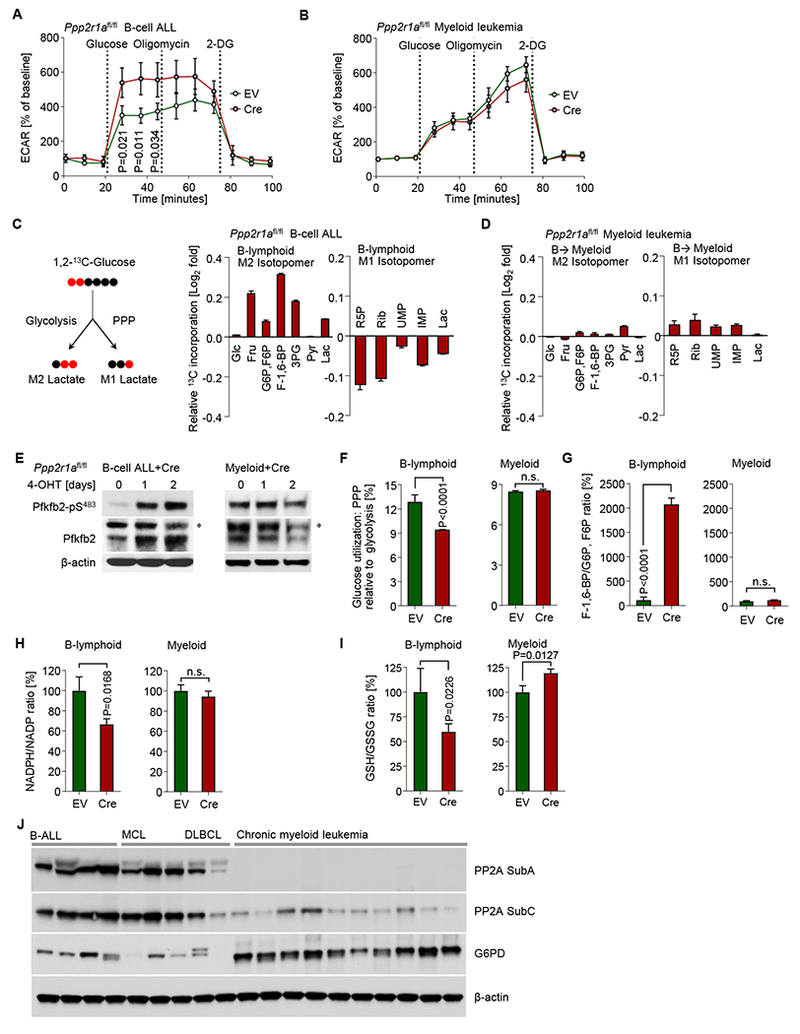
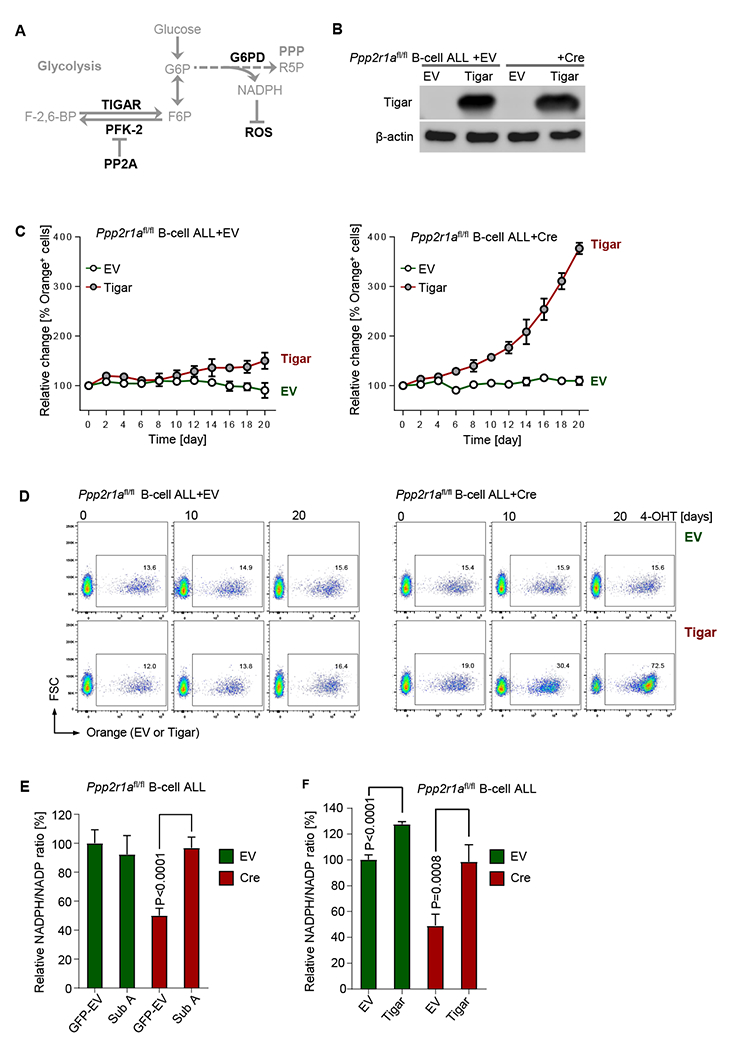
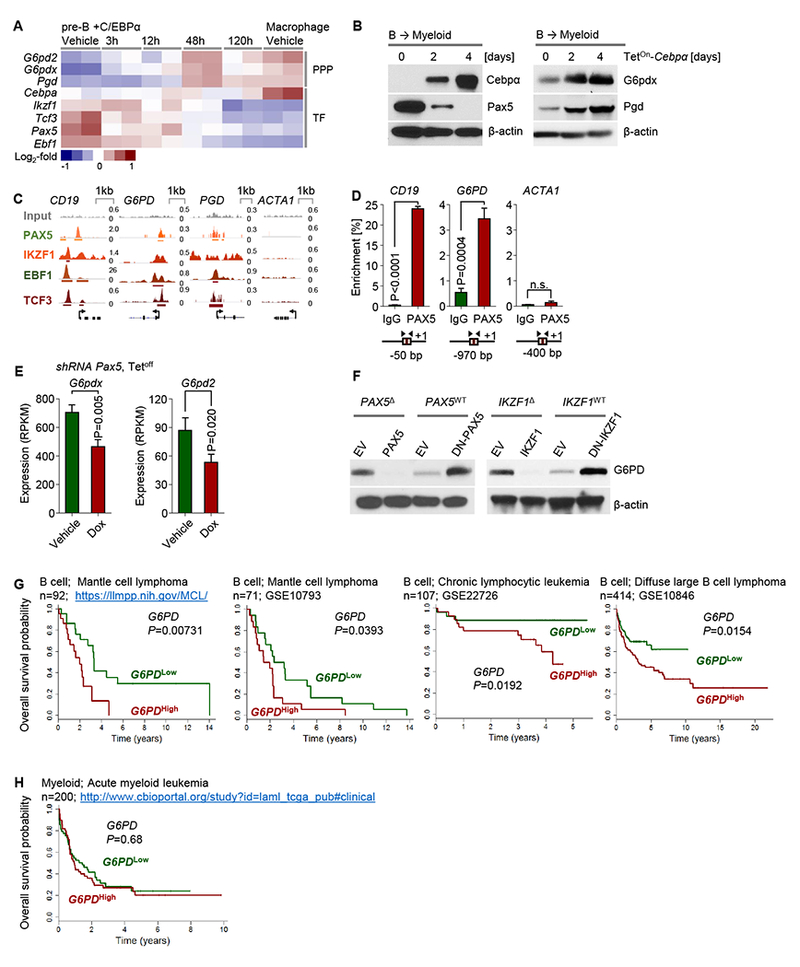
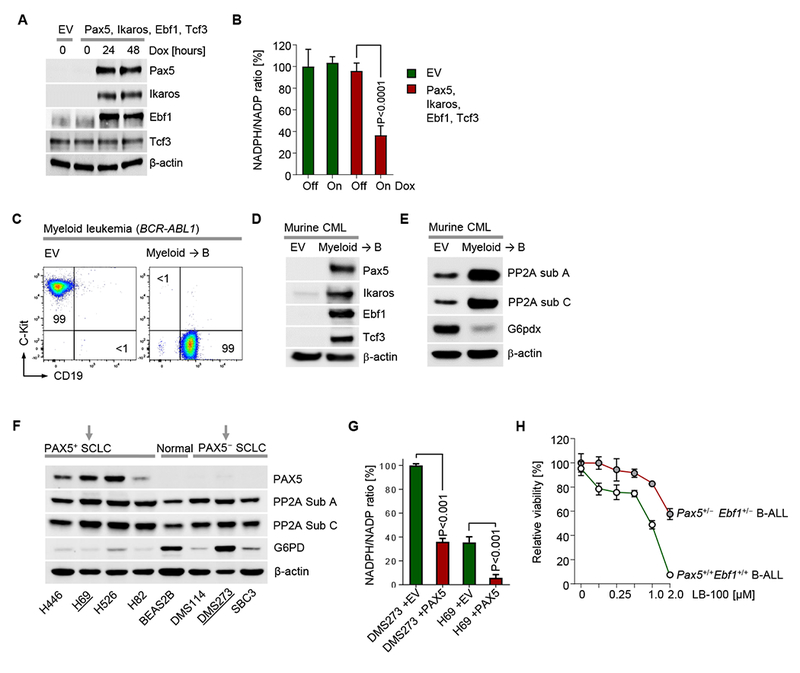
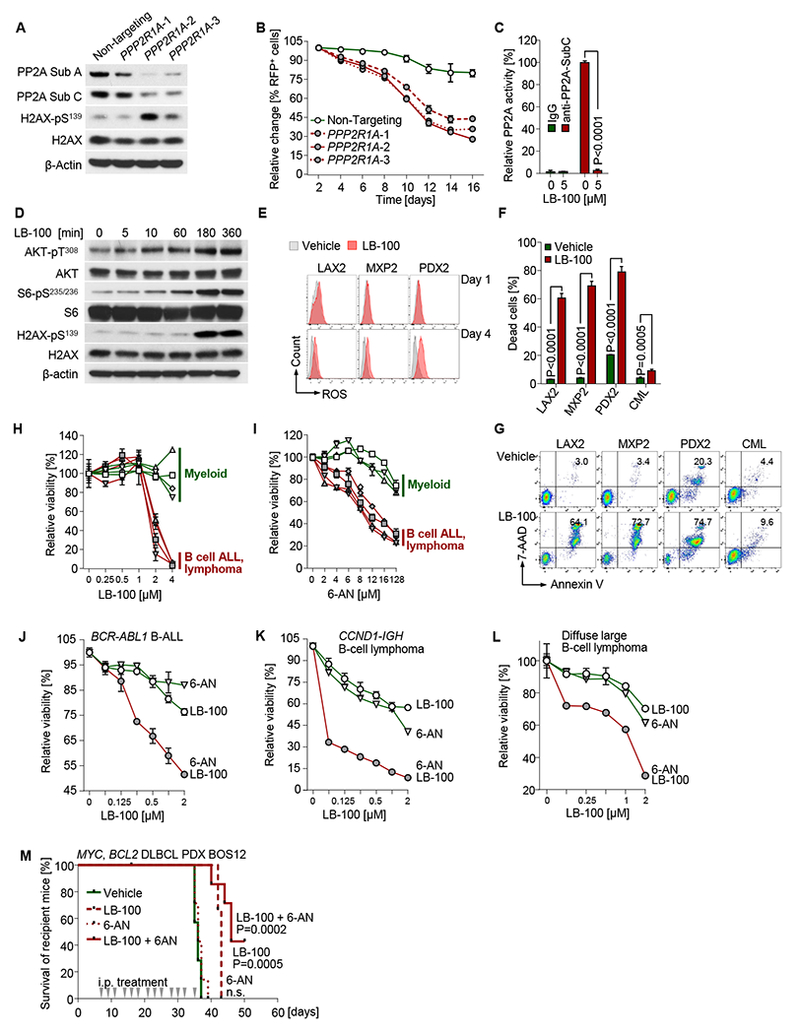
B cell activation during normal immune responses and oncogenic transformation impose increased metabolic demands on B cells and their ability to retain redox homeostasis. While the serine/threonine-protein phosphatase 2A (PP2A) was identified as a tumor suppressor in multiple types of cancer, our genetic studies revealed an essential role of PP2A in B cell tumors. Thereby, PP2A redirects glucose carbon utilization from glycolysis to the pentose phosphate pathway (PPP) to salvage oxidative stress. This unique vulnerability reflects constitutively low PPP activity in B cells and transcriptional repression of G6PD and other key PPP enzymes by the B cell transcription factors PAX5 and IKZF1. Reflecting B-cell-specific transcriptional PPP-repression, glucose carbon utilization in B cells is heavily skewed in favor of glycolysis resulting in lack of PPP-dependent antioxidant protection. These findings reveal a gatekeeper function of the PPP in a broad range of B cell malignancies that can be efficiently targeted by small molecule inhibition of PP2A and G6PD.

Keywords: B cell malignancies; G6PD; PP2A; glucose metabolism; lineage-specific vulnerability; redox homeostasis; transcriptional repression.


Conflict of interest statement

DECLARATION OF INTERESTS

All authors declare no competing interests.

Figures

Figure 1:
Figure 1:. PP2A function is essential for B cell survival.
(A) B cell development in Ppp2r1afl/fl Mb 1-Cre mice was examined by flow cytometry. Hardy fractions of B cell subsets isolated from bone marrow were analyzed. Absolute cell numbers were calculated for B cell subsets from bone marrow (B) and spleen (C). Surface staining of BCR components was performed by flow cytometry (D). Ppp2r1afl/fl BCR-ABL1 ALL cells were transduced with 4-hydroxy-tamoxifen (4-OHT)-inducible Cre-ERT2 (Cre) or ERT2-vector (EV). Cells were subsequently transduced with PP2A-subA-IRES-GFP (PP2A Sub A) or GFP-Vector (GFP-EV). (E) PP2A expression in Cre-transduced cells after 4-OHT treatment was measured by Western blot. PP2A Thr/Ser phosphatase activity was measured in Cre- or EV-transduced cells after 3 days of 4-OHT treatment (F). Cre-GFP+ Cre cells transduced with Sub A or GFP-EV were sorted for PP2A-activity measurement after 3-days 4-OHT treatment (G). Bone marrow pre-B cells, splenic B cells and myeloid leukemia cells from Ppp2r1afl/fl mice were transduced with Cre or EV (H). Percentages of GFP+ cells were determined by flow cytometry at time points indicated following 4-OHT treatment. (I) Ppp2r1afl/fl BCR-ABL1 B-ALL cells were transduced with doxycycline (Dox)-inducible C/EBPα (TetOn-Cebpa) and subsequently transduced with Cre. Percentages of GFP+ cells in B-lymphoid (CD19+ CD11b) and B→myeloid (CD19 CD11b+ ) populations were measured by flow cytometry at time points indicated following Dox (4-OHT treatment started at time point indicated by arrow). Data are shown as mean ± standard deviation (SD) and representative of at least three independent experiments.
Figure 2:
Figure 2:. PP2A is required for the survival of BCR-ABL1 and NRASG12D ALL cells.
Ppp2r1afl/fl BCR-ABL1 (A) and NRASG12D B-ALL (B) cells were transduced with Cre-ERT2-IRES-GFP (Cre) or ERT2-IRES-GFP-vector control (EV). Percentages of GFP+ cells were measured following 4-OHT treatment. Cre or EV-transduced ALL cells were treated for 3 days with 4-OHT and plated in methylcellulose to perform colony formation assays. Photomicrographs of colonies were taken for colony counting (scale bar indicating 1 mm). (C) The fractions of GFP+ BCR-ABL1 B-ALL cells transduced with Sub A or GFP-EV were measured following 4-OHT treatment. GFP+-sorted cells transduced with Sub A or GFP-EV were studied by colony formation assay. Ppp2r1afl/fl BCR-ABL1 B-ALL cells transduced with Cre or EV were treated with 4-OHT. (D) Western blot to measure phosphorylation of H2AX and expression of p53, Bcl2 (D) and p21, p27 and p19 Arf (E) was performed after 4-OHT treatment. (F) A heatmap to depict gene expression changes of antioxidant genes (microarray data; GSE83742) of Ppp2r1afl/fl B-ALL cells after 3-days 4-OHT treatment (Cre-mediated deletion) is shown. (G) ROS levels were measured by flow cytometry as DCF-fluorescence. Ppp2r1afl/fl BCR-ABL1 ALL cells transduced with EV (H) or Cre (I) were transduced with Catalase-IRES-GFP (Cat-GFP) or GFP-vector (EV). Percentages of GFP+ cells were measured following 4-OHT treatment. (J) Ppp2r1afl/fl BCR-ABL1 ALL cells were labeled with firefly luciferase and transduced with Cre or EV. 2 days after transduction, GFP+ cells were injected intravenously into recipient NSG mice (1×10⁶ cells/mouse; 7 mice in each group). B-ALL cell burden was monitored by luciferase bioimaging (L). Ppp2r1afl/fl NRASG12D B-ALL cells were transduced with inducible Cre or EV, sorted for GFP+ cells and injected intravenously into recipient NSG mice (3×10⁶ cells/mouse; 6 mice in each group) followed by 7 days of tamoxifen treatment via oral gavage to induce deletion in vivo (K). In (J-K), Kaplan-Meier estimates were used to plot the survival probabilities for mice that were transplanted with Cre- and EV-transduced cells. Log-rank test was used to assess statistical significance. In experiment (J), mice that showed signs of illness from leukemia were sacrificed to collect splenic B-ALL cells. GFP+ cells from recipient mice were used for PCR and Western blot to determine Ppp2r1a genotype and PP2A expression, respectively (M). Except survival analyses, other experimental data are shown as mean ± standard deviation (SD) and representative of at least three independent experiments.
Figure 3:
Figure 3:. PP2A is essential in B-lymphoid but not myeloid cells to balance glucose carbon utilization via glycolysis and PPP
Extracellular acidification rates (ECAR) were measured in (A) B-lymphoid and (B) myeloid Ppp2r1afl/fl BCR-ABL1 leukemia cells that were transduced with Cre-ERT2 (Cre) or ERT2-vector (EV). Cells were treated with 4-OHT for 2 days prior to ECAR measurements. (C-D) Ppp2r1afl/fl BCR-ABL1 ALL cells (B-lymphoid) were cultured with 25 mmol/l 1,2-213 C D-glucose for 24 hours, then harvested to extract metabolites for LC-MS based profiling. Ppp2r1afl/fl BCR-ABL1 ALL cells carrying TetOn-Cebpa were transduced with Cre or EV and were treated for 5-days with Dox for B→myeloid reprogramming. Cre-induced changes of cellular amounts of metabolites that were utilized in glycolysis (M2 13C isotopomer) or the pentose phosphate pathway (PPP; M1 13C isotopomer) are shown on a Log2-fold scale (Cre relative to EV) in B-lymphoid (C) and B→myeloid (D) cells. Phosphorylation levels of Pfkfb2 at S-483 were measured by Western blot in Ppp2r1afl/fl B-lymphoid and myeloid leukemia cells after 4-OHT treatment for Cre-mediated deletion of Ppp2r1a. Asterisks denote non-specific bands. (F) Cellular lactate M1/M2 ratio is measured from metabolites profiling data and indicates the relative amount of glucose carbon utilization via PPP and glycolysis pathways, respectively. Relative cellular F1,6BP/G6P, F6P (G) and GSH/GSSG ratios (I) were calculated in B-lymphoid and B→myeloid cells. (H) Relative NADPH/NADP ratios were measured in Ppp2r1afl/fl B-lymphoid and myeloid cells after 2-days 4-OHT treatment for Cre-mediated deletion of Ppp2r1a. (J) Western blot to compare PP2A and G6PD expression in patient-derived B-ALL (n=4; MXP2,LAX2, PDX2 and BLQ5), mantle cell lymphoma (MCL; n=3; BOS4, BOS5 and BOS6), diffuse large B cell lymphoma (DLBCL; n=2; BOS10 and BOS12), and chronic myeloid leukemia (n=10; Table S4) samples. Data are shown as mean ± standard deviation (SD) and representative of at least three independent experiments.
Figure 4:
Figure 4:. The fructose-2,6-bisphosphate 2-phosphatase TIGAR rescues cell death upon PP2A-deletion
(A) Schematic diagram of TIGAR and PP2A in balancing glucose carbon flux via glycolysis and PPP. (B) Ppp2r1afl/fl BCR-ABL1 B-ALL cells carrying inducible Cre or EV were subsequently transduced with Tigar-IRES-Orange (Tigar) or Orange-empty vector (EV). Tigar expression was measured by Western blot. (C) Percentages of Orange+ B-ALL cells were monitored in a competitive growth assay following 4-OHT treatment. Representative FACS plots are shown at the times indicated (D). (E) Ppp2r1afl/fl B-ALL cells carrying inducible Cre or EV were transduced with vectors for reconstitution or overexpression of PP2A Sub A (Sub A) or GFP-EV and assayed for cellular NADPH/NADP ratios after 2-days of 4-OHT treatment for inducible activation of Cre or EV for deletion of Ppp2r1a. Likewise, Orange+ Ppp2r1afl/fl B-ALL cells carrying inducible Cre or EV were transduced with Tigar or EV and assayed for cellular NADPH/NADP ratios after 2-days 4-OHT treatment (F). Data are shown as mean ± standard deviation (SD) and representative of at least three independent experiments.
Figure 5:
Figure 5:. B cell-specific transcriptional repression of rate-limiting PPP enzymes
(A) Gene expression changes in response to Dox-inducible Cebpa-mediated reprogramming of mouse pre-B cells into myeloid cells (GSE32330) as a heatmap. (B) Murine B-cell ALL cells were transduced with TetOn-Cebpa and induced with Dox. Western blots measuring Cebpα, Pax5, G6pdx and Pgd expression after Dox induction are shown. (C) ChIP-seq data for promoter-binding of transcription factors in human B cells (ENCODE GM12878) of G6PD and PGD are shown. CD19 and ACTA1 are shown as positive and negative controls for PAX5, respectively. (D) Single-locus quantitative ChIP in patient-derived Ph+ ALL cells (ICN1) was performed to confirm the recruitment of PAX5 to the G6PD promoter. (E) G6pdx and G6pd2 expression from RNA-seq data (GSE52870) of Dox-induced Pax5 restoration in a mouse model for B-ALL is shown as bar graph. (F) Patient-derived Ph+ ALL cells (MXP2 and ICN1) carrying PAX5 deletions (PAX5Δ) or wildtype (PAX5WT) alleles were transduced with wildtype PAX5 or dominant-negative ETV6-PAX5 (DN-PAX5) respectively. IKZF1Δ (BV173) and IKZF1WT (ICN1) Ph+ ALL cells were transduced with wildtype IKZF1 or DN-IKZF1 respectively. Protein lysates were used for Western blots to measure G6PD expression. Patients with MCL, DLBCL and CLL (G) or AML (H) were divided into two groups based on 25% highest- or lowest- mRNA levels of G6PD. Overall survival of patients was assessed in the two groups by Kaplan–Meier analysis. Log-rank test was used to assess statistical significance. Besides clinical outcome studies, experimental data are shown as mean ± standard deviation (SD) and representative of at least three independent experiments.
Figure 6:
Figure 6:. Transcription factors that determine B cell identity regulate activity of the pentose phosphate pathway and dependency on PP2A
(A) Human embryonic kidney cells (HEK-293) were transduced with a polycistronic doxycycline (Dox)-inducible vector to express the B-lineage transcription factors Pax5, Ikaros, Ebf1 and Tcf3, as confirmed by Western blot after Dox treatment for the times indicated. (B) Relative NADPH/NADP ratios were measured before and after 24 hours of Dox-induction of the polycistronic vector (Pax5, Ikaros, Ebf1 and Tcf3) or EV. (C) Murine myeloid leukemia cells were transduced with the inducible polycistronic vector for myeloid→B cell reprogramming. Phenotypic changes were monitored by flow cytometry 48 hours after induction of Dox and expression of Pax5, Ikaros, Ebf1 and Tcf3 was confirmed by Western blot. (E) In the same cells, protein levels for PP2A Sub A, PP2A Sub C and G6pdx were measured by Western blot. (F) Human small cell lung cancer (SCLC) and normal lung epithelial (BEAS2B) cell lines were used to compare PAX5, PP2A and G6PD expression by Western blot. (G) NADPH/NADP ratios were measured in PAX5+ and PAX5 SLCL cell lines and upon expression of PAX5 or EV. (H) Murine Pax5+/−Ebf1+/− BCR-ABL1 B-ALL cells were treated with the PP2A-inhibitor LB-100 at the concentrations indicated. Dose response curves depicting relative cell viability after 72 hours are depicted. Data are shown as mean ± standard deviation (SD) and representative of at least three independent experiments.
Figure 7:
Figure 7:. Target validation of PP2A and the PPP in human B cell malignancies
(A) Patient-derived Ph+ ALL xenograft (PDX2) cells were used for doxycycline (Dox)-inducible CRISPR-Cas9 mediated gene disruption of PPP2R1A (3 different gRNAs were used). Western blot was performed to measure expression of PP2A and phosphorylation of H2AX after 3 days of Dox-treatment. (B) Percentages of targeted cells were measured following Dox-treatment. (C) Patient-derived Ph+ ALL xenograft (LAX2) cells were treated with the PP2A inhibitor LB-100 (5 μmol/l) for 12 hours. Cell lysates were assayed for PP2A Thr/Ser phosphatase activity assay. (D) The same cells were cultured with 2 μmol/L LB-100 and harvested at time points indicated. Western blot was performed to measure phosphorylation of AKT, S6 and H2AX. (E) Intracellular ROS levels were measured in patient-derived Ph+ ALL xenografts cells on days 1 and 4 of treatment with LB-100 (2 μmol/L). (F) Cell viability measurements of human B-lymphoid Ph+ ALL (LAX2, MXP2, PDX2) and myeloid leukemia cells (JURL-MK1) cells after 4-days of treatment with 2 μmol/L LB-100 are plotted. Representative flow cytometry plots are shown (G). (H-I) Relative cell viabilities were measured after treatment of LB-100 (H) or 6-AN (I) for 72 hours with gradients of concentrations as indicated in B-lineage Ph+ ALL (LAX2, MXP2, PDX2 and BLQ5; n=4) and myeloid leukemia (KYO-1, EM-2, JURL-MK1 and MV4-11; n=4) cells. Y-axis shows percentages of viable cells relative to vehicle-treated cells (set to 100%). (J) Patient-derived Ph+ ALL (PDX2) cells, (K) mantle cell lymphoma cells (SP-53) and (L) diffuse large B-cell lymphoma cells (OCI-Ly10) were treated with LB-100, 6-AN or a combination of both compounds for 72 hours. Relative cell viability was assessed to measure synergistic effect of combination treatment. (M) Patient-derived diffuse large B cell lymphoma cells (BOS12) were intravenously injected to recipient NSG mice (3×10⁶ cells/mouse; 7 mice in each group). Intraperitoneal injection of LB-100 (1.5 mg/kg), 6-AN (1 mg/kg) or combination (1.5 mg/kg LB-100 + 1 mg/kg 6-AN) started 7 days after cell injection at indicated time points. Kaplan-Meier survival curves are shown. Log-rank test was used to assess statistical significance of each treated group compared to vehicle group. Except for Kaplan-Meier survival analyses, other experimental data are shown as mean ± standard deviation (SD) and representative of at least three independent experiments.

References

    1. Apostolidis SA, Rodríguez-Rodríguez N, Suárez-Fueyo A, Dioufa N, Ozcan E, Crispín JC, Tsokos MG, and Tsokos GC (2016). Phosphatase PP2A is requisite for the function of regulatory T cells. Nat. Immunol. 17, 556–564. - PMC - PubMed
    1. Bensaad K, Tsuruta A, Selak MA, Vidal MNC, Nakano K, Bartrons R, Gottlieb E, and Vousden KH (2006). TIGAR, a p53-Inducible Regulator of Glycolysis and Apoptosis. Cell 126, 107–120. - PubMed
    1. Buchner M, Swaminathan S, Chen Z, and Müschen M (2015). Mechanisms of pre-B-cell receptor checkpoint control and its oncogenic subversion in acute lymphoblastic leukemia. Immunol. Rev 263, 192–209. - PubMed
    1. Cairns RA, Harris IS, and Mak TW (2011). Regulation of cancer cell metabolism. Nat. Rev. Cancer 11, 85–95. - PubMed
    1. Chan LN, Chen Z, Braas D, Lee J-W, Xiao G, Geng H, Cosgun KN, Hurtz C, Shojaee S, Cazzaniga V, et al. (2017). Metabolic gatekeeper function of B-lymphoid transcription factors. Nature 542, 479–483. - PMC - PubMed

Publication types

MeSH terms