. 2018 Mar 22;173(1):181-195.e18.
doi: 10.1016/j.cell.2018.02.034. Epub 2018 Mar 15.

Pervasive Regulatory Functions of mRNA Structure Revealed by High-Resolution SHAPE Probing

Affiliations

Pervasive Regulatory Functions of mRNA Structure Revealed by High-Resolution SHAPE Probing

Anthony M Mustoe et al. Cell. .

Abstract

mRNAs can fold into complex structures that regulate gene expression. Resolving such structures de novo has remained challenging and has limited our understanding of the prevalence and functions of mRNA structure. We use SHAPE-MaP experiments in living E. coli cells to derive quantitative, nucleotide-resolution structure models for 194 endogenous transcripts encompassing approximately 400 genes. Individual mRNAs have exceptionally diverse architectures, and most contain well-defined structures. Active translation destabilizes mRNA structure in cells. Nevertheless, mRNA structure remains similar between in-cell and cell-free environments, indicating broad potential for structure-mediated gene regulation. We find that the translation efficiency of endogenous genes is regulated by unfolding kinetics of structures overlapping the ribosome binding site. We discover conserved structured elements in 35% of UTRs, several of which we validate as novel protein binding motifs. RNA structure regulates every gene studied here in a meaningful way, implying that most functional structures remain to be discovered.

Keywords: RNA binding proteins; RNA structure; non-coding RNA; ribosomal proteins; translation efficiency; translation regulation; translational coupling.


Conflict of interest statement

DECLARATION OF COMPETING INTERESTS

K.M.W. is an advisor to and holds equity in Ribometrix, to which SHAPE-MaP technologies have been licensed.

Figures
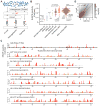
Figure 1
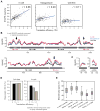
Figure 1. E. coli RNA structure overview
(A) Experimental strategy. (B) Diversity of E. coli mRNA structures reflected by variation in median gene SHAPE reactivity. (C) Nucleotide-resolution SHAPE profiles for selected genes. Genes are labeled in B. (D) Comparison of in-cell and cell-free SHAPE reactivities for coding regions shows RNA structure is destabilized in cells, but clearly correlated overall. See also Figures S1 and S2.
Figure 2
Figure 2. Translation destabilizes coding RNA structure
(A) Gene median SHAPE reactivity versus translation efficiency (TE) (Li et al., 2014). (B) SHAPE reactivity profiles for polycistronic mRNAs. Reactivities are shown as medians over 51-nt sliding windows. Translation efficiency is shown beneath each gene. In-cell SHAPE reactivities increase specifically in highly translated genes. Kasugamycin treatment partially abrogates this increase in mRNAs, but (C) has no effect on non-coding RNAs glmZ and gcvB. (D) Fraction of high-confidence (pairing probability >98%) base pairs spanning greater than 50 nucleotides in cell-free and in-cell coding regions as a function of TE. Long-range base pairs are specifically disfavored in highly translated genes. (E) Percentages of base pairs shared in minimum free energy RNA structure models. Boxes indicate the interquartile range (IQR), and whiskers indicate data within 1.5×IQR of the top and bottom quartiles. See also Figure S3.
Figure 3
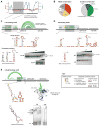
Figure 3. RBS structure regulates translation
(A) Identification of potential translationally coupled genes, which were excluded from TE analysis. (B) Equilibrium unfolding model for mRNA loading into the 30S mRNA channel (top) and correlation between TE and RBS ΔGunfold for translationally uncoupled genes (bottom). N=157. (C) Kinetic unfolding model for mRNA loading into the 30S subunit (top) and correlation between TE and RBS ΔGunfold for translationally uncoupled genes (bottom). (D) Correlation between gene TE and ΔGunfold computed for different coding sequence windows. The indicated significance cutoff corresponds to p≈0.05 (two-sided Wald test; precise cutoff varies between datasets). (E) Example of two high TE genes with structured CDSs in-cell. Base pairs are shown as arcs, colored by pairing probability. Both genes have unstructured RBSs, and hence are predicted to have high TE by the RBS kinetic unfolding model (C), but not by models considering CDS structure. See also Figure S4.
Figure 4
Figure 4. Reporter-gene validation of RBS kinetic unfolding model
(A) Example parent endogenous transcript and fusion to GFP. Lengths of the fused non-coding and CDS segments are indicated. In-cell structures are shown as pairing probability arcs, as in Figure 3. The RBS is highlighted in brown, with the computed ΔGunfold shown underneath. (B) Example fusions for endogenous genes predicted to have moderate and low ΔGunfold. Note that, despite being embedded in a larger hairpin structure, the dapF RBS is located in a relatively unstructured loop with moderate ΔGunfold, and hence is predicted to have moderate TE by the kinetic unfolding model. (C) Fusion genes recapitulate predicted trend between expression and RBS ΔGunfold. Protein expression was measured as GFP fluorescence normalized to an RFP reference encoded on the same plasmid (nGFP). Genes shown in panels A and B are highlighted in red. Data represent the mean ± SD from three replicates. N=29. P-value computed by two-sided Wald test.
Figure 5
Figure 5. RNA structure mediates translational coupling
(A) Model of structure-mediated translational coupling in which upstream translation unfolds otherwise inhibitory RNA structures. (B, C) Representative genes possessing many or few gene-linking base pairs. In-cell structures are shown as pairing probability arcs, as in Figure 3. Translation efficiency is shown beneath each gene. (D) In-cell transcriptome-wide analysis reveals that having many gene-linking base pairs is a significant predictor that adjacent genes will have similar TEs. Gene pairs were classified as having few versus many linking pairs if they were in top and bottom quintiles of all gene pairs, respectively. P-value computed by two-tailed Mann-Whitney U-test. See also Figure S5.
Figure 6
Figure 6. Structure-based discovery of novel RNA regulatory motifs
(A) Candidate motifs are identified in non-coding regions based on ability to form stable, well-defined structures, as defined by low SHAPE reactivity and low structural entropy. Low-SHAPE/low-entropy region is emphasized with gray shading. (B) Conservation of identified low-SHAPE/entropy structures in enterobacteria, and evidence of function from prior literature (N=58; see Table S1). (C–E) Identification and validation of the L13-binding motif, C5-binding motif, and L9/L28-binding motif. For each motif, the defining low-SHAPE/entropy region is highlighted in dark gray on the transcript model, with expansions to incorporate surrounding sequences in light gray (top). The two secondary structures shown illustrate (i) SHAPE probing data superimposed on the structure of the 5′ UTR construct used for validation and (ii) the consensus structure labeled by percent conservation in enterobacteria. Gels show electrophoretic mobility shift assays for the designated protein-RNA interactions. In (E), the structure of the 23S rRNA binding site for ribosomal proteins L9 and L28 is also shown. In (C), L13 concentrations varied from 22 to 800 nM for the H1–H5 construct, and 288 to 800 nM for the H2–H4 construct. In (D) C5 varied from 10 to 240 nM. In (E) L9 and L28 concentrations were 500 nM. –, no protein. See also Figure S7, Table S1.
Figure 7
Figure 7. Mechanisms identified in this study through which RNA structure regulates gene expression
The function of identified novel non-coding motifs is supported by direct binding studies, evolutionary conservation, and literature cross-references. The function of RBS structure in regulating gene TE is supported by transcriptome-wide analysis and reporter gene assays. The role of gene-linking structures in mediating translational coupling is supported by transcriptome-wide analysis and literature cross-references.

Comment in

  • Structure in sequence.
    Song Y. Song Y. Nat Chem Biol. 2018 May;14(5):413. doi: 10.1038/s41589-018-0050-3. Nat Chem Biol. 2018. PMID: 29662185 No abstract available.

Similar articles

Cited by

References

    1. Aseev LV, Bylinkina NS, Boni IV. Regulation of the rplY gene encoding 5S rRNA binding protein L25 in Escherichia coli and related bacteria. RNA. 2015;21:851–861. - PMC - PubMed
    1. Aseev LV, Koledinskaya LS, Boni IV. Regulation of Ribosomal Protein Operons rplM-rpsI, rpmB-rpmG, and rplU-rpmA at the Transcriptional and Translational Levels. J Bacteriol. 2016;198:2494–2502. - PMC - PubMed
    1. Bentele K, Saffert P, Rauscher R, Ignatova Z, Blüthgen N. Efficient translation initiation dictates codon usage at gene start. Mol Syst Biol. 2013;9:675–675. - PMC - PubMed
    1. Boël G, Letso R, Neely H, Price WN, Wong KH, Su M, Luff JD, Valecha M, Everett JK, Acton TB, et al. Codon influence on protein expression in E. coli correlates with mRNA levels. Nature. 2016;529:358–363. - PMC - PubMed
    1. Burkhardt DH, Rouskin S, Zhang Y, Li GW, Weissman JS, Gross CA. Operon mRNAs are organized into ORF-centric structures that predict translation efficiency. Elife. 2017;6:811. - PMC - PubMed

Publication types

MeSH terms