. 2018 Mar 22;173(1):90-103.e19.
doi: 10.1016/j.cell.2018.02.036. Epub 2018 Mar 15.

Ribosome Levels Selectively Regulate Translation and Lineage Commitment in Human Hematopoiesis

Affiliations

Ribosome Levels Selectively Regulate Translation and Lineage Commitment in Human Hematopoiesis

Rajiv K Khajuria et al. Cell. .

Abstract

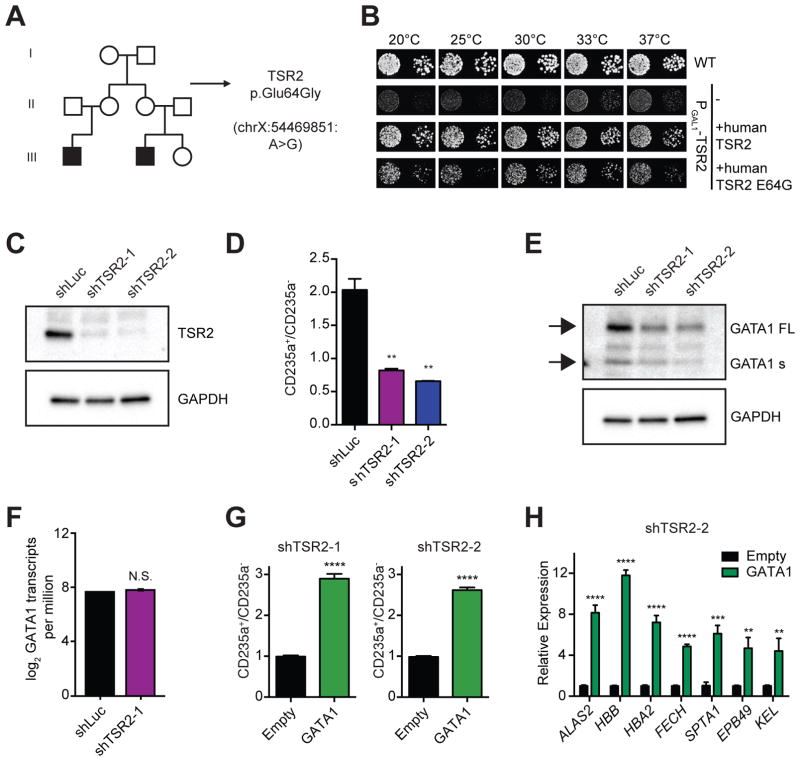
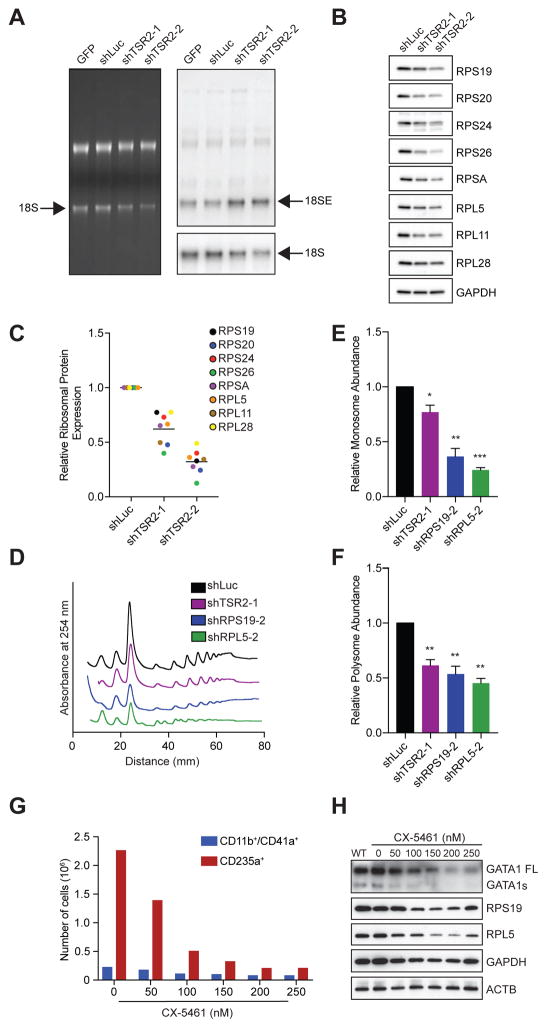
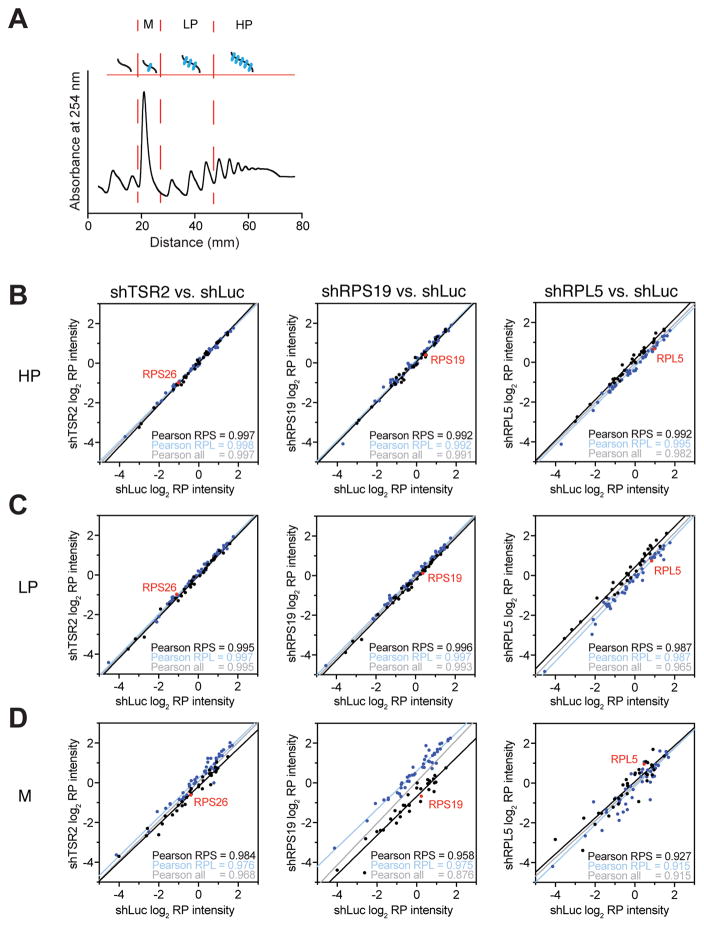
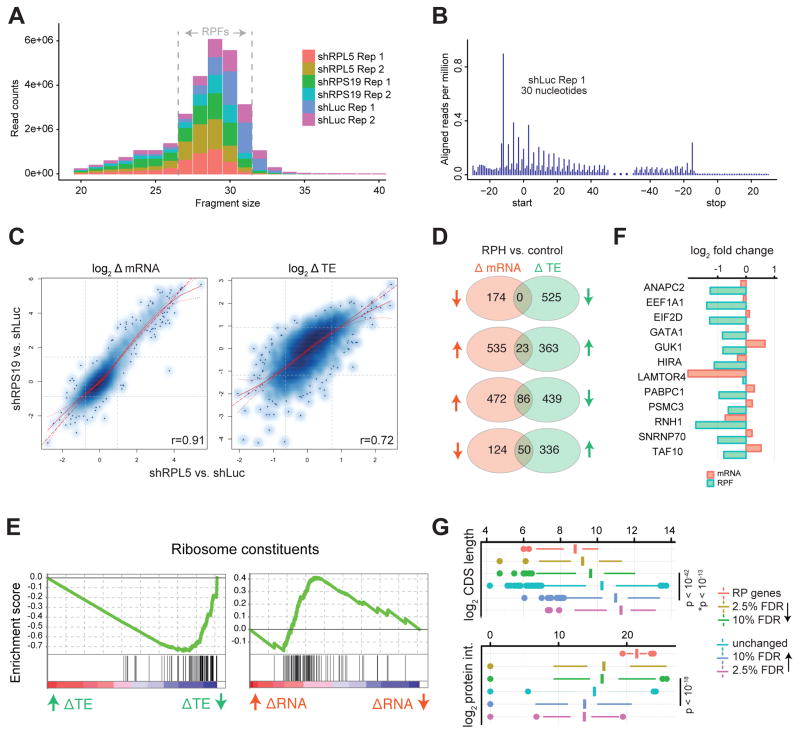
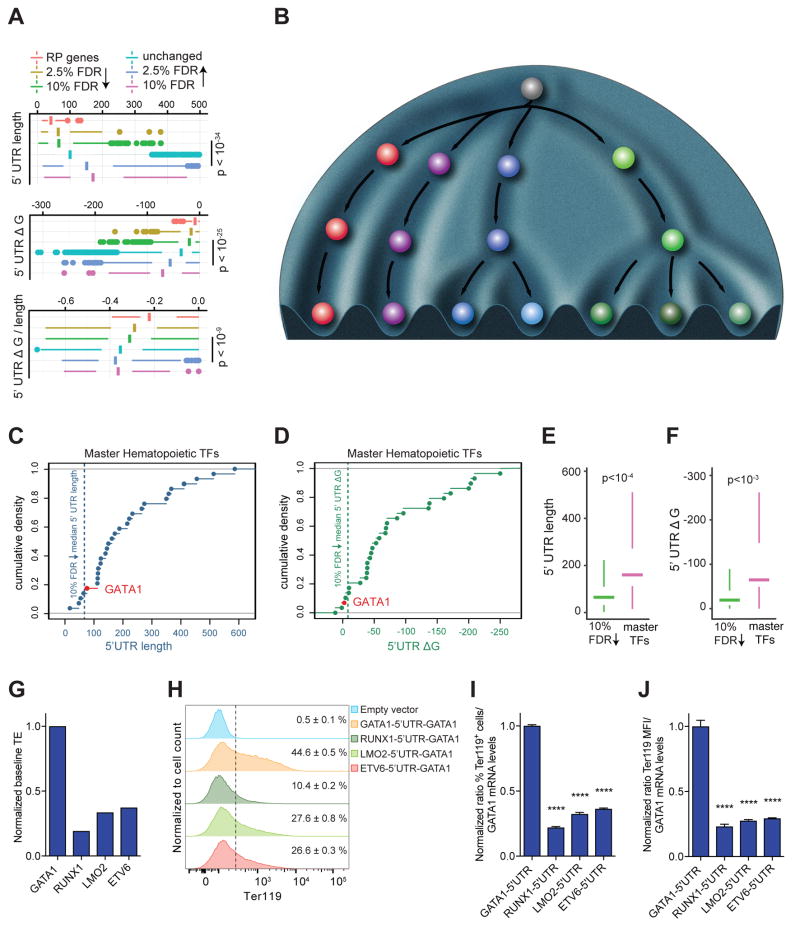
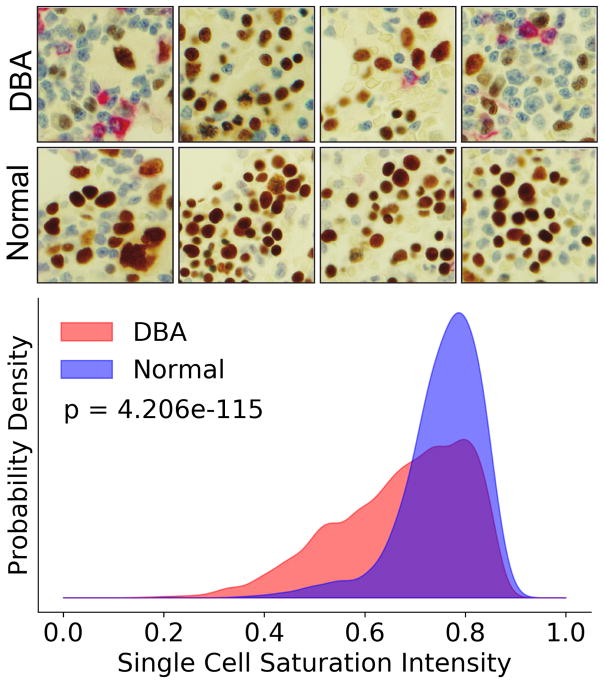
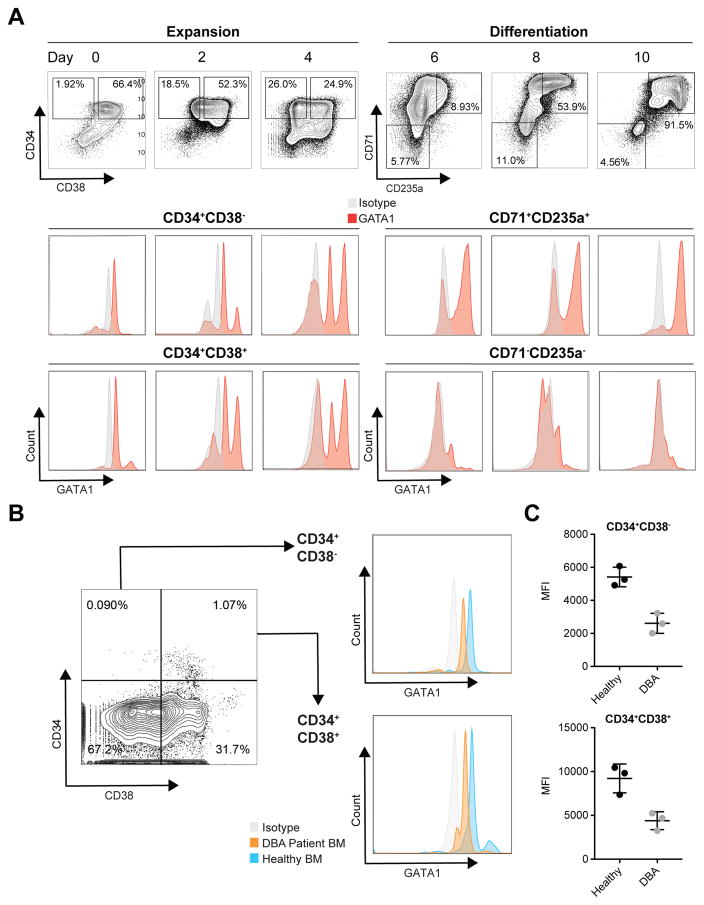
Blood cell formation is classically thought to occur through a hierarchical differentiation process, although recent studies have shown that lineage commitment may occur earlier in hematopoietic stem and progenitor cells (HSPCs). The relevance to human blood diseases and the underlying regulation of these refined models remain poorly understood. By studying a genetic blood disorder, Diamond-Blackfan anemia (DBA), where the majority of mutations affect ribosomal proteins and the erythroid lineage is selectively perturbed, we are able to gain mechanistic insight into how lineage commitment is programmed normally and disrupted in disease. We show that in DBA, the pool of available ribosomes is limited, while ribosome composition remains constant. Surprisingly, this global reduction in ribosome levels more profoundly alters translation of a select subset of transcripts. We show how the reduced translation of select transcripts in HSPCs can impair erythroid lineage commitment, illuminating a regulatory role for ribosome levels in cellular differentiation.

Keywords: Diamond-Blackfan anemia; GATA1; erythropoiesis; genetics; hematopoiesis; lineage commitment; ribosome; translation.


Conflict of interest statement

DECLARATION OF INTERESTS

There are no competing interests to disclose.

Figures

Figure 1
Figure 1. DBA with TSR2 Loss of Function
(A) Identification of a missense mutation in TSR2 in a pedigree with two affected male cousins. (B) The human TSR2 ortholog could substantially rescue growth of the Tsr2 depleted yeast strain, while the TSR2 ortholog with the DBA-associated mutation had reduced rescue. (C) Western blot showing the identification of two short hairpin RNAs (shRNAs) that target TSR2 in primary human HSPCs undergoing erythroid lineage commitment on day 5 after transduction. (D) The ratio of erythroid (CD235a+) to non-erythroid (CD235a) cells on day 5 in differentiating HSPCs after transduction with shRNAs targeting Luciferase (shLuc) or TSR2 (shTSR2). The data are shown as the mean ± the standard error of mean (SEM) from three independent experiments. (**P ≤ 0.01 using an unpaired two-tailed Student’s t-test). (E) Western blot detection of GATA1 protein from lysates of differentiating HSPCs on day 5 after transduction. Arrowheads indicate GATA1 full length (FL) and GATA1 short, respectively, on top and bottom. (F) GATA1 mRNA levels derived from mRNA-seq in differentiating HSPCs. Shown is the mean ± standard deviation (SD) of two biological replicates. (G) The ratio of erythroid (CD235a+) to non-erythroid (CD235a) cells on day 5 after transduction with shTSR2 and either a control vector or with GATA1 rescue. Shown is the mean ± the SD from three independent experiments. (****P ≤ 0.0001 using an unpaired two-tailed Student’s t-test). (H) Quantitative RT-PCR gene expression (normalized to β-actin) in differentiating HSPCs upon TSR2 suppression with or without GATA1 rescue. Shown is the mean ± the SD of three replicates. (**P ≤ 0.01; ***P ≤ 0.001; ****P ≤ 0.0001 using an unpaired two-tailed Student’s t-test).
Figure 2
Figure 2. DBA-Associated Molecular Lesions Result in Reduced Ribosome Levels
(A) TSR2 suppression results in impaired pre-rRNA processing in human hematopoietic cells. Ethidium bromide-stained RNA gel (left panel) and Northern blot analysis (right panel) are shown in setting of TSR2 suppression. (B) Western blot detection of the indicated proteins from lysates of differentiating HSPCs following TSR2 suppression. (C) Relative quantification of RP intensities normalized to GAPDH. (D) Polysome profiles of primary human HSPCs undergoing differentiation that show the reduction of monosome and polysome levels with DBA-associated molecular lesions. The traces are shown offset from one another on the arbitrary y-axis (derived from relative absorbance at 254 nm) for ease of visualization. (E–F) Relative quantification of monosome and polysome abundances from primary human HSPCs undergoing erythroid differentiation. Shown is the mean ± SD of two independent experiments. (*P ≤ 0.05; **P ≤ 0.01; ***P ≤ 0.001 using an unpaired two-tailed Student’s t-test). (G) Absolute numbers of erythroid cells as measured by surface marker expression of CD235a and myeloid cells as measured by CD41a or CD11b at 72 h after treatment with increasing concentrations of the RNA polymerase I inhibitor CX-5461 in primary human HSPCs undergoing differentiation. Results from a representative experiment are shown. (H) Western blot detection of the indicated proteins from lysates of differentiating HSPCs at 72 h after treatment with increasing concentrations of CX-5461.
Figure 3
Figure 3. No Evidence for Variation in Ribosome Protein Composition in Cells with DBA-Associated Molecular Lesions
(A) Human hematopoietic cells treated with control vectors or with TSR2, RPS19, or RPL5 suppression were fractionated by sucrose gradient sedimentation. Monosome fractions (M), light polysomes (LP), and heavy polysomes (HP) were analyzed by tandem mass tag (TMT) mass spectrometry. (B–D) Log2 transformed and median centered RP intensities from two independent replicates in various knockdown (KD) conditions versus shLuc control in HP, LP, and M fractions. RPs of the large subunit are shown in blue, RPs of the small subunit are shown in black, and the targeted or related RP is highlighted in red. Linear regressions for small subunit RPs (black), large subunit RPs (blue) and all RPs together (grey) are shown and Pearson correlations are reported.
Figure 4
Figure 4. Identification of Transcripts Whose Translation Is Sensitive to RP Haploinsufficiency
(A) After adapter trimming and rRNA removal, the distribution of ribosome profiling reads is shown. The reads all fall between 27–32 nucleotides. (B) The ribosome profiling data exhibit triplet periodicity based upon meta-gene analysis of CDS regions. A representative example is shown. (C) Differences between shLuc and shRPL5 or shRPS19 in primary differentiating human HSPCs are highly correlated at both the transcriptional and translational levels, as displayed in a scatter plot where color indicates point density. Both local regression (with confidence intervals) and linear fits are shown in red. Pearson correlations are indicated. (D) Venn diagrams of differentially expressed (Δ mRNA, FDR < 1% and log2 |fold change| > 1) or differentially translated (Δ translation efficiency (TE), FDR < 10%) genes showing that changes in translation and in transcription resulting from RP haploinsufficiency compared to control occur largely independent of each other. (E) Gene set enrichment analyses indicate that RP genes are co-regulated at the translational (permutation FDR < 0.0001), but not transcriptional (permutation FDR = 0.36) level with RP haploinsufficiency. The enrichment score is plotted in green, and genes are plotted as black lines according to their rank. (F) The relative reduction in translation efficiency for selected RP haploinsufficiency-sensitive transcripts including GATA1 is shown in green, relative changes in mRNA expression are shown in red. (G) Boxplots for CDS length or cellular protein intensities in primary human erythroid progenitors are shown across FDR thresholds for differential translation. CDS length was calculated for the most abundant transcript in shLuc and RP haploinsufficient differentiating HSPCs (*controlled for PolyA-selection based bias). P-values were determined by an F-test.
Figure 5
Figure 5. Analysis of 5′ UTR Features of Key Hematopoietic Transcription Factors
(A) Boxplots for different 5′ UTR features are shown across FDR thresholds for differential translation in primary differentiating human HSPCs. The minimum free energy (ΔG) was calculated using RNAfold for the entire 5′ UTR. As this prediction is correlated with length, ΔG corrected for 5′ UTR length was also analyzed. P-values were determined by an F-test. (B) Master regulator transcription factors (TFs) are shown in their approximate positions of action in a model of hematopoiesis. HSC: hematopoietic stem cell, RBCs: red blood cells, Mega: megakaryocyte, Gran: granulocyte, Mono: monocyte, B Lymph: B lymphocyte, T Lymph: T lymphocyte, NK: natural killer cell. (C–D) The GATA1 5′ UTR is shorter and less structured than those of most other hematopoietic master TFs. GATA1 is highlighted in red. The median line for the 10% FDR RP haploinsufficiency-sensitive transcripts is indicated, respectively. (E–F) Most hematopoietic master TFs have significantly longer (2.5 mean-fold difference) and more structured 5′ UTRs (2.8 mean-fold difference in ΔG) than transcripts that are translationally downregulated with RP haploinsufficiency. (G) Normalized baseline translation efficiencies (TE) based on ribosome profiling in unperturbed HSPCs undergoing erythroid lineage commitment are shown for GATA1, RUNX1, LMO2, and ETV6. (H) Histogram plots for Ter119 in GFP+ populations derived from G1E cells that were transduced with GATA1-, RUNX1-, LMO2- or ETV6-5′UTR-GATA1 cDNA constructs. The mean ± the SD for the percentages of Ter119+ cells of three replicates is shown. (I) Bar graphs for normalized ratios of % Ter119+ populations in GFP+ cells/ GATA1 mRNA levels from G1E cells that were transduced with GATA1-, RUNX1-, LMO2- or ETV6-5′UTR-GATA1 constructs. The mean ± the SD of three replicates is shown (****P ≤ 0.0001 using an unpaired two-tailed Student’s t-test). (J) Bar graphs for normalized ratios of the Ter119 mean fluorescence intensities (MFIs) of GFP+ cells/GATA1 mRNA levels from G1E cells that were transduced with the constructs listed above. The mean ± the SD of three replicates is shown (****P ≤ 0.0001 using an unpaired two-tailed Student’s t-test).
Figure 6
Figure 6. Reduced GATA1 Protein Levels in Bone Marrow Progenitors from DBA Patients
Representative images of human bone marrow biopsies stained for GATA1 protein (brown) in DBA patients with diverse RP mutations and normal healthy controls. Below, is a density plot comparing single cell saturation intensities between DBA patients and normal individuals that shows significantly reduced expression in DBA (n = 2759 for DBA and 2149 cells for controls; significance calculated by the Mann-Whitney U test).
Figure 7
Figure 7. Reduced GATA1 Protein Expression in Primary HSPCs from DBA Patients
(A) Intracellular flow cytometric detection shows low levels of GATA1 expression in a subset of both the primitive CD34+CD38 and more differentiated CD34+CD38+ HSPC populations (left panels). With differentiation, robust and high-level GATA1 protein expression can be seen in committed CD235a+CD71+ erythroid cells (right panels). (B) Reduced GATA1 protein expression in single cells from HSPC populations from a DBA patient bone marrow aspirate sample compared to a healthy control. (C) GATA1 MFIs show a consistent reduction in GATA1 expression in CD34+CD38 and CD34+CD38+ HSPC populations in DBA patients with RPL35A, RPL5, or RPS19 mutations compared to healthy controls.

References

    1. Allam R, Chennupati V, Veiga DFT, Maslowski KM, Tardivel A, Quadroni M, Duchosal M, MacDonald HR, Fasel N, Angelillo-Scherrer A, et al. An Unexpected Role for Ribonuclease Inhibitor (RNH1) in Erythropoiesis. Blood. 2014;124:244–244.
    1. An X, Schulz VP, Li J, Wu K, Liu J, Xue F, Hu J, Mohandas N, Gallagher PG. Global transcriptome analyses of human and murine terminal erythroid differentiation. Blood. 2014;123:3466–3477. - PMC - PubMed
    1. Arner E, Daub CO, Vitting-Seerup K, Andersson R, Lilje B, Drablos F, Lennartsson A, Ronnerblad M, Hrydziuszko O, Vitezic M, et al. Transcribed enhancers lead waves of coordinated transcription in transitioning mammalian cells. Science. 2015;347:1010–1014. - PMC - PubMed
    1. Bolze A, Mahlaoui N, Byun M, Turner B, Trede N, Ellis SR, Abhyankar A, Itan Y, Patin E, Brebner S, et al. Ribosomal protein SA haploinsufficiency in humans with isolated congenital asplenia. Science. 2013;340:976–978. - PMC - PubMed
    1. Brooks SS, Wall AL, Golzio C, Reid DW, Kondyles A, Willer JR, Botti C, Nicchitta CV, Katsanis N, Davis EE. A novel ribosomopathy caused by dysfunction of RPL10 disrupts neurodevelopment and causes X-linked microcephaly in humans. Genetics. 2014;198:723–733. - PMC - PubMed

Publication types

MeSH terms