

Leveraging delay discounting for health: Can time delays influence food choice?
- PMID: 29551401
- PMCID: PMC5971135
- DOI: 10.1016/j.appet.2018.03.010
Leveraging delay discounting for health: Can time delays influence food choice?
Abstract
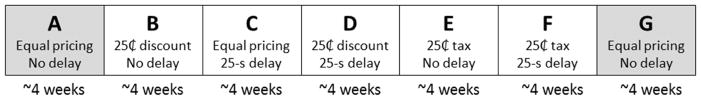
Delay discounting, the tendency to choose smaller immediate rewards over larger delayed rewards, is theorized to promote consumption of immediately rewarding but unhealthy foods at the expense of long-term weight maintenance and nutritional health. An untested implication of delay discounting models of decision-making is that selectively delaying access to less healthy foods may promote selection of healthier (immediately available) alternatives, even if they may be less desirable. The current study tested this hypothesis by measuring healthy versus regular vending machine snack purchasing before and during the implementation of a 25-s time delay on the delivery of regular snacks. Purchasing was also examined under a $0.25 discount on healthy snacks, a $0.25 tax on regular snacks, and the combination of both pricing interventions with the 25-s time delay. Across 32,019 vending sales from three separate vending locations, the 25-s time delay increased healthy snack purchasing from 40.1% to 42.5%, which was comparable to the impact of a $0.25 discount (43.0%). Combining the delay and the discount had a roughly additive effect (46.0%). However, the strongest effects were seen under the $0.25 tax on regular snacks (53.7%) and the combination of the delay and the tax (50.2%). Intervention effects varied substantially between vending locations. Importantly, time delays did not harm overall vending sales or revenue, which is relevant to the real-world feasibility of this intervention. More investigation is needed to better understand how the impact of time delays on food choice varies across populations, evaluate the effects of time delays on beverage vending choices, and extend this approach to food choices in contexts other than vending machines.
Trial registration: ClinicalTrials.gov, NCT02359916.
Keywords: Behavioral economics; Delay discounting; Food choice; Pricing interventions; Vending machines.
Copyright © 2018 Elsevier Ltd. All rights reserved.
Conflict of interest statement
Figures


References
-
- Schwingshackl L, Hoffmann G. Diet quality as assessed by the Healthy Eating Index, the Alternate Healthy Eating Index, the Dietary Approaches to Stop Hypertension score, and health outcomes: a systematic review and meta-analysis of cohort studies. J Acad Nutr Diet. 2015;115:780–800. - PubMed
-
- Allison DB, Fontaine KR, Manson JE, Stevens J, VanItallie TB. Annual deaths attributable to obesity in the United States. JAMA. 1999;282:1530–8. - PubMed
Publication types
MeSH terms
Associated data
Grants and funding
LinkOut - more resources
Full Text Sources
Other Literature Sources
Medical
