. 2018 Apr 2;28(7):1005-1015.e5.
doi: 10.1016/j.cub.2018.02.037. Epub 2018 Mar 15.

Accuracy of Rats in Discriminating Visual Objects Is Explained by the Complexity of Their Perceptual Strategy

Affiliations

Accuracy of Rats in Discriminating Visual Objects Is Explained by the Complexity of Their Perceptual Strategy

Vladimir Djurdjevic et al. Curr Biol. .

Abstract

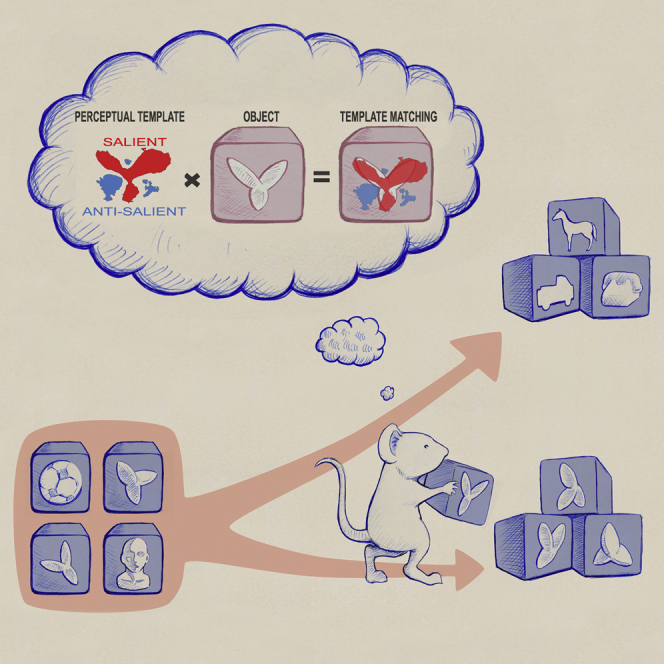
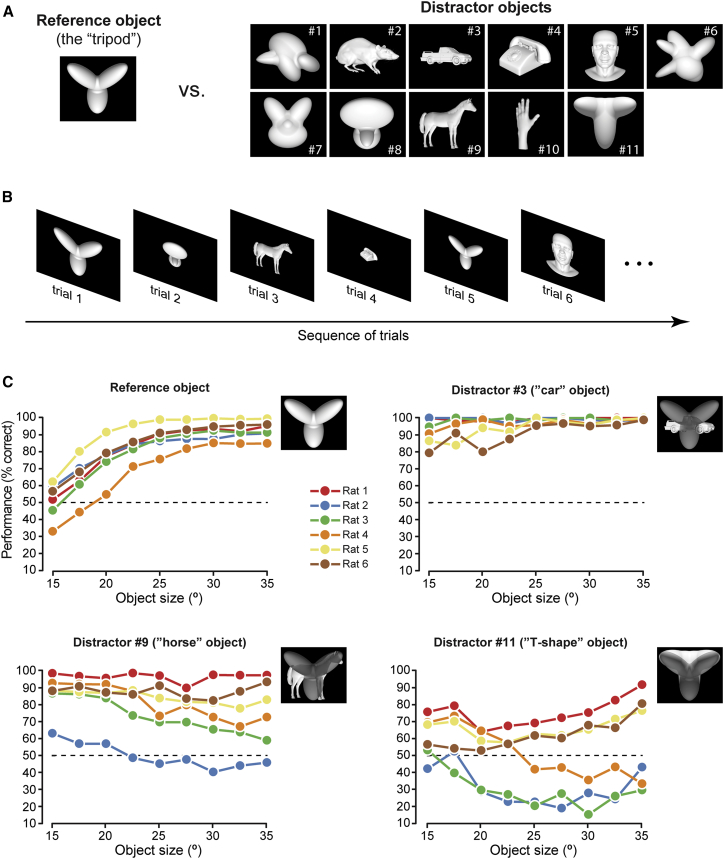
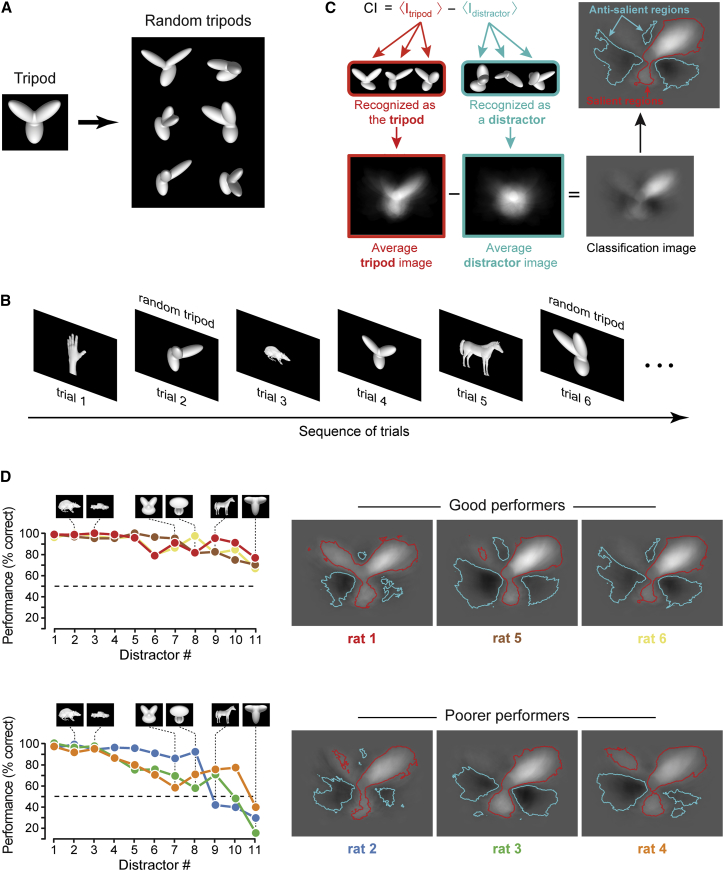
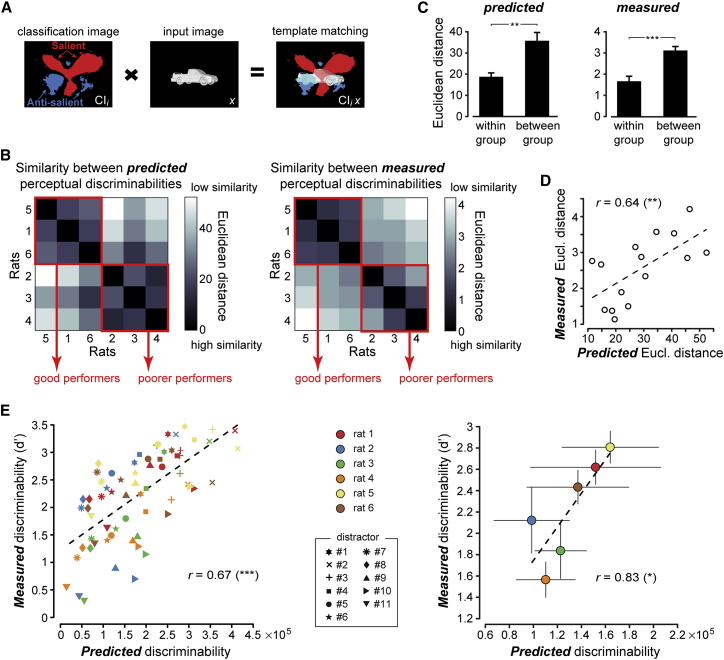
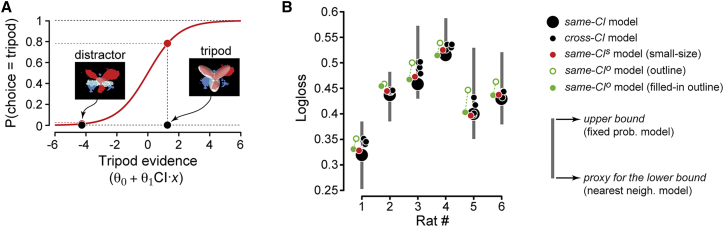
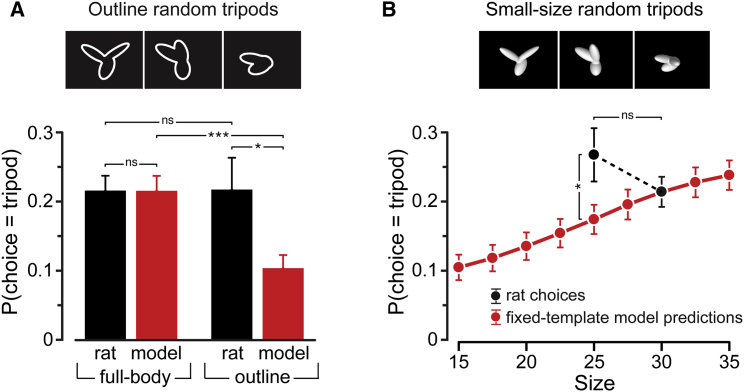
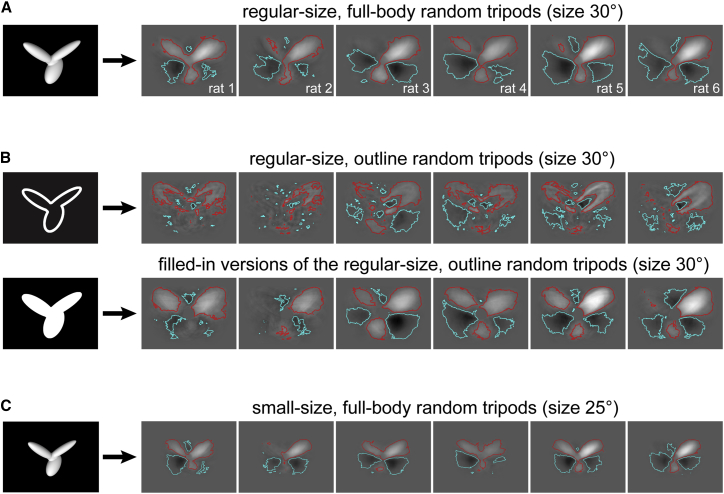
Despite their growing popularity as models of visual functions, it remains unclear whether rodents are capable of deploying advanced shape-processing strategies when engaged in visual object recognition. In rats, for instance, pattern vision has been reported to range from mere detection of overall object luminance to view-invariant processing of discriminative shape features. Here we sought to clarify how refined object vision is in rodents, and how variable the complexity of their visual processing strategy is across individuals. To this aim, we measured how well rats could discriminate a reference object from 11 distractors, which spanned a spectrum of image-level similarity to the reference. We also presented the animals with random variations of the reference, and processed their responses to these stimuli to derive subject-specific models of rat perceptual choices. Our models successfully captured the highly variable discrimination performance observed across subjects and object conditions. In particular, they revealed that the animals that succeeded with the most challenging distractors were those that integrated the wider variety of discriminative features into their perceptual strategies. Critically, these strategies were largely preserved when the rats were required to discriminate outlined and scaled versions of the stimuli, thus showing that rat object vision can be characterized as a transformation-tolerant, feature-based filtering process. Overall, these findings indicate that rats are capable of advanced processing of shape information, and point to the rodents as powerful models for investigating the neuronal underpinnings of visual object recognition and other high-level visual functions.

Keywords: classification; filtering; image; object; perception; processing; recognition; rodent; shape; vision.


Figures

None
Graphical abstract
Figure 1
Figure 1
Stimulus Set and Discrimination Performances (A) The reference and distractor objects that rats were trained to discriminate. (B) Schematic of the trial structure during training with the reference and distractor objects. Both object identity and size were randomly sampled in each individual trial according to the procedure detailed in STAR Methods. See also Figure S1. (C) Discrimination performances, as a function of stimulus size, for the reference object and three example distractors. Each curve reports the performance of a rat over the pool of trials recorded across the 32 sessions, during which the random tripods (Figure 2A), in addition to the reference and distractor objects, were also presented (as illustrated in Figure 2B). Insets: overlaid pictures of the reference and each of the three distractors (with the reference rendered in a darker shading to make both objects visible), so as to appreciate to what extent the objects overlapped.
Figure 2
Figure 2
Inferring Rat Perceptual Strategies by Computing Classification Images (A) Examples of the random variations of the reference object (referred to as “random tripods”) that were used to infer rat perceptual strategy. (B) Schematic of the trial structure when the random tripods were presented, in randomly interleaved trials, along with the reference and distractor objects (see STAR Methods). See also Table S1. (C) Illustration of the method to infer rat perceptual strategy by computing a classification image. (D) The discrimination performances (computed over the same pool of sessions as in Figure 1C) achieved by the rats over the full set of distractors, when presented at 30° of visual angle (left), are shown along with the classification images obtained for all the animals (right). The rats are divided, according to their proficiency in the discrimination task, into a group of good performers (top) and a group of poorer performers (bottom).
Figure 3
Figure 3
Predicting the Perceptual Discriminability of the Distractors Using the Classification Images as Spatial Filters (A) The overlap between the classification image of rat 1 and an example distractor object (3) provides a graphical intuition of the template-matching computation used to infer the discriminability of the distractors from the reference. (B) Left: prediction of how similarly each pair of rats would perceive the 11 distractors, if the animals used their classification images to process the stimuli. Similarity was measured as the Euclidean distance between the two sets (vectors) of perceptual discriminabilities of the 11 distractors, as inferred by using the classification images of the rats as perceptual filters. Right: estimate of how similarly each pair of rats actually perceived the distractors, with perceptual discriminability quantified using a d′ sensitivity index. Similarity was measured as the Euclidean distance between the two sets (vectors) of d′ obtained, across the 11 distractors, for the two animals. Rats along the axes of the matrices were sorted according to the magnitude of their d′ vectors (from largest to smallest). The red frames highlight two groups of animals with very similar predicted and measured discriminabilities (corresponding to the “good” and “poorer” performers in Figure 2D). (C) The Euclidean distances in the cells located above the diagonals of the matrices of (B) were averaged, separately, for the rats inside and outside the red frames. The resulting within- and between-group average distances (±SEM) were significantly different according to a one-tailed t test (∗∗p < 0.01 and ∗∗∗p < 0.001, respectively, for the predicted and measured distances). (D) Relationship between the measured and predicted Euclidean distances corresponding to the cells located above the diagonals of the matrices of (B). The two quantities were significantly correlated according to a two-tailed t test (∗∗p < 0.01). (E) Relationship between measured and predicted discriminability of the distractors, as obtained (1) by considering all rats and distractor conditions together (left); and (2) after averaging, separately for each animal, the measured and predicted discriminabilities across the 11 distractors (right) (dots show means ± SEM). Both correlations were significant according to a two-tailed t test (p < 0.05, ∗∗∗p < 0.001).
Figure 4
Figure 4
Building Predictive Models of Rat Perceptual Choices (A) Illustration of how the classification image obtained for rat 1 was combined with logistic regression to (1) infer the evidence gathered by the animal about an arbitrary input image being the tripod (abscissa axis); and (2) translate this evidence into a probability of choosing the tripod category (ordinate axis). (B) The accuracy of various models in predicting rat responses to the full-body, regular-size random tripods is measured using a logloss function (see STAR Methods). Predictions of five different models are shown (see caption on the right), which differed according to the classification images that were plugged into Equation 1 (see Results). The logloss values obtained by constant-probability and nearest-neighborhood response models are also shown, to provide, respectively, an estimate of the logloss’s upper bound and a proxy of its lower bound (gray bars). See also Figures S2, S3, and S5.
Figure 5
Figure 5
Rat Invariant Recognition Cannot Be Accounted for by a Fixed Template-Matching Strategy (A) Fraction of random tripods classified as being the tripod by the rats (black) and by models (red) that were based on the classification images obtained from the full-body, regular-size random tripods (i.e., those shown in Figures 2D and 6A). Classification rates are reported for these full-body stimuli (left), as well as for their outlines (right) (examples shown at the top). Bars refer to group averages across the six rats ±SEM. Asterisks indicate a significant difference according to a one-tailed, paired t test (p < 0.05, ∗∗∗p < 0.001; ns, not significant). (B) Same as above, but with classification rates referring to the random tripods presented at the default, regular size (30°) and additional sizes—i.e., the whole size range, in the case of model predictions (red curve), and size 25°, in the case of rat responses (black dots). Dots refer to group averages across the six rats ±SEM. Same statistical analysis as in (A). See also Figure S4.
Figure 6
Figure 6
Transformation Tolerance of Rat Perceptual Strategies The classification images obtained, for the six rats, from (A) the regular-size (30°), full-body random tripods; (B) their outlines (top) and the filled-in versions of their outlines (bottom); and (C) the small-size (25°), full-body random tripods. Note that the classification images in (A) are those already shown in Figure 2D. See also Figures S5 and S6.

Comment in

Similar articles

Cited by

References

    1. Niell C.M. Cell types, circuits, and receptive fields in the mouse visual cortex. Annu. Rev. Neurosci. 2015;38:413–431. - PubMed
    1. Huberman A.D., Niell C.M. What can mice tell us about how vision works? Trends Neurosci. 2011;34:464–473. - PMC - PubMed
    1. Gavornik J.P., Bear M.F. Higher brain functions served by the lowly rodent primary visual cortex. Learn. Mem. 2014;21:527–533. - PMC - PubMed
    1. Glickfeld L.L., Reid R.C., Andermann M.L. A mouse model of higher visual cortical function. Curr. Opin. Neurobiol. 2014;24:28–33. - PMC - PubMed
    1. Carandini M., Churchland A.K. Probing perceptual decisions in rodents. Nat. Neurosci. 2013;16:824–831. - PMC - PubMed

Publication types

LinkOut - more resources