. 2018 Mar 2:9:262.
doi: 10.3389/fpls.2018.00262. eCollection 2018.

A Dehydration-Induced Eukaryotic Translation Initiation Factor iso4G Identified in a Slow Wilting Soybean Cultivar Enhances Abiotic Stress Tolerance in Arabidopsis

Affiliations

A Dehydration-Induced Eukaryotic Translation Initiation Factor iso4G Identified in a Slow Wilting Soybean Cultivar Enhances Abiotic Stress Tolerance in Arabidopsis

Juan P Gallino et al. Front Plant Sci. .

Abstract

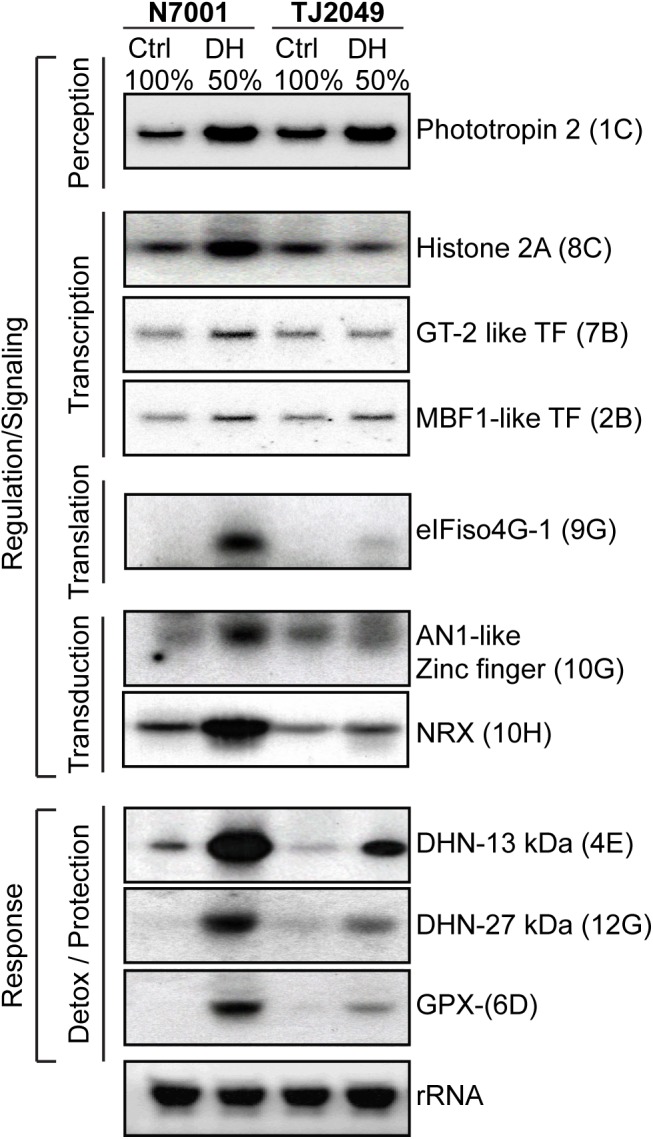
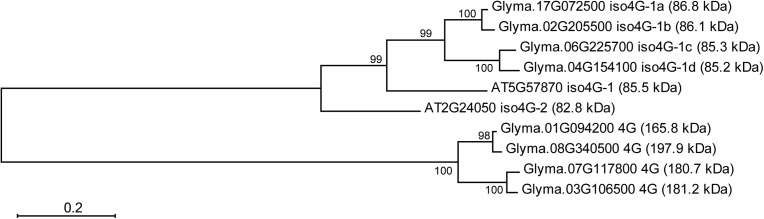
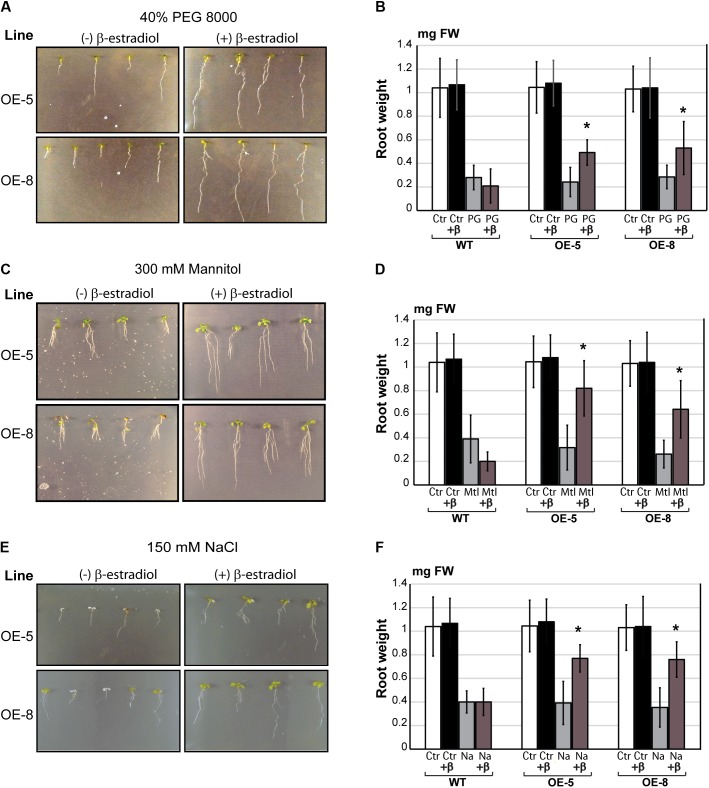
Water is usually the main limiting factor for soybean productivity worldwide and yet advances in genetic improvement for drought resistance in this crop are still limited. In the present study, we investigated the physiological and molecular responses to drought in two soybean contrasting genotypes, a slow wilting N7001 and a drought sensitive TJS2049 cultivars. Measurements of stomatal conductance, carbon isotope ratios and accumulated dry matter showed that N7001 responds to drought by employing mechanisms resulting in a more efficient water use than TJS2049. To provide an insight into the molecular mechanisms that these cultivars employ to deal with water stress, their early and late transcriptional responses to drought were analyzed by suppression subtractive hybridization. A number of differentially regulated genes from N7001 were identified and their expression pattern was compared between in this genotype and TJS2049. Overall, the data set indicated that N7001 responds to drought earlier than TJ2049 by up-regulating a larger number of genes, most of them encoding proteins with regulatory and signaling functions. The data supports the idea that at least some of the phenotypic differences between slow wilting and drought sensitive plants may rely on the regulation of the level and timing of expression of specific genes. One of the genes that exhibited a marked N7001-specific drought induction profile encoded a eukaryotic translation initiation factor iso4G (GmeIFiso4G-1a). GmeIFiso4G-1a is one of four members of this protein family in soybean, all of them sharing high sequence identity with each other. In silico analysis of GmeIFiso4G-1 promoter sequences suggested a possible functional specialization between distinct family members, which can attain differences at the transcriptional level. Conditional overexpression of GmeIFiso4G-1a in Arabidopsis conferred the transgenic plants increased tolerance to osmotic, salt, drought and low temperature stress, providing a strong experimental evidence for a direct association between a protein of this class and general abiotic stress tolerance mechanisms. Moreover, the results of this work reinforce the importance of the control of protein synthesis as a central mechanism of stress adaptation and opens up for new strategies for improving crop performance under stress.

Keywords: Arabidopsis; abiotic stress; drought; eIFiso4G; soybean; translation initiation.


Figures

FIGURE 1
FIGURE 1
Biochemical responses associated with drought stress status in soybean genotypes. Soybean genotypes: N7001 (N) and TJS2049 (TJ). (Ctrl): Control plants, daily irrigated at maximum field capacity (FC); (50% FC): moderate early dehydration stress; or (25% FC): severe late dehydration stress. (A) CAT activity; (B) proline levels; (C) APX activity in soybean genotypes, grown until V3 and subsequently subjected to moderate stress (3 days without irrigation, 50% FC); or severe dehydration stress (7 days without irrigation: 25% FC). CAT and APX activities are expressed in units per milligram of protein (U/mg). Proline concentration is expressed in nmol per milligram of protein (nmol/mg protein). The values shown are means from one representative technical replicate. Error bars indicate SD (n = 10). Three biological replicates were carried out. Significant differences of at least 0.05 confidence level between N7001 and TJS2049 soybean genotypes are marked by asterisks. (D) Appearance of SOD activity bands corresponding to different isoforms. Twenty μg of proteins were analyzed in native polyacrylamide gels using in-gel activity assays. (E) In situ determination of H2O2 and O2 by staining leaf disks with DAB or NBT, respectively. Neg, negative control for DAB staining. Images are the most representative of a pool of five leaf disks per plant/per treatment.
FIGURE 2
FIGURE 2
Distribution of library clones and their respective genes into functional categories. The proteins encoded by the N7001-SSH library genes were classified into different categories according to their biological function. In black, percentage of library clones encoding genes from each functional category. In gray, percentage of different genes (non-redundant), belonging to each functional category.
FIGURE 3
FIGURE 3
Genotype specific transcriptional responses. (A) Percentage of screened genes within each functional category, that were stress-induced in each genotype. Upregulation was determined based on the difference in hybridization signal intensities observed between forward and subtracted probes. Probes derived from N7001 (N) or TJS2049 (TJ) genotypes, at early stress (50% FC) or at late stress (25% FC). Forward subtracted: stress – control. Reverse subtracted: control – stress. (B) Percentage of upregulated genes in each soybean genotype, during the early stress response or the late stress response.
FIGURE 4
FIGURE 4
Analysis of overlapping and non-overlapping drought-induced genes in N7001 or TJ2049. Numbers and distribution into functional categories, of clones corresponding to upregulated genes in response to dehydration. (A) Moderate early stress (50% FC); (B) severe late stress 25% FC). Upregulated genes were selected based on their hybridization signal intensity with specific subtracted cDNA probes. Venn diagram analysis of differentially expressed gene sets indicating the total number of clones corresponding to overlapping and non-overlapping upregulated genes, during early (C) or late (D) drought stress. N (N7001), TJ (TJS2019).
FIGURE 5
FIGURE 5
Differential expression of selected genes in response to moderate drought stress in N7001 and TJS2049. Ten μg of total RNA from N7001 or TJS2049 genotypes were analyzed by Northern blot. Controls (Ctrl) correspond to samples from well-irrigated plants, and dehydration (DH) correspond to samples from drought stressed plants, taken when substrate reached a 50% of its water retention capacity (50% FC), usually 3 days after water withdrawal. Clone inserts corresponding to the selected genes were labeled with α 32P-dCTP and used as hybridization probes. Ethidium bromide staining of rRNA was used to ensure equal loading of RNA samples. The genes and their accession number used as probes are the following: Phototropin 2 (Glyma.08G264900); Histone 2A (Glyma.15G040400); eIFiso4G (Glyma.17G072500); MBF1-like transcription factor (Glyma.06G276200); GT-2 transcription factor (Glyma.10G225200); AN1-like Zinc finger (Glyma.13G341000); NRX (Glyma.06G021200); Dehydrin: DHN- 13 kDa (Glyma.19G114700); Dehydrin: DHN- 27 kDa (Glyma.09G185500); and Glutathione peroxidase: GPX (Glyma.01G219400). The coordinates showing the position of each clone in the dot blot array (Supplementary Figure S1) are marked in parenthesis.
FIGURE 6
FIGURE 6
Phylogenetic relationships between eIFiso4G deduced polypeptides of soybean and Arabidopsis. Full-length amino acid sequences were aligned by CLUSTAL W and the phylogenetic tree was constructed by the Maximum likelihood method using MEGA6 software. Numbers at branch nodes represent the confidence level of 500 bootstrap replications. The abbreviations of species are as follows: AT, Arabidopsis thaliana; Glyma, Glycine max. Gene ID, protein name and molecular weight (in kDa) of each sequence are shown to the right of the tree branches. Scale bar represents a distance of 0.2 substitutions per sequence position that occur along the length of the horizontal branches in the tree.
FIGURE 7
FIGURE 7
Effect of overexpression of GmeIFiso4G-1a on Arabidopsis growth under osmotic and salt stress. Five days old seedlings were transferred to high osmotic media: 40% PEG 8000 (A) or 300 mM mannitol (C), and to salt stress with NaCl 150 mM (E). Treatments and controls were performed in the presence (+β) or absence of 5 μM β-estradiol, and pictures were taken after 10 days of exposure to stress. Root weight (in mg of fresh weight) of wild-type (WT) and transgenic Arabidopsis lines (OE-5 and OE-8), was analyzed in after 10 days of PEG-induced osmotic stress (B); Mannitol-induced osmotic stress (D); or salt stress (F). Controls (Ctrl), 40% PEG 8000 (PG); 300 mM Mannitol (Mtl); 150 mM NaCl (Na). Plants were treated with 5 μM with β-estradiol (+β), or untreated. Asterisk () indicates significant differences between the transgenic lines and the wild type at p < 0.05 confidence level.
FIGURE 8
FIGURE 8
Effect of overexpression of GmeIFiso4G-1a on Arabidopsis plants exposed to dehydration or low temperature stress. Arabidopsis WT or transgenic GmeIFiso4G-1a overexpressing lines (OE-5 and OE-8), grown in non-sterile conditions, were analyzed in the presence (+β), or absence of β-estradiol treatment after dehydration or cold stress. (A) Arabidopsis seedlings were irrigated during 10 days with half strength MS medium. For dehydration stressed samples (DH), irrigation was interrupted almost completely, with the exception of the everyday addition of 200 μL of 5 μM β-estradiol or the same volume of water for non-treated samples. Control (well-watered) plants were treated (+β), or untreated with β-estradiol. Pictures were taken 9 days after the onset of stress. (B) Free proline content in well-watered controls (Ctrl) or 9 days dehydration stressed (DH) in the presence or absence of β-estradiol treatment. (C) Ten days old Arabidopsis plants were exposed to low temperature (4°C) for 2 weeks and photographed. Controls (plants grown at 22°C) and cold stressed plants (LT), treated with of 5 μM β-estradiol (+β), or untreated, were photographed 2 weeks after the onset of stress. (D) Anthocyanin content was determined in plants growing at 22°C (Ctrl) or exposed for 2 weeks to 4°C (LT), in the presence (+β) or absence of β-estradiol. Asterisk () indicates significant differences between the wild type and the transgenic lines at p < 0.05 confidence level.

Similar articles

Cited by

References

    1. Abe H., Urao T., Ito T., Seki M., Shinozaki K., Yamaguchi-Shinozaki K. (2003). Arabidopsis AtMYC2 (bHLH) and AtMYB2 (MYB) function as transcriptional activators in abscisic acid signaling. Plant Cell 15 63–78. 10.1105/tpc.006130 - DOI - PMC - PubMed
    1. Abdel-Haleem H., Lee G. J., Boerma R. H. (2011). Identification of QTL for increased fibrous roots in soybean. Theor. Appl. Genet. 122 935–946. 10.1007/s00122-010-1500-9 - DOI - PubMed
    1. Aebi H. (1984). Catalase in vitro. Methods Enzymol. 105 121–126. 10.1016/S0076-6879(84)05016-3 - DOI - PubMed
    1. Agarwal M., Hao Y., Kapoor A., Dong C. H., Fujii H., Zheng X., et al. (2006). A R2R3 type MYB transcription factor is involved in the cold regulation of CBF genes and in acquired freezing tolerance. J. Biol. Chem. 281 37636–37645. 10.1074/jbc.M605895200 - DOI - PubMed
    1. Antolín M. C., Yoller J., Sánchez-Díaz M. (1995). Effects of temporary drought on nitrate-fed and nitrogen-fixing alfalfa plants. Plant Sci. 107 k159–165. 10.1016/0168-9452(95)04108-7 - DOI

LinkOut - more resources