. 2018 Mar 2:9:53.
doi: 10.3389/fgene.2018.00053. eCollection 2018.

New Insights on Water Buffalo Genomic Diversity and Post-Domestication Migration Routes From Medium Density SNP Chip Data

Affiliations

New Insights on Water Buffalo Genomic Diversity and Post-Domestication Migration Routes From Medium Density SNP Chip Data

Licia Colli et al. Front Genet. .

Abstract

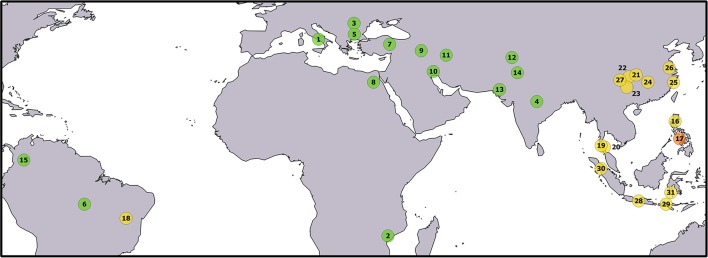
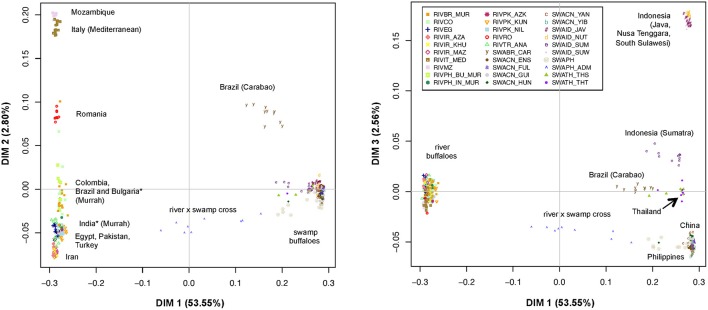
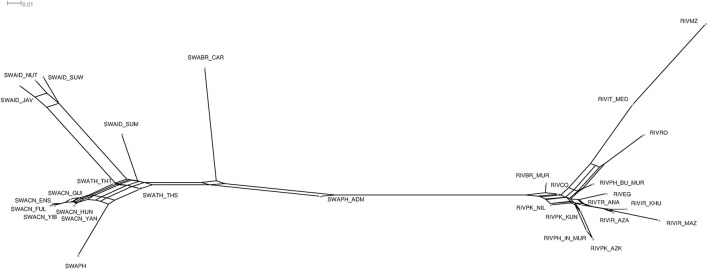
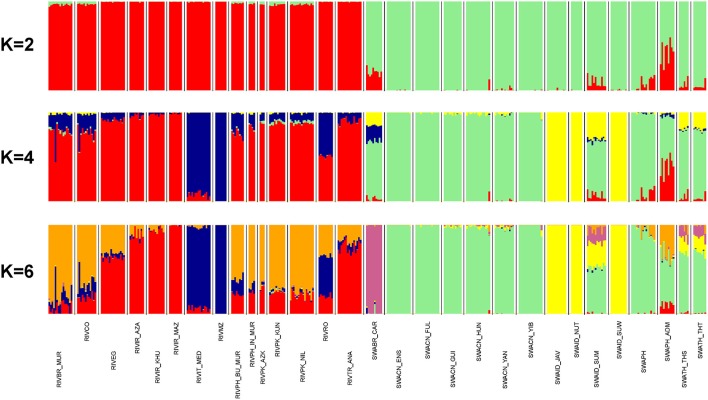
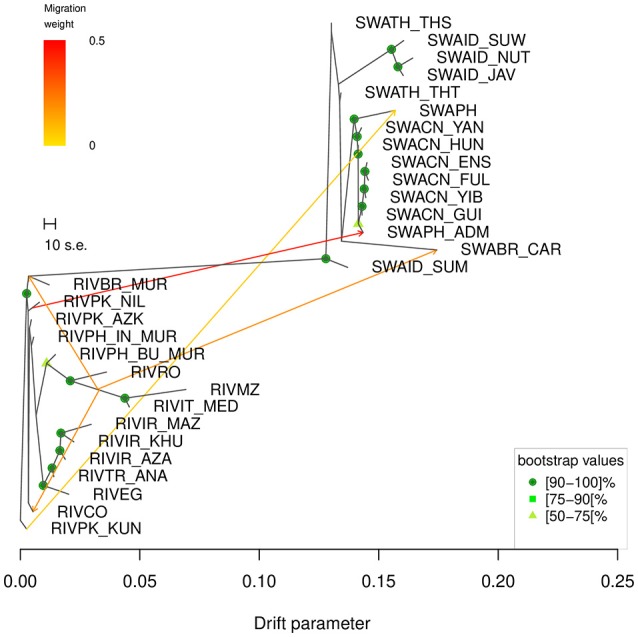
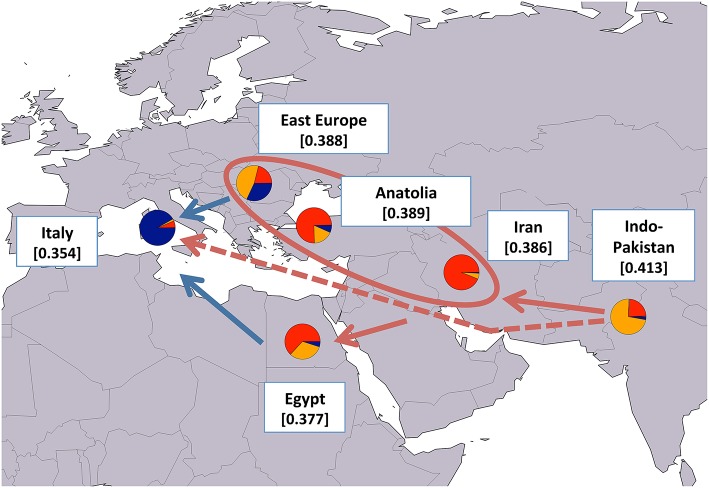
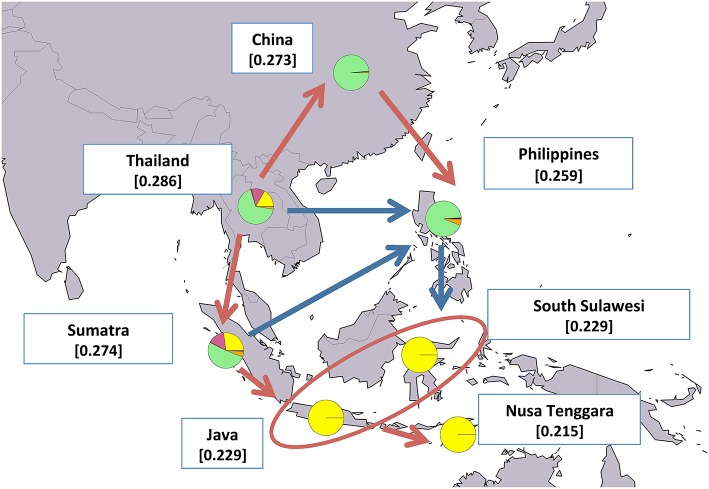
The domestic water buffalo is native to the Asian continent but through historical migrations and recent importations, nowadays has a worldwide distribution. The two types of water buffalo, i.e., river and swamp, display distinct morphological and behavioral traits, different karyotypes and also have different purposes and geographical distributions. River buffaloes from Pakistan, Iran, Turkey, Egypt, Romania, Bulgaria, Italy, Mozambique, Brazil and Colombia, and swamp buffaloes from China, Thailand, Philippines, Indonesia and Brazil were genotyped with a species-specific medium-density 90K SNP panel. We estimated the levels of molecular diversity and described population structure, which revealed historical relationships between populations and migration events. Three distinct gene pools were identified in pure river as well as in pure swamp buffalo populations. Genomic admixture was seen in the Philippines and in Brazil, resulting from importations of animals for breed improvement. Our results were largely consistent with previous archeological, historical and molecular-based evidence for two independent domestication events for river- and swamp-type buffaloes, which occurred in the Indo-Pakistani region and close to the China/Indochina border, respectively. Based on a geographical analysis of the distribution of diversity, our evidence also indicated that the water buffalo spread out of the domestication centers followed two major divergent migration directions: river buffaloes migrated west from the Indian sub-continent while swamp buffaloes migrated from northern Indochina via an east-south-eastern route. These data suggest that the current distribution of water buffalo diversity has been shaped by the combined effects of multiple migration events occurred at different stages of the post-domestication history of the species.

Keywords: Bubalus bubalis; SNP; domestication; evolutionary history; genomic diversity; river buffalo; swamp buffalo.


Figures

Figure 1
Figure 1
Geographical origin of the sampled populations. The correspondence between numbers and populations is given in Table 1. The color of the circles identifies buffalo populations as follows: green—river buffalo; yellow—swamp buffalo; orange—admixed river x swamp buffalo. Underlying map from the GSHHG database, ftp://ftp.soest.hawaii.edu/gshhg.
Figure 2
Figure 2
Multi-Dimensional Scaling plot of dimension 1 vs. 2 (Left) and 1 vs. 3 (Right). The percentages of variance explained by each dimension are reported into brackets. The individuals of different populations are labeled according to the legend. *Populations of Indian and Bulgarian origin reared in the Philippines.
Figure 3
Figure 3
Neighbor-network based on the matrix of Reynolds genetic distances between populations.
Figure 4
Figure 4
From top to bottom, barplots of ADMIXTURE software results at K = 2, 4, and 6 (best fitting solution). Individuals are represented by thin vertical colored bars. Populations are separated by white spaces and vertical black lines. Each genomic component is assigned with a unique color.
Figure 5
Figure 5
TreeMix graph corresponding to the 5 migrations scenario (m5). The robustness of the nodes calculated over 100 bootstrap replicates is indicated by colored dots according to the following key: dark green = 90–100, medium green = 75–89, light green = 50–74. Bootstrap values < 50 are not shown. The corresponding heat map of the residuals is shown in Supplementary Figure 7.
Figure 6
Figure 6
Map showing average expected heterozygosity values calculated after grouping river buffalo populations according to the geographical area of origin: “east Europe” = RIVPH_BU_MUR and RIVRO; “Indo-Pakistan” = RIVPH_IN_MUR, RIVPK_AZK, RIVPK_KUN, and RIVPK_NIL; “Iran” = RIVIR_AZA, RIVIR_KHU, and RIVIR_MAZ. Populations from Anatolia, Egypt, and Italy were considered as separate entities. For each area the average membership coefficients corresponding to the results of ADMIXTURE software at K = 6 are also shown. The solid arrows (blue and red) indicate the direction of significant decreases in expected heterozygosity between adjacent areas (sensu Skrbinšek et al., . See Supplementary Materials for further details), while the oval encloses areas for which differences in heterozygosity were not significant. Red arrows, in particular, correspond to the most likely post-domestication migration routes according to the joint evidence derived from (i) the present study, (ii) previous molecular-based research, and (iii) historical-archeological sources. The dashed arrow indicates an early and independent migration route that might have led river buffaloes into Europe. Underlying map from the GSHHG database, ftp://ftp.soest.hawaii.edu/gshhg.
Figure 7
Figure 7
Map showing average expected heterozygosity values calculated after grouping swamp populations according to the geographical area of origin: “China” = SWACN_ENS, SWACN_FUL, SWACN_GUI, SWACN_HUN, SWACN_YAB, and SWACN_YIB; “Thailand” = SWATH_THS and SWATH_THT. Populations from the Philippines and the Indonesian islands were considered as separate entities. For each area the average membership coefficients corresponding to the results of ADMIXTURE software at K=6 are also shown. The solid arrows (blue and red) indicate the direction of significant decreases in expected heterozygosity between adjacent areas (sensu Skrbinšek et al., . See Supplementary Materials for further details), while the oval encloses areas for which differences in heterozygosity were not significant. Red arrows, in particular, correspond to the most likely post-domestication migration routes according to the joint evidence derived from (i) the present study, (ii) previous molecular-based research, and (iii) historical-archeological sources. Underlying map from the GSHHG database, ftp://ftp.soest.hawaii.edu/gshhg.

References

    1. Alexander D. H., Novembre J., Lange K. (2009). Fast model-based estimation of ancestry in unrelated individuals. Genome Res. 19, 1655–1664. 10.1101/gr.094052.109 - DOI - PMC - PubMed
    1. Aulchenko Y. S., Ripke S., Isaacs A., van Duijn C. M. (2007). GenABEL: an R package for genome-wide association analysis. Bioinformatics 23, 1294–1296. 10.1093/bioinformatics/btm108 - DOI - PubMed
    1. Barker J. S., Moore S. S., Hetzel D. J. S., Evans D., Byrne K. (1997). Genetic diversity of Asian water buffalo (Bubalus bubalis): microsatellite variation and a comparison with protein-coding loci. Anim. Genet. 28, 103–115. 10.1111/j.1365-2052.1997.00085.x - DOI - PubMed
    1. Beja-Pereira A., England P. R., Ferrand N., Jordan S., Bakhiet A. O., Abdalla M. A., et al. . (2004). African origins of the domestic donkey. Science 304, 1781–1781. 10.1126/science.1096008 - DOI - PubMed
    1. Bökönyi S. (1974). History of Domestic Mammals in Central and Eastern Europe. Budapest: Akadémiai Kiadó.