. 2018 Mar 2:5:9.
doi: 10.3389/fmolb.2018.00009. eCollection 2018.

Independent Evolution of Strychnine Recognition by Bitter Taste Receptor Subtypes

Affiliations

Independent Evolution of Strychnine Recognition by Bitter Taste Receptor Subtypes

Ava Yuan Xue et al. Front Mol Biosci. .

Erratum in

Abstract

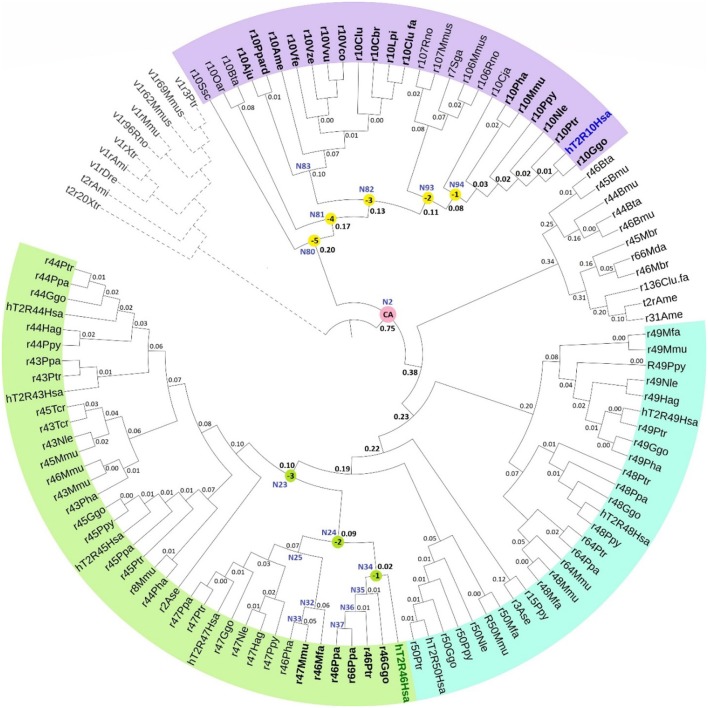
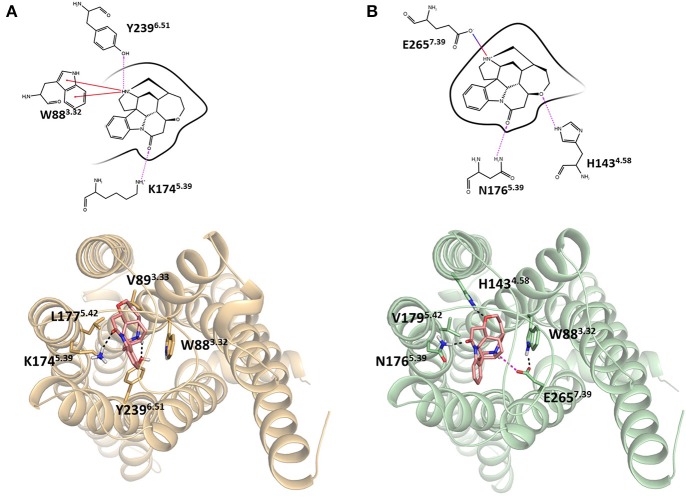
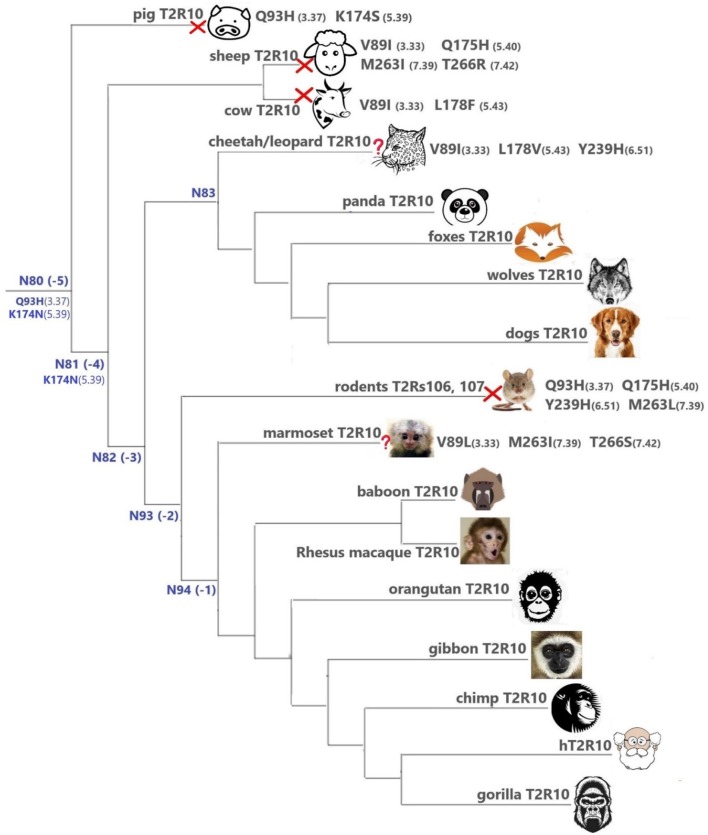
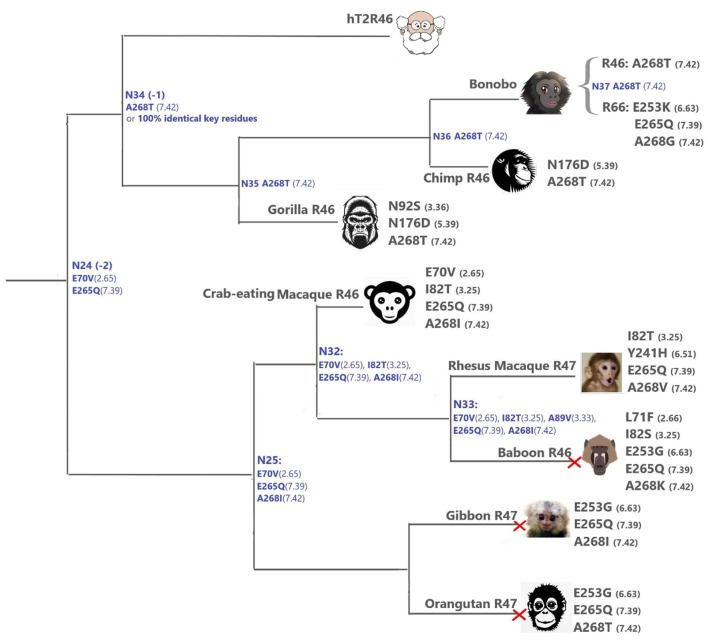
The 25 human bitter taste receptors (hT2Rs) recognize thousands of structurally and chemically diverse bitter substances. The binding modes of human bitter taste receptors hT2R10 and hT2R46, which are responsible for strychnine recognition, were previously established using site-directed mutagenesis, functional assays, and molecular modeling. Here we construct a phylogenetic tree and reconstruct ancestral sequences of the T2R10 and T2R46 clades. We next analyze the binding sites in view of experimental data to predict their ability to recognize strychnine. This analysis suggests that the common ancestor of hT2R10 and hT2R46 is unlikely to bind strychnine in the same mode as either of its two descendants. Estimation of relative divergence times shows that hT2R10 evolved earlier than hT2R46. Strychnine recognition was likely acquired first by the earliest common ancestor of the T2R10 clade before the separation of primates from other mammals, and was highly conserved within the clade. It was probably independently acquired by the common ancestor of T2R43-47 before the homo-ape speciation, lost in most T2Rs within this clade, but enhanced in the hT2R46 after humans diverged from the rest of primates. Our findings suggest hypothetical strychnine T2R receptors in several species, and serve as an experimental guide for further study. Improved understanding of how bitter taste receptors acquire the ability to be activated by particular ligands is valuable for the development of sensors for bitterness and for potential toxicity.

Keywords: ancestor functionality; ancestral reconstruction; bitter taste receptor; evolution; functional residues; homology modeling; ligand recognition; phylogenetics.


Figures

Figure 1
Figure 1
Phylogeny with reconstructed common ancestors and estimated relative divergence times. Divergence times are displayed near the corresponding nodes. Color ranges: purple, sequences having >60% identity with hT2R10; cyan, sequences having >65% identity with hT2R46; green, sequences having >80% identity with hT2R46. Yellow dots: N94 (−1) through N80 (−5), the five most recent common ancestor of hT2R10 clade, with N94 (−1) being the most recent and N80 (−5) the earliest. Green dots: common ancestors N34 (−1), N24 (−2), and N23 (−3) in the hT2R46 clade. Pink dot: N2, the common ancestor of hT2R10 and hT2R46. N83: the common ancestor of canidae (Vfe, Vze, Vvu, Vco, Clu, Cbr, Lpi, Clu.fa) and felidae (Ppard, Aju). N35-N37: the common ancestors of gorilla (Ggo) T2R46, chimp (Ptr) T2R46, and bonobo (Ppa) T2R46 and T2R66, respectively. N32-N33: common ancestor of Rhesus macaque (Mmu) T2R47, Hamadryas baboon (Pha) T2R46 and crab-eating macaque (Mfa) T2R46, and common ancestor of the first two, respectively. N25: common ancestor of primate T2R47, the closest sister clade of T2R46. Outgroup clade in gray dashed lines. Tree was constructed using iTOL tool (Letunic and Bork, 2016). The original RelTime tree constructed in MEGA7 (Kumar et al., 2016) is shown in Supplementary 3, Figure S1.
Figure 2
Figure 2
Homology models of (A) hT2R10 and (B) hT2R46 with strychnine docked into the putative orthosteric binding sites. Docking scores, used as an approximation of binding affinity, are of −9.619 kcal/mol for hT2R46/strychnine complex and of −7.949 kcal/mol for hT2R10/strychnine complex. Indeed, hT2R46 is more sensitive to strychnine respect to hT2R10. 2D diagrams depicting the predicted ligand interactions with binding site residues are shown in top panels. Hydrogen bonds are shown as magenta dashed lines, cation-π interactions as red lines, salt-bridge as blue-red lines. Bottom panels present extracellular views of the orthosteric binding sites, with strychnine shown as sticks with pink carbons, and residues interacting with strychnine shown as tan (hT2R10) or light green (hT2R46) sticks. Hydrogen bonds are shown as black dashed lines, salt-bridge as magenta dashed lines. Figure was created using the Ligand Interaction Diagram available in Maestro (2D) and Pymol (3D).
Figure 3
Figure 3
T2Rs that are the most hT2R10-similar; the majority have 100% identical key residues for strychnine recognition and therefore are predicted as strychnine binders; a predicted non-binder is marked with a red cross next to it and an uncertain prediction with a question mark. Variations of key residues are listed next to the species. Common ancestors within the T2R10 clade in Figure 1 are also presented here in blue with predicted key residue variations. Baboon image created by © Kenneth Chiou, in “Population genomics of a baboon hybrid zone in Zambia”, http://kennychiou.com/dissertation/#species.
Figure 4
Figure 4
T2Rs that are the most hT2R46-similar, the majority of which are predicted to recognize strychnine, probably with largely reduced sensitivity compared to human; a predicted non-binder is marked with red cross next to it. Variations of key residues are listed next to the species. Most of the common ancestors within the hT2R46 and nearby clades in Figure 1 are also presented here in blue with predicted key residue variations (see “T2R46 Clade Predicted Common Ancestors”). Baboon image created by © Kenneth Chiou, in “Population genomics of a baboon hybrid zone in Zambia”, http://kennychiou.com/dissertation/#species.
Figure 5
Figure 5
Conservation of position A2687.42 from different ingroup (IG) samplings, generated based on the 100 most likely ancestral sequences of hT2R46 by using FastML (Ashkenazy et al., 2012). Orange rectangles: IG with 55% identity cutoff; blue rectangles: enlarged IG with 45% identity cutoff. Height of amino acid symbols is proportional to their relative frequency at that position.

Similar articles

Cited by

References

    1. Adler E., Hoon M. A., Mueller K. L., Chandrashekar J., Ryba N. J. P., Zuker C. S. (2000). A novel family of mammalian taste receptors. Cell 100, 693–702. 10.1016/S0092-8674(00)80705-9 - DOI - PubMed
    1. Ashkenazy H., Penn O., Doron-Faigenboim A., Cohen O., Cannarozzi G., Zomer O., et al. . (2012). FastML: a web server for probabilistic reconstruction of ancestral sequences. Nucleic Acids Res. 40, W580–W584. 10.1093/nar/gks498 - DOI - PMC - PubMed
    1. Avau B., Rotondo A., Thijs T., Andrews C. N., Janssen P., Tack J., et al. . (2015). Targeting extra-oral bitter taste receptors modulates gastrointestinal motility with effects on satiation. Sci. Rep. 5:15985. 10.1038/srep15985 - DOI - PMC - PubMed
    1. Bachmanov A. A., Bosak N. P., Lin C., Matsumoto I., Ohmoto M., Reed D. R., et al. . (2014). Genetics of taste receptors. Curr. Pharm. Des. 20, 2669–2683. 10.2174/13816128113199990566 - DOI - PMC - PubMed
    1. Ballesteros J. A., Weinstein H. (1995). Integrated methods for the construction of three-dimensional models and computational probing of structure-function relations in G protein-coupled receptors. Methods Neurosci. 25, 366–428. 10.1016/S1043-9471(05)80049-7 - DOI