. 2017 Dec 13;5(3):367-398.
doi: 10.1016/j.jcmgh.2017.11.016. eCollection 2018 Mar.

Experimental Nonalcoholic Steatohepatitis and Liver Fibrosis Are Ameliorated by Pharmacologic Activation of Nrf2 (NF-E2 p45-Related Factor 2)

Affiliations

Experimental Nonalcoholic Steatohepatitis and Liver Fibrosis Are Ameliorated by Pharmacologic Activation of Nrf2 (NF-E2 p45-Related Factor 2)

Ritu S Sharma et al. Cell Mol Gastroenterol Hepatol. .

Abstract

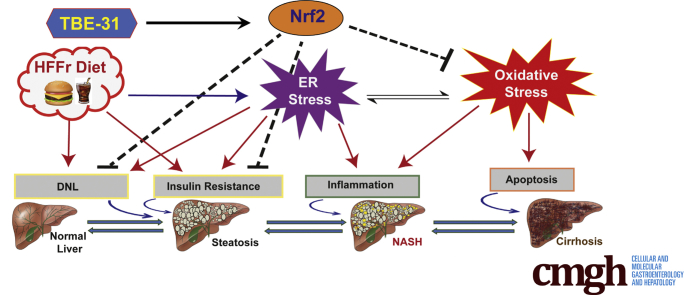
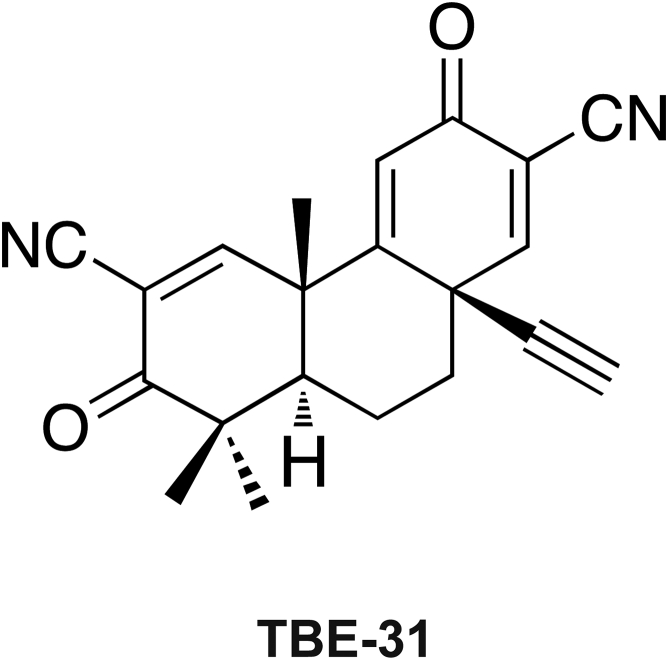
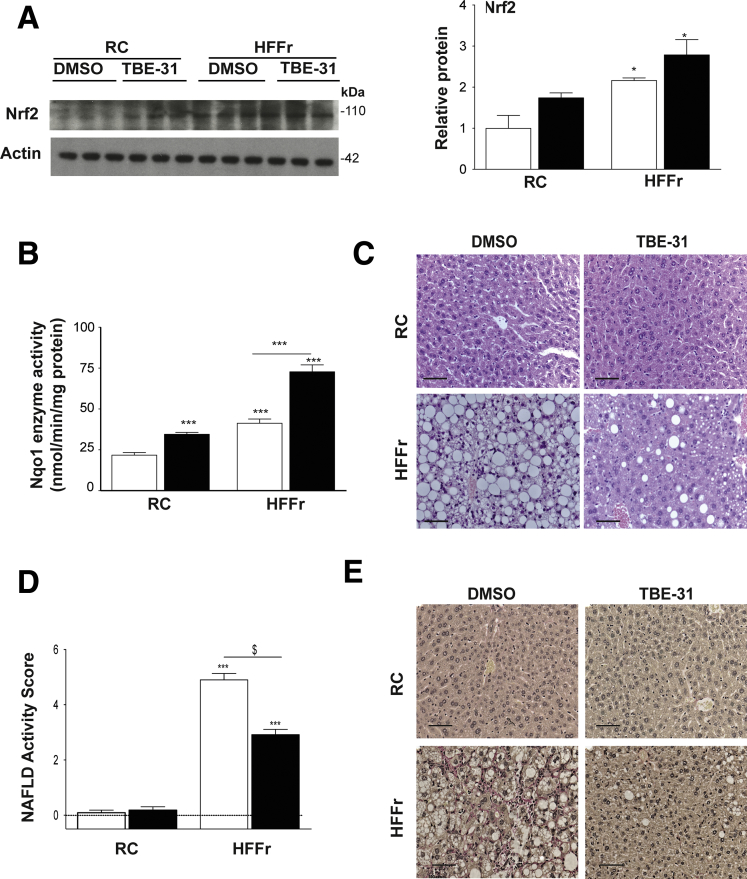
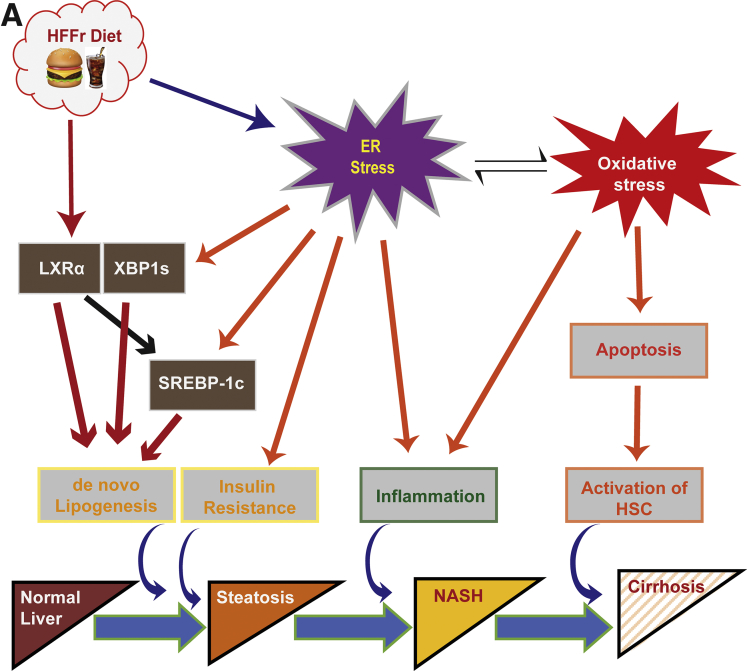
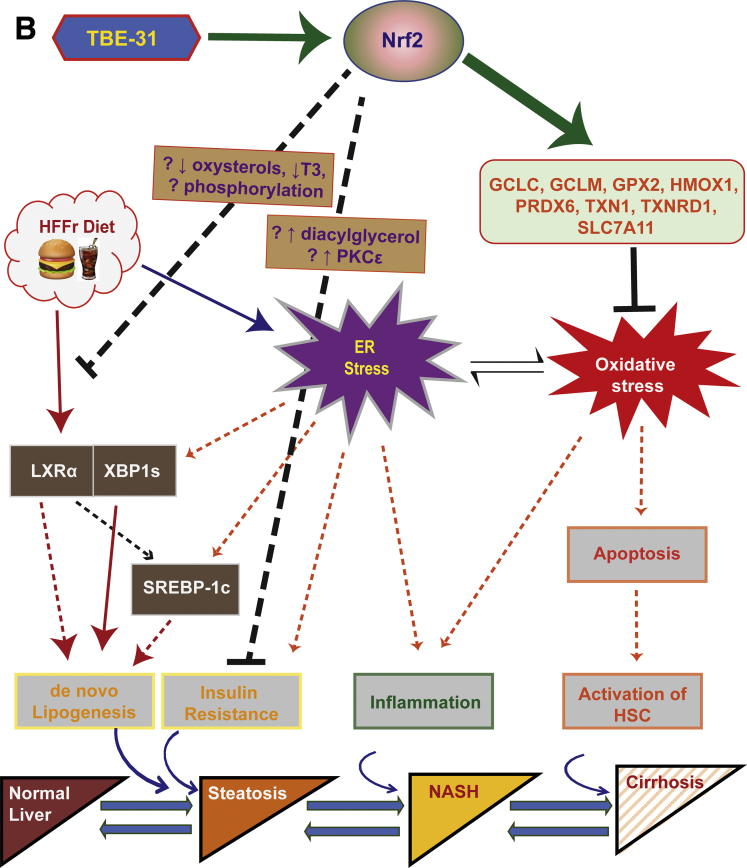
Background & aims: Nonalcoholic steatohepatitis (NASH) is associated with oxidative stress. We surmised that pharmacologic activation of NF-E2 p45-related factor 2 (Nrf2) using the acetylenic tricyclic bis(cyano enone) TBE-31 would suppress NASH because Nrf2 is a transcriptional master regulator of intracellular redox homeostasis.

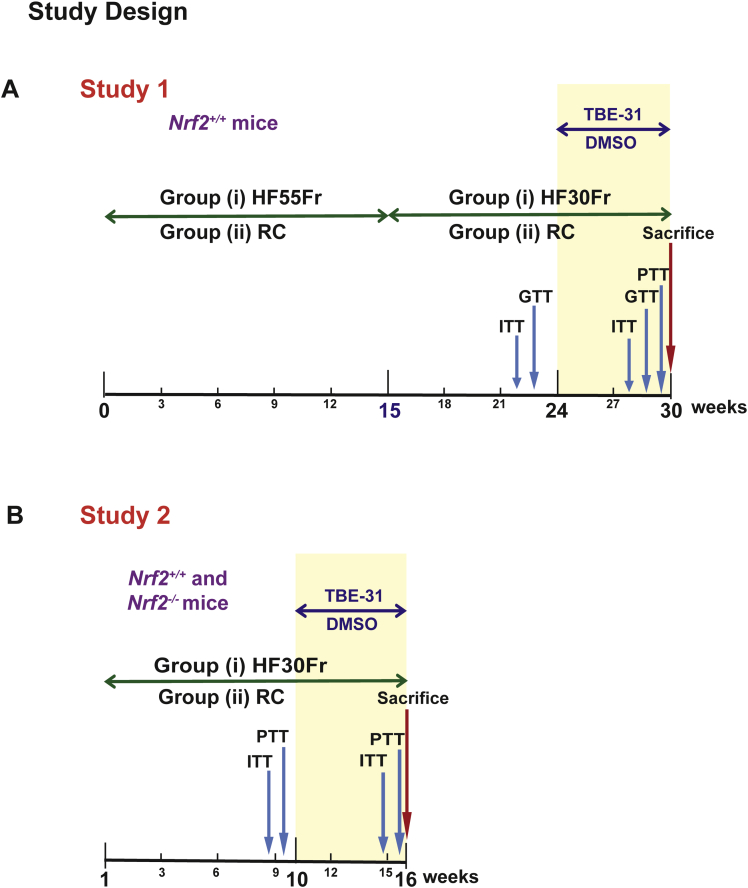
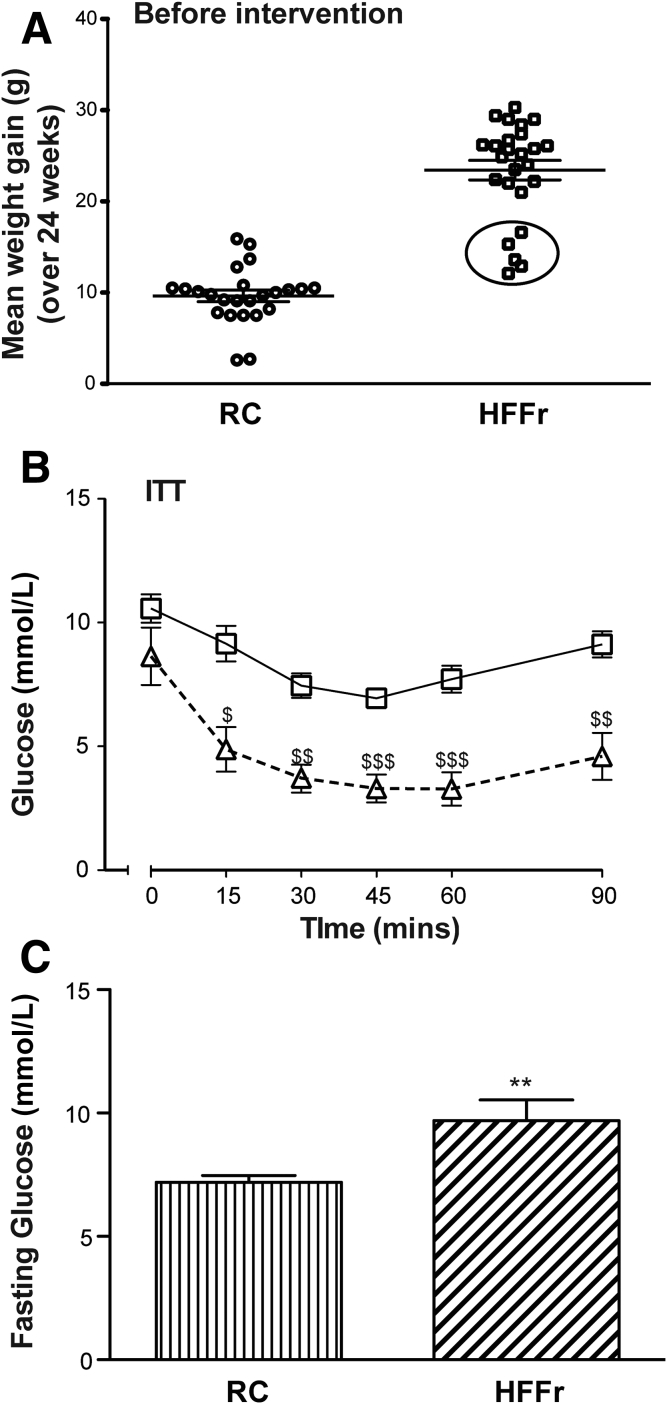
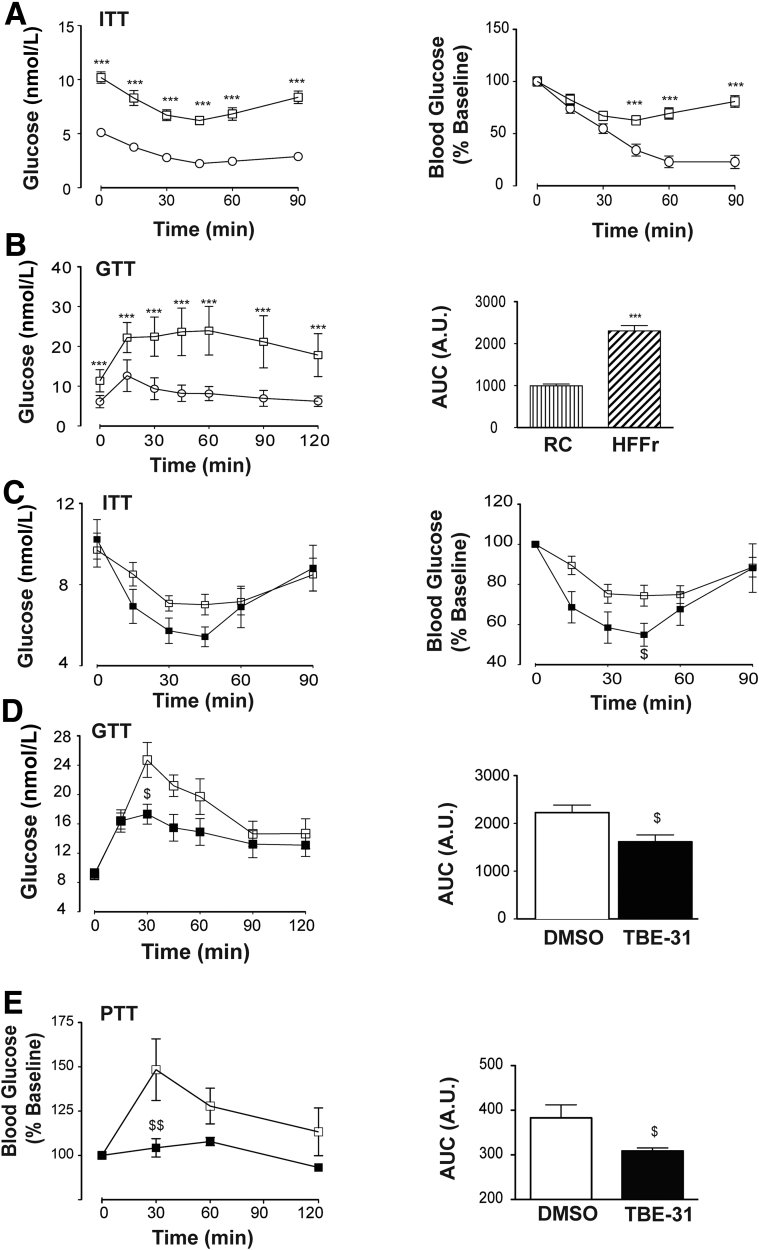
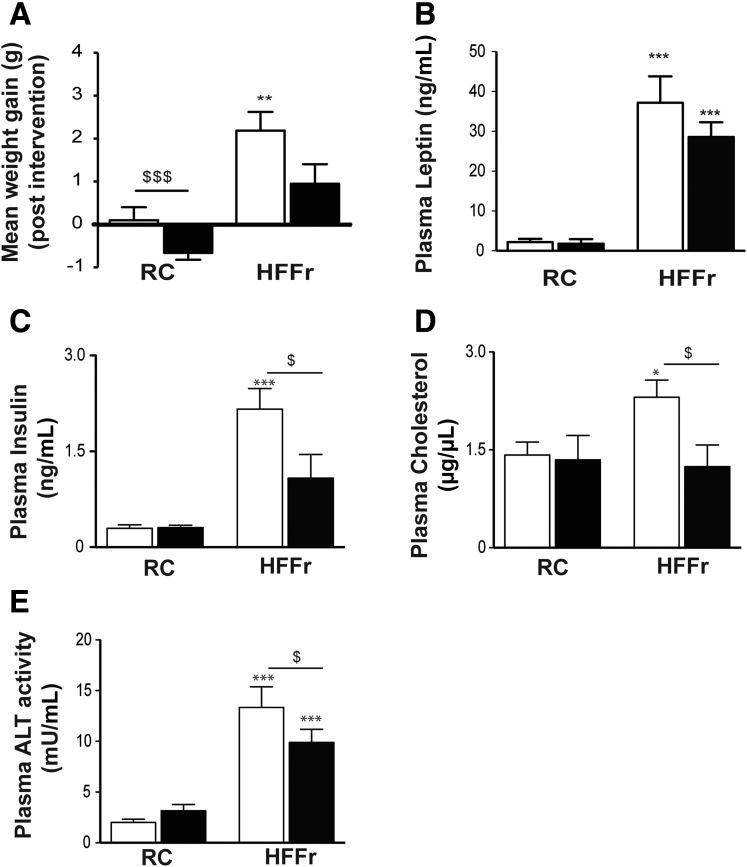
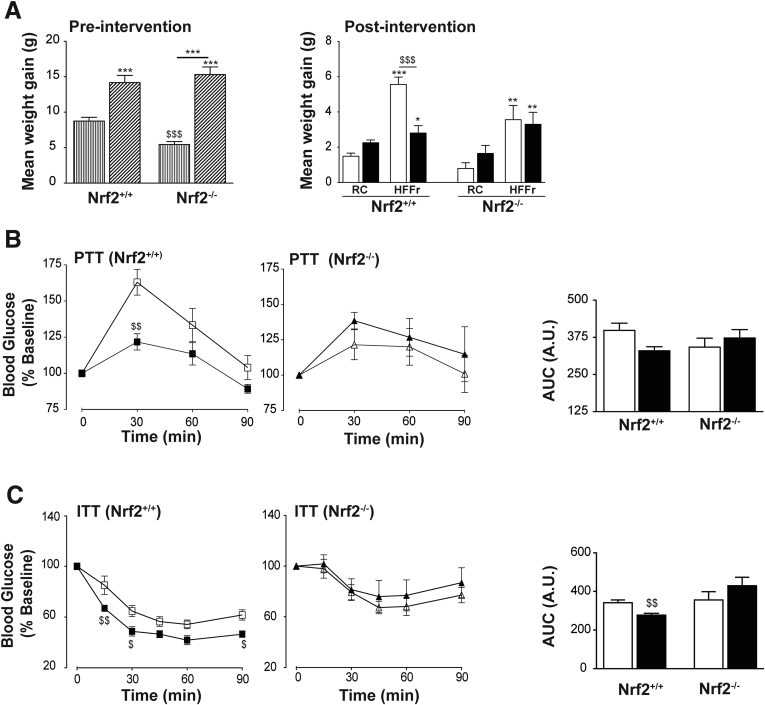
Methods: Nrf2+/+ and Nrf2-/- C57BL/6 mice were fed a high-fat plus fructose (HFFr) or regular chow diet for 16 weeks or 30 weeks, and then treated for the final 6 weeks, while still being fed the same HFFr or regular chow diets, with either TBE-31 or dimethyl sulfoxide vehicle control. Measures of whole-body glucose homeostasis, histologic assessment of liver, and biochemical and molecular measurements of steatosis, endoplasmic reticulum (ER) stress, inflammation, apoptosis, fibrosis, and oxidative stress were performed in livers from these animals.

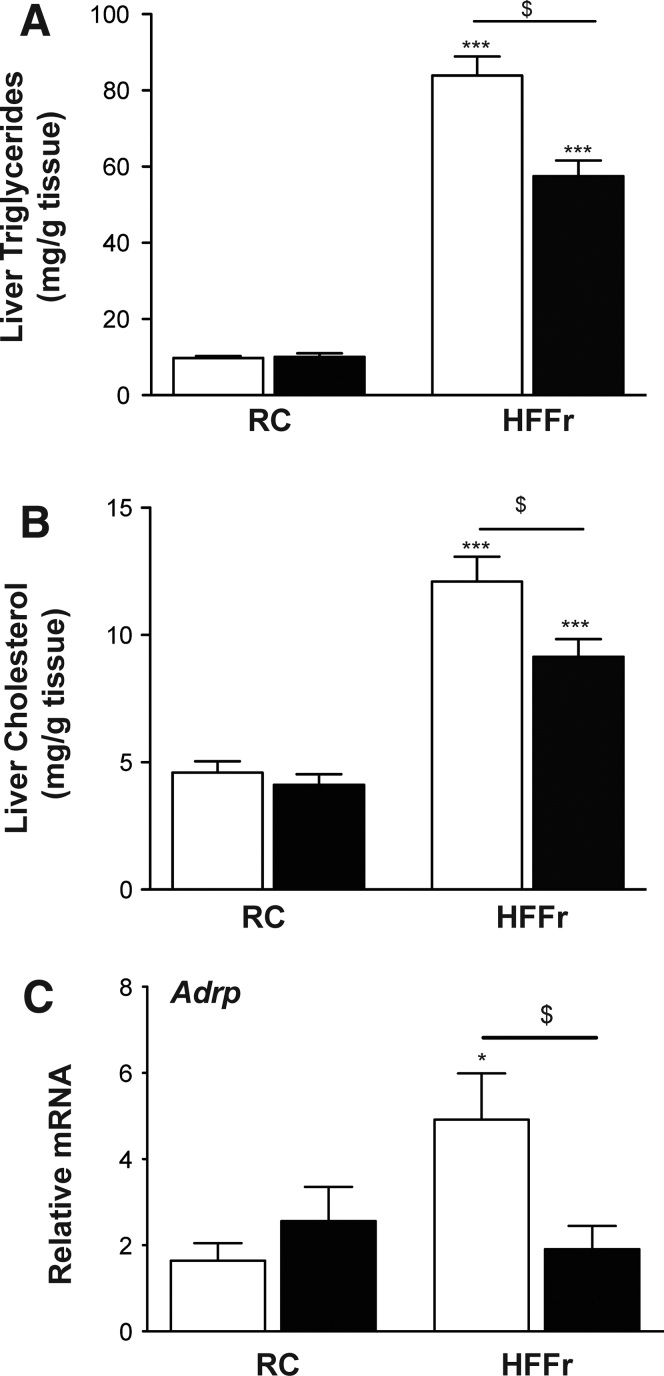
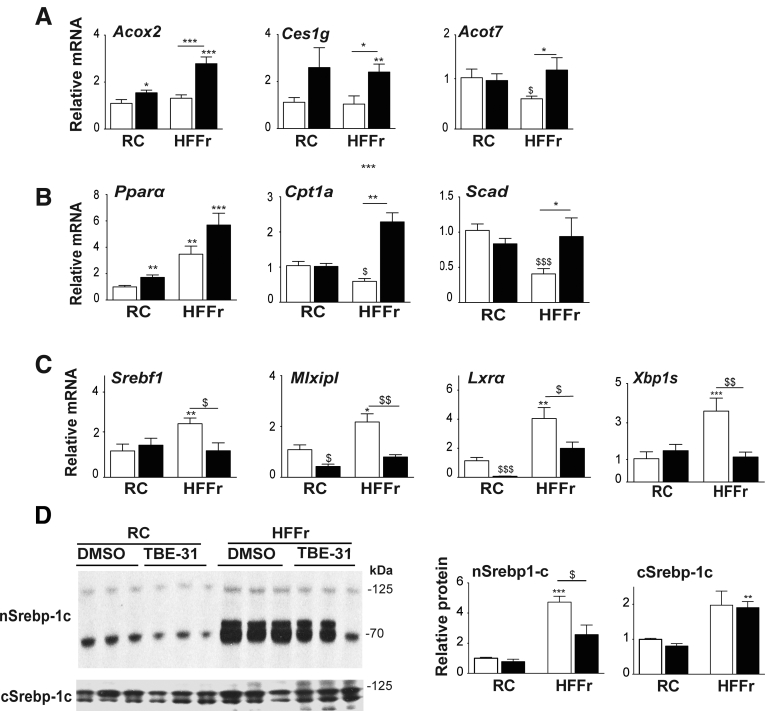
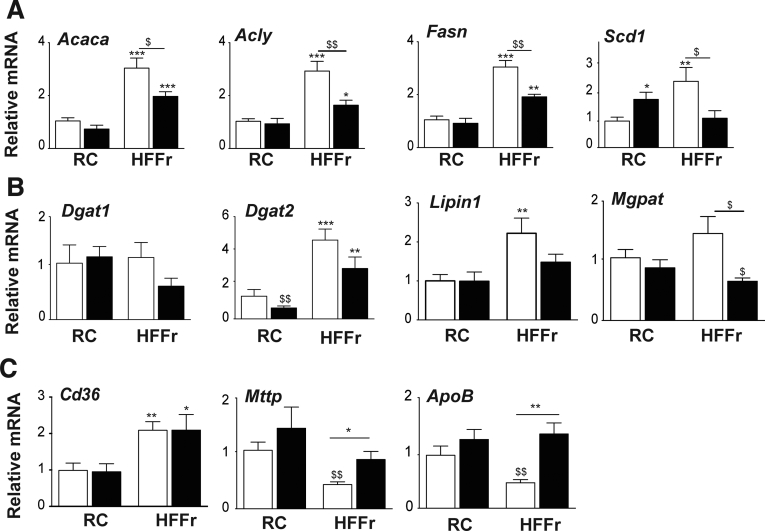
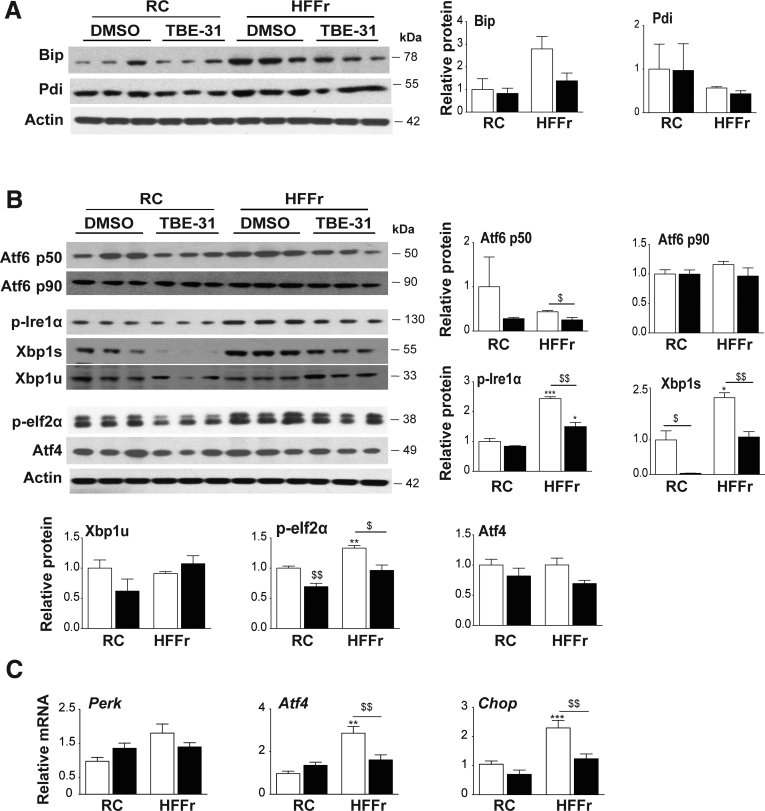
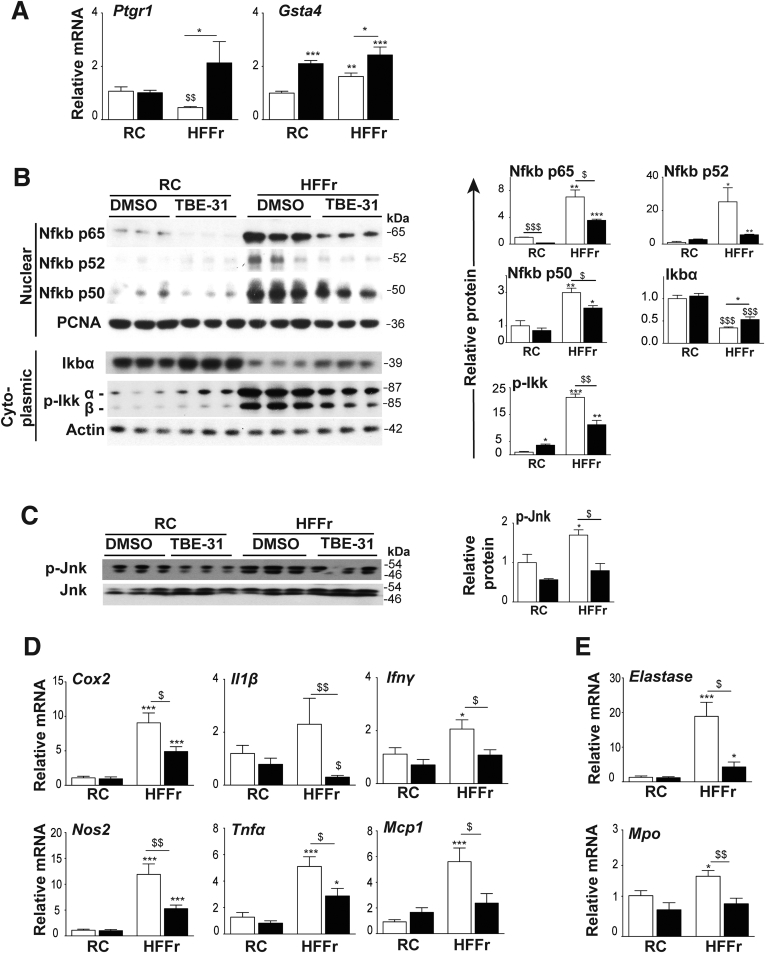
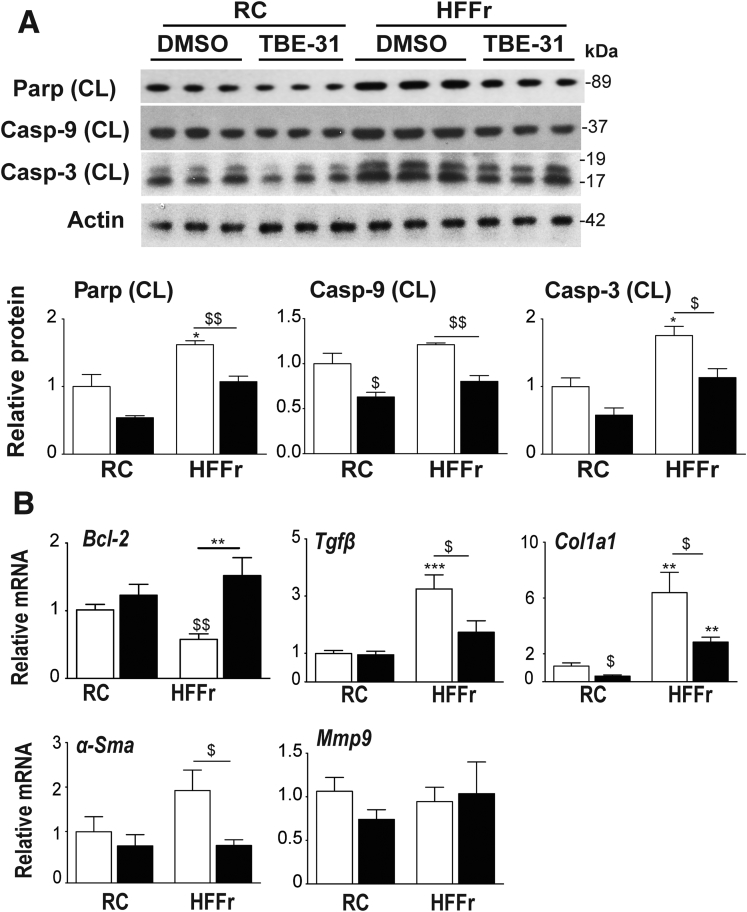
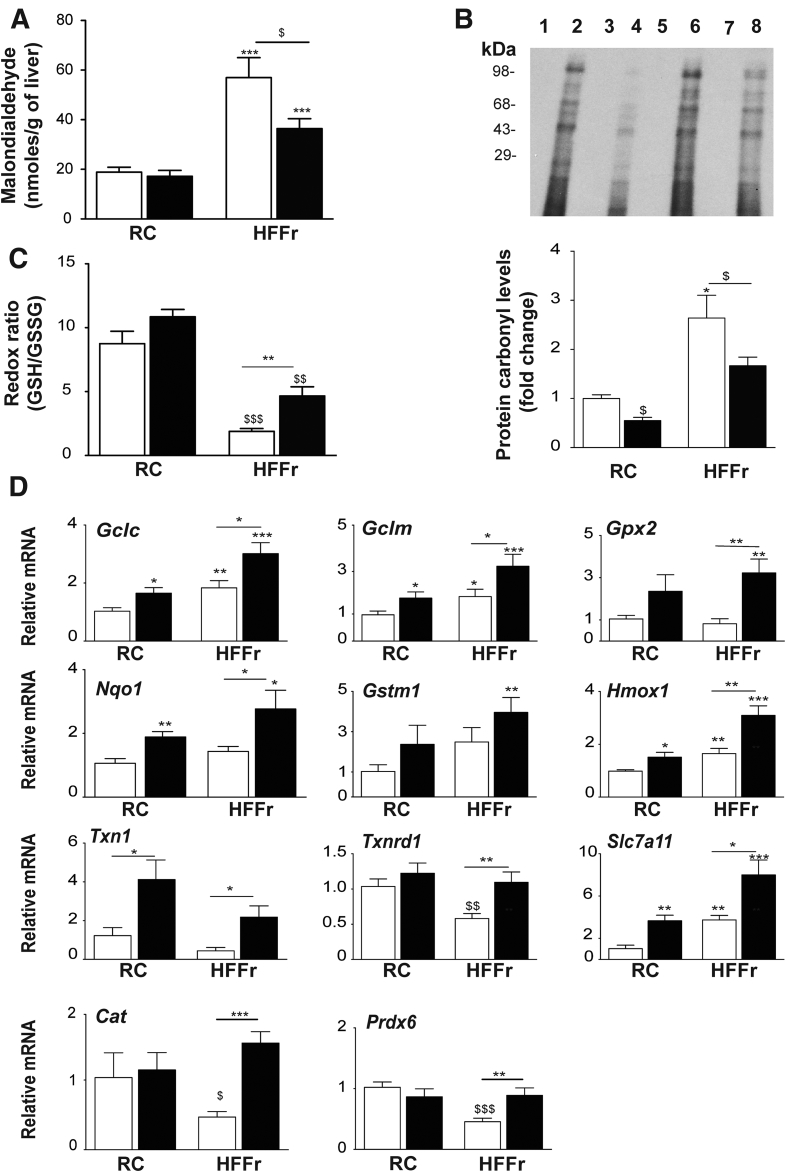
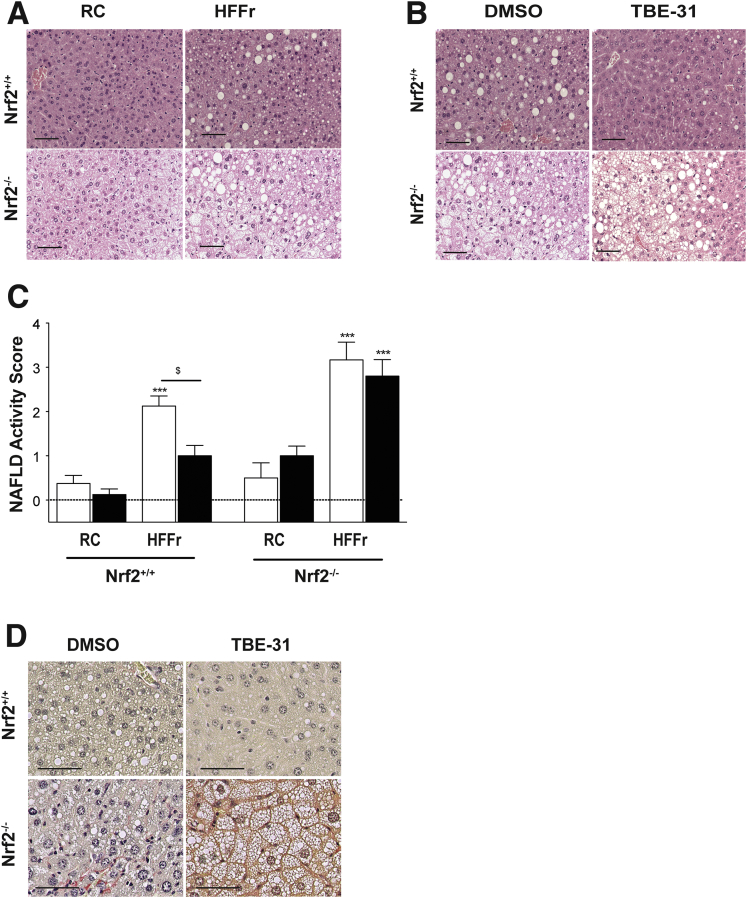
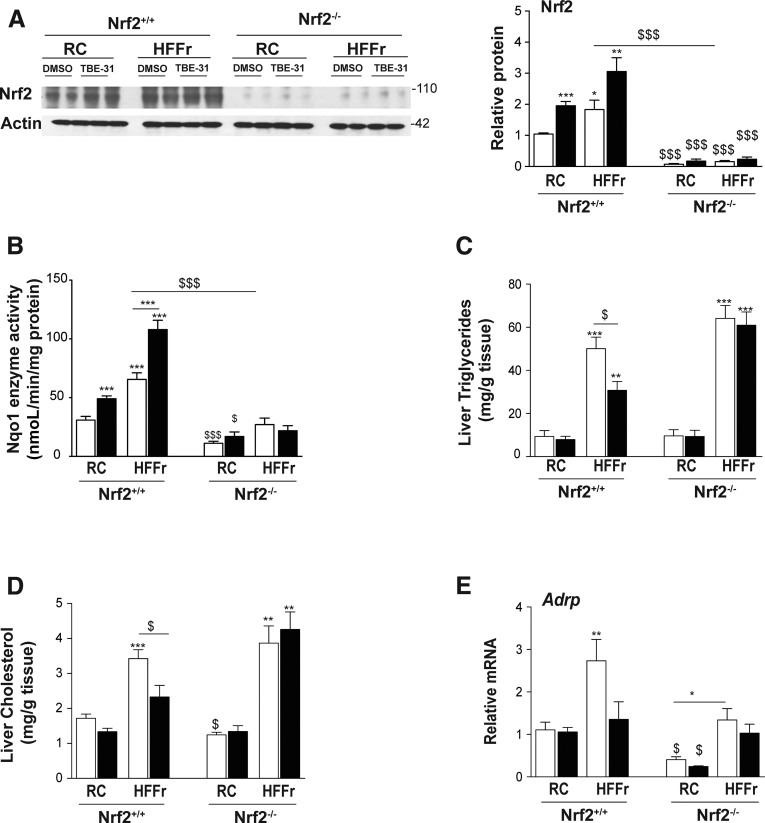
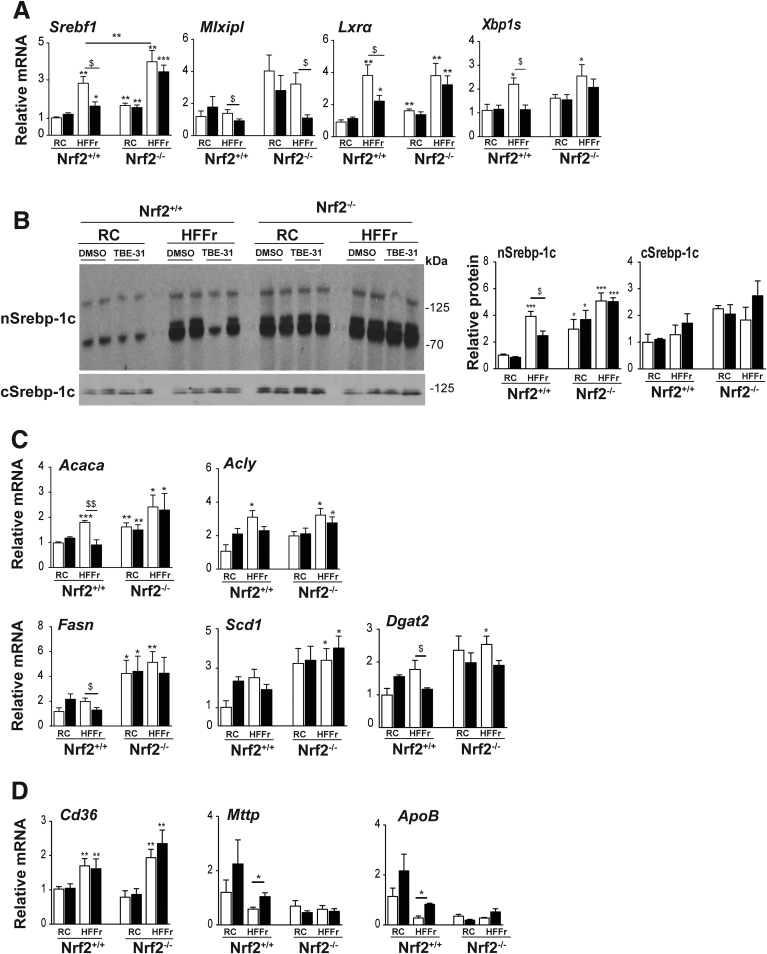
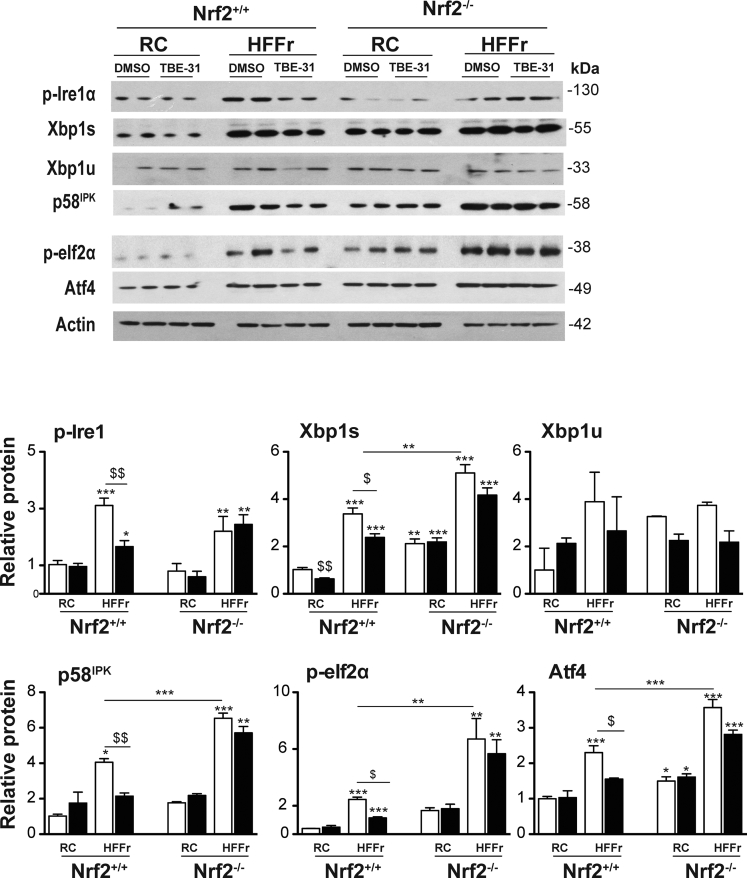
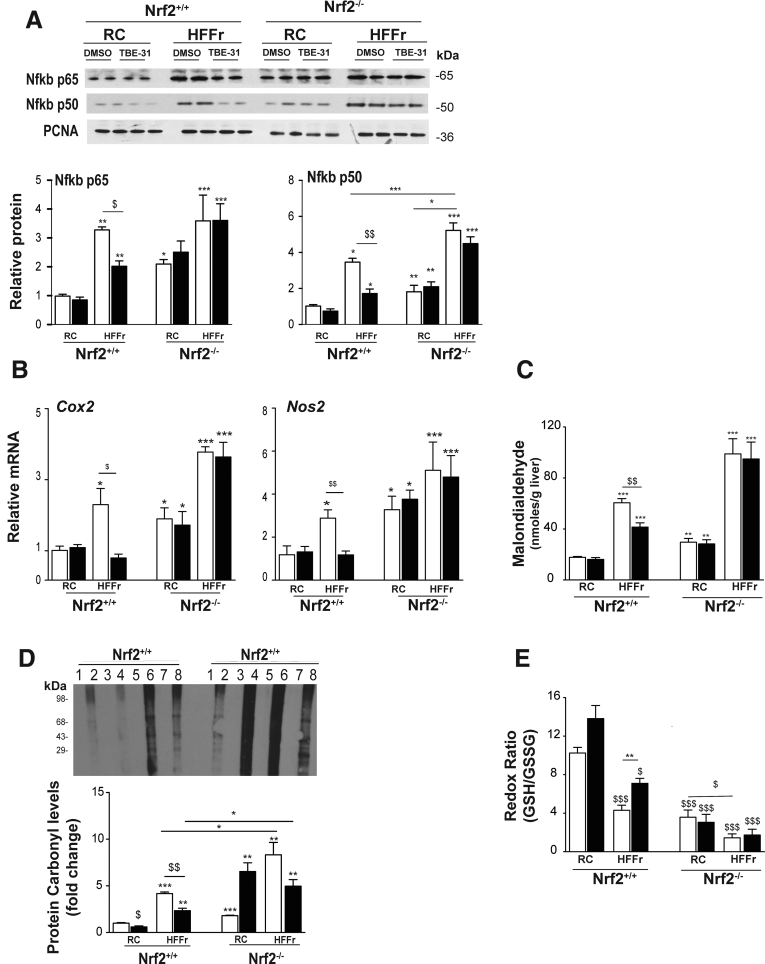
Results: TBE-31 treatment reversed insulin resistance in HFFr-fed wild-type mice, but not in HFFr-fed Nrf2-null mice. TBE-31 treatment of HFFr-fed wild-type mice substantially decreased liver steatosis and expression of lipid synthesis genes, while increasing hepatic expression of fatty acid oxidation and lipoprotein assembly genes. Also, TBE-31 treatment decreased ER stress, expression of inflammation genes, and markers of apoptosis, fibrosis, and oxidative stress in the livers of HFFr-fed wild-type mice. By comparison, TBE-31 did not decrease steatosis, ER stress, lipogenesis, inflammation, fibrosis, or oxidative stress in livers of HFFr-fed Nrf2-null mice.

Conclusions: Pharmacologic activation of Nrf2 in mice that had already been rendered obese and insulin resistant reversed insulin resistance, suppressed hepatic steatosis, and mitigated against NASH and liver fibrosis, effects that we principally attribute to inhibition of ER, inflammatory, and oxidative stress.

Keywords: ACACA, acetyl-CoA carboxylase alpha; ACLY, ATP citrate lyase; ACOT7, acetyl-CoA thioesterase 7; ACOX2, acetyl-CoA oxidase 2; ADRP, adipose differentiation-related protein; AP-1, activator protein 1; ATF4, activating transcription factor-4; ATF6, activating transcription factor-6; ApoB, apolipoprotein B; BCL-2, B-cell lymphoma; BIP, binding immunoglobulin protein; C/EBP, CCAAT/enhancer-binding protein; CAT, catalase; CD36, cluster of differentiation 36; CDDO, 2-cyano-3,12-dioxooleana-1,9(11)-dien-28-oic acid; CES1G, carboxylesterase 1g; CHOP, C/EBP homologous protein; COL1A1, collagen, type I, alpha-1; COX2, cyclooxygenase-2; CPT1A, carnitine palmitoyltransferase 1a; ChREBP, carbohydrate-responsive element-binding protein; DGAT2, diacylglycerol acyltransferase-2; DMSO, dimethyl sulfoxide; ER, endoplasmic reticulum; FASN, fatty acid synthase; FXR, farnesoid X receptor; GCLC, glutamate-cysteine ligase catalytic; GCLM, glutamate-cysteine ligase modifier; GPX2, glutathione peroxidase-2; GSH, reduced glutathione; GSSG, oxidized glutathione; GSTA4, glutathione S-transferase Alpha-4; GSTM1, glutathione S-transferase Mu-1; GTT, glucose tolerance test; H&E, hematoxylin and eosin; HF, high-fat; HF30Fr, high-fat diet with 30% fructose in drinking water; HF55Fr, high-fat diet with 55% fructose in drinking water; HFFr, high-fat diet with fructose in drinking water; HMOX1, heme oxygenase-1; IKK, IκB kinase; IRE1α, inositol requiring kinase-1α; ITT, insulin tolerance test; IκB, inhibitor of NF-κB; JNK1, c-Jun N-terminal kinase 1; Keap1, Kelch-like ECH-associated protein-1; LXRα, liver X receptor α; MCD, methionine- and choline-deficient; MCP-1, monocyte chemotactic protein-1; MGPAT, mitochondrial glycerol-3-phosphate acetyltransferase; MPO, myeloperoxidase; MTTP, microsomal triglyceride transfer protein; NAFLD, non-alcoholic fatty liver disease; NAS, NAFLD activity score; NASH; NASH, nonalcoholic steatohepatitis; NF-κB, nuclear factor-κB; NOS2, nitric oxide synthase-2; NQO1, NAD(P)H:quinone oxidoreductase 1; Nrf2; Nrf2, NF-E2 p45-related factor 2; PARP, poly ADP ribose polymerase; PCR, polymerase chain reaction; PDI, protein disulfide isomerase; PERK, PRK-like endoplasmic reticulum kinase; PPARα, peroxisome proliferator-activated receptor α; PPARγ, peroxisome proliferator-activated receptor γ; PRDX6, peroxiredoxin 6; PTGR1, prostaglandin reductase-1; PTT, pyruvate tolerance test; RC, regular chow; SCAD, short-chain acyl-CoA dehydrogenase; SCD1, stearoyl-CoA desaturase-1; SFN, sulforaphane; SHP, small heterodimer partner; SLC7A11, solute carrier family 7 member 11; SREBP-1c, sterol regulatory element-binding protein-1c; TBE-31; TGFβ, transforming growth factor beta-1; TNF-α, tumor necrosis factor-α; TXN1, thioredoxin-1; TXNRD1, thioredoxin reductase-1; UPR, unfolded protein response; XBP1, X-box binding protein-1; eIf2α, eukaryotic translation initiation factor 2A; p58IPK, p58 inhibitor of the PKR kinase; qRT-PCR, quantitative reverse transcriptase PCR; α-SMA, alpha smooth muscle actin.


Figures

None
Graphical abstract
Figure 1
Figure 1
Structure of TBE-31.
Figure 2
Figure 2
Experimental design. (A, Study 1). In group (i), Nrf2+/+ C57BL/6 mice were first primed over a period of 15 weeks for NASH by feeding a HF55Fr diet before being transferred to the standard HF30Fr diet at the beginning of Week 16. In group (ii), an equal number of age-matched Nrf2+/+ mice were fed an RC diet along with unadulterated drinking water throughout. After being placed for 24 weeks on either of these 2 dietary regimens, mice in group (i) and group (ii) were treated with either TBE-31 (5 nmol/g body weight) or DMSO vehicle control, by oral gavage 3 times/week for a total of 6 weeks, while still being provided with the same HF30Fr diet or RC diet. Glucose homeostasis was monitored in all mice by ITT, GTT, and PTT at the times indicated. (B, Study 2). In group (i), Nrf2+/+ and Nrf2-/- C57BL/6 mice, of 8–10 weeks of age, were fed the standard HF30Fr diet for 10 weeks before being treated with either TBE-31 or DMSO for a total of 6 weeks while being maintained on the same diet. In group (ii), Nrf2+/+ and Nrf2-/- mice were fed the RC diet for 10 weeks, with no fructose in the drinking water, before being treated with either TBE-31 or DMSO for a further 6 weeks while being maintained on the same diet. Glucose homeostasis was monitored in all mice by ITT and PTT at the times indicated.
Figure 3
Figure 3
Nrf2+/+mice become obese when fed the HFFr diet, and this is associated with hyperglycemia.Nrf2+/+ mice were fed either the RC or the HF55Fr/HF30Fr (HFFr) diet for 24 weeks. Before treatment with TBE-31 or DMSO control, the physiological effect of these dietary regimens was assessed. (A) Weight gain of individual mice over the 24-week period on the RC or HFFr diets is presented. The encircled mice, shown at the bottom of the HFFr plot, were excluded from the study on the basis that they failed to become obese., , (B) A comparison of insulin sensitivity (ITT at 22 weeks) of the 5 nonobese encircled unresponsive HFFr-fed mice (triangles) with that of the 20 obese responsive HFFr-fed mice (squares). Results are means ± SEM (n = 5 or 20 mice, for nonobese and obese groups, respectively), and significant decreases in blood glucose in the nonobese unresponsive mice compared with the obese responsive mice are indicated by: $P < .05; $$P < .01; $$$P < .001. (C) The fasting blood glucose levels of Nrf2+/+ mice fed RC or HFFr diets. Results are means ± SEM (n = 8–12 mice per group). Significant increases in fasting blood glucose, relative to that in RC-fed Nrf2+/+ mice, are indicated by: **P < .01.
Figure 4
Figure 4
TBE-31 improves insulin sensitivity in HFFr-fed Nrf2+/+mice. (A) Insulin sensitivity (ie, ITT) (and as % change in blood glucose) in Nrf2+/+ mice after 22 weeks RC- (white circle) or HF55Fr/HF30Fr (HFFr)- (white square) feeding. (B) Glucose tolerance (ie, GTT, with AUC) in Nrf2+/+ mice after 23 weeks RC (white circle) or HFFr (white square) feeding. (C) Insulin sensitivity (ITT) (and as % change in blood glucose) in Nrf2+/+ mice after 28 weeks HFFr diet, and 4 weeks DMSO (white square) or TBE-31 (black square). (D) Glucose tolerance (GTT, with AUC) in Nrf2+/+ mice after 29 weeks HFFr diet and 5 weeks DMSO (white square) or TBE-31 (black square). (E) Pyruvate tolerance (PTT) (and as % change in blood glucose, with AUC) in Nrf2+/+ mice after 29.5 weeks RC diet or HFFr diet, and 5 weeks DMSO (white square) or TBE-31 (black square). In A and B, n = 20–24 mice/group: in C–E, n = 6–8 mice/group. White bars, DMSO treated; black bars, TBE-31 treated. Data are means ± SEM: ∗,$P < .05; ∗∗P < .01; ∗∗∗P < .001. AUC, area under the curve.
Figure 5
Figure 5
TBE-31 attenuates weight gain and increases in plasma insulin, cholesterol and alanine aminotransferase in HFFr-fed Nrf2+/+mice. In Study 1, Nrf2+/+ mice were killed and blood collected after 30 weeks on either the RC or HF55Fr/HF30Fr (HFFr) diet. (A) Mean gain in body weight over the 6-week treatment period of mice on the RC or HFFr diets that were administered either TBE-31 or the DMSO control. (B) Plasma leptin levels in RC-fed and HFFr-fed mice treated with TBE-31 or DMSO control. (C) Plasma insulin levels in RC-fed and HFFr-fed mice treated with TBE-31 or DMSO control. (D) Plasma cholesterol levels in RC-fed and HFFr-fed mice treated with TBE-31 or DMSO control. (E) Plasma alanine aminotransferase activity in RC-fed and HFFr-fed mice treated with TBE-31 or DMSO control. White bars, DMSO treated; black bars, TBE-31 treated (n = 8–12 mice per group). Results are means ± SEM. Significant increases in results, relative to those in livers from RC-fed Nrf2+/+ mice, are indicated by: *P < .05, **P < .01, ***P < .001. Significant decreases in results as a consequence of treatment with TBE-31, relative to HFFr-fed Nrf2+/+ mice, are indicated by: $P < .05, $$$P < .001. ALT, alanine aminotransferase.
Figure 6
Figure 6
TBE-31 treatment increases hepatic Nrf2 activity and improves liver histology in HFFr-fed Nrf2+/+mice. On completion of the Study 1 protocol, Nrf2+/+ mice were killed and livers removed. (A) A representative immunoblot for Nrf2 protein in liver extracts from RC-fed or HFFr-fed mice treated with DMSO or TBE-31 (left side), with densitometric scans of blots (right side) (n = 6 biologic replicates). (B) Nqo1 catalytic activity in hepatic extracts from RC-fed and HFFr-fed mice (n = 8–12 mice per group). (C) Representative images for H&E staining of liver sections from RC- and HFFr-fed Nrf2+/+ mice treated with DMSO or TBE-31 (scale bars = 100 μm). (D) The NAFLD activity score was calculated (n = 8–12 mice per group): note, on the y-axis the score includes negative values because livers from RC-fed Nrf2+/+ mice gave NAFLD activity scores of essentially zero. (E) Representative images for van Gieson staining of liver sections from Nrf2+/+ mice after 30 weeks RC or HF55Fr/HF30Fr feeding, followed by 6 weeks DMSO or TBE-31 treatment (scale bars = 100 μm). White bars, DMSO treated; black bars, TBE-31 treated. Results are means ± SEM. Significant increases in Nrf2 protein, Nqo1 activity, or NAFLD activity score, relative to that in livers from RC-fed Nrf2+/+ mice, are indicated by: *P < .05; ***P < .001. Significant decreases in NAFLD activity score upon treatment with TBE-31, relative to HFFr-fed Nrf2+/+ mice, are indicated by: $P < .05.
Figure 7
Figure 7
TBE-31 decreases the abundance of triglycerides and cholesterol in the livers of HFFr-fed Nrf2+/+mice. Lipids and mRNA for Adrp were measured in livers from mice in Study 1. Triglyceride (A) and cholesterol (B) in livers from mice on the RC diet and mice on the HF55Fr/HF30Fr (HFFr) diet. (C) qRT-PCR for Adrp. White bars, DMSO-treated; black bars, TBE-31−treated (n = 8–12 mice per group). Results are means ± SEM. Significant increases in triglyceride or cholesterol levels, relative to those in livers from RC-fed Nrf2+/+ mice, are indicated by: *P < .05; ***P < .001. Significant decreases in hepatic triglyceride or cholesterol levels, or mRNA for Adrp, resulting from treatment with TBE-31, relative to HFFr-fed Nrf2+/+ mice, are indicated by: $P < .05.
Figure 8
Figure 8
TBE-31 stimulates lipid catabolism and suppresses lipogenic transcription factors. On completion of Study 1, livers were removed from Nrf2+/+ mice and portions examined for expression of lipid-associated genes and protein analyses of the transcription factor Srebp-1c. (A) qRT-PCR for Acox2, Ces1g, and Acot7, (B) qRT-PCR for PPARα, Cpt1a, and Scad, and (C) qRT-PCR for Srebf1, Mlxipl, Lxrα, and Xbp1s (n = 8–12 mice per group). (D) A representative Srebp-1c immunoblot of cytoplasmic (cSrebp-1c) and nuclear (nSrebp-1c) protein (left side), with densitometric scans of blots (right side) (n = 6 biologic replicates). White bars, DMSO; black bars, TBE-31. Data are means ± SEM. Significant increases in gene expression or protein abundance, relative to that in livers from RC-fed Nrf2+/+ mice, are indicated by: *P < .05; **P < .01; ***P < .001. Significant decreases in gene expression or protein abundance, relative to that in livers from RC-fed Nrf2+/+ mice, are indicated by: $P < .05; $$P < .05.
Figure 9
Figure 9
TBE-31 suppresses expression of genes for lipid synthesis enzymes but increases expression of lipid exporters. Expression of lipid synthesis enzymes and lipid transporters were examined in livers of mice from Study-1. (A) qRT-PCR for Acaca, Acly, Fasn, and Scd1. (B) qRT-PCR for Dgat1, Dgat2, Lipin1, and Mgpat. (C) qRT-PCR for Cd36, Mttp, and ApoB. White bars, DMSO; black bars, TBE-31 (8–12 mice per group). Data are means ± SEM. Significant changes are indicated: ∗,$P < .05; ∗∗,$$P < .01; ∗∗∗P < .001.
Figure 10
Figure 10
TBE-31 suppresses ER stress in livers of Nrf2+/+mice fed a HFFr diet. Livers from Nrf2+/+ mice in Study 1 were examined for changes in proteins and genes engaged in the UPR. (A) Representative immunoblots of Bip and Pdi (with actin as loading control) in hepatic extracts from RC-fed and HF55Fr/HF30Fr (HFFr)-fed mice treated with DMSO or TBE-31, along with densitometric scans of blots (n = 6 biologic replicates). (B) Representative immunoblots of Atf6 p50 and p90, p-Ire1α, Xbp1s and Xbp1u, p-eIf2α, and Atf4 (with actin as loading control) along with densitometric scans of blots as indicated (n = 6 biologic replicates). (C) qRT-PCR for Perk, Atf4, and Chop (n = 8–12 mice per group). In all cases, white bars represent DMSO and black bars represent TBE-31. Data are means ± SEM. Significant changes are indicated: ∗,$P < .05; ∗∗,$$P < .01; ∗∗∗P < .001.
Figure 11
Figure 11
TBE-31 suppresses hepatic inflammation in HFFr-fed Nrf2+/+mice. Expression of anti-inflammatory genes and abundance of proinflammatory proteins and proinflammatory genes was examined in livers of Nrf2+/+ mice from Study 1. (A) qRT-PCR for Ptgr1 and Gsta4 (8–12 mice per group). (B) Representative immunoblots of Nfkb p65, p52, and p50 nuclear fraction proteins, with proliferating cell nuclear antigen as loading control, and cytoplasmic Ikbα and p-Ikkα/β with actin as loading control; densitometric scans of blots are shown alongside (n = 6 biologic replicates). (C) Representative immunoblots of p-Jnk and Jnk, with densitometric scans shown adjacent (n = 6 biologic replicates). (D) qRT-PCR for Cox2, Il1β, Ifnγ, Nos2, Tnfα, and Mcp1 (n = 8–12 per group). (E) qRT-PCR for Elastase and Mpo (8–12 mice per group). In all cases, white bars represent DMSO and black bars represent TBE-31. Data are means ± SEM. Significant differences are denoted: ∗,$P < .05; ∗∗,$$P < .01; ∗∗∗,$$$P < .001.
Figure 12
Figure 12
TBE-31 suppresses hepatic apoptosis and fibrosis in HFFr-fed Nrf2+/+mice. The expression of apoptosis-associated proteins and fibrosis-associated genes was examined in livers of Nrf2+/+ mice from Study 1. (A) Representative immunoblots of cleaved (CL) Parp, caspase-9 (Casp-9), and caspase-3 (Casp-3), and actin as a loading control, along with densitometric scans (n = 6 biologic replicates). (B) qRT-PCR for Bcl-2, Tgfβ, Col1a1, α-Sma, and Mmp9 (8–12 mice per group). In all cases, white bars represent DMSO and black bars represent TBE-31. Data are means ± SEM. Significant differences are signified: ∗,$P < .05; ∗∗,$$P < .01; ∗∗∗P < .001.
Figure 13
Figure 13
TBE-31 suppresses oxidative stress in HFFr-fed Nrf2+/+mice. The abundance of oxidative stress-associated biomarkers and expression of antioxidant Nrf2-target genes examined in livers from Study 1. (A) Malondialdehyde levels. (B) Oxidized protein levels shown as a representative Oxyblot, with densitometric quantification below. Lanes 1, 3, 5, and 7 negative controls; 2, RC-fed DMSO; 4, RC-fed TBE-31; 6, HFFr-fed DMSO; 8, HFFr-fed TBE-31. (C) Ratio of GSH to GSSG. (D) qRT-PCR for Gclc, Gclm, Gpx2, Nqo1, Gstm1, Hmox1, Txn1, Txnrd1, Slc7a11, Catalase (Cat), and Prdx6. In all cases, white bars represent DMSO and black bars represent TBE-31. In A, C, and D, n = 8–12. In B, n = 6. Data are means ± SEM. Significant differences are represented as: ∗,$P < .05; ∗∗,$$P < .01; ∗∗∗,$$$P < .001.
Figure 14
Figure 14
TBE-31 fails to improve insulin sensitivity in HFFr-fed Nrf2-/-mice. During Study 2, physiological end-points and glucose homeostasis were examined in wild-type and Nrf2-null mice fed an RC or HF30Fr (HFFr) diet (n = 6–8 mice per group). (A) Body weight gain of mice up until intervention at end of Week 10 (left, vertical striped bars, RC; diagonal striped bars, HFFr) and following (Weeks 11–16) of treatment (right). (B) Glucose production (pyruvate tolerance) with AUC in Nrf2+/+ (squares) and Nrf2-/- (triangles) mice after 10 weeks HF30Fr diet, followed by 5 weeks treatment with DMSO (white squares and triangles) or TBE-31 (black squares and triangles). (C) Insulin sensitivity (% change in blood glucose) in Nrf2+/+ (squares) and Nrf2-/- (triangles) mice after 10 weeks HF30Fr diet followed by 4 weeks with DMSO (white squares and triangles) or TBE-31 (black squares and triangles). White bars, DMSO; black bars, TBE-31. Data are means ± SEM. Significant changes: P < .05; ∗∗,$$P < .01; ∗∗∗,$$$P < .001. D–F, Scale bars = 100 μm. AUC, area under the curve,
Figure 15
Figure 15
TBE-31 does not improve NASH histology in livers of HFFr-fed Nrf2-/-mice. After sacrifice, livers from Nrf2+/+ and Nrf2-/- mice in Study 2 were removed and fixed in formalin (n = 6–8 mice per group). (A) Representative images for H&E staining of mouse liver sections after 16 weeks RC- or HFFr-feeding, including treatment with DMSO during Weeks 11–16 (scale bars = 100 µm). (B) Representative images for H&E staining of liver sections from Nrf2+/+ and Nrf2-/- mice after 16 weeks RC- or HFFr-feeding including treatment with DMSO or TBE-31 during Weeks 11–16 (scale bars = 100 µm). (C) The extent of disease was assessed using the NAFLD activity score method. (D) Representative images for van Gieson staining of liver sections from Nrf2+/+ and Nrf2-/- mice after 16 weeks of HFFr-feeding and treatment with DMSO or TBE-31. White bars, DMSO-treated; black bars, TBE-31 treated (6–8 mice per group). Results are means ± SEM. Significant increases in NAFLD activity score, relative to that in livers from RC-fed DMSO-treated Nrf2+/+ mice, are indicated by: ***P < .001. The significant decrease in NAFLD activity score resulting from treatment with TBE-31, relative to HFFr-fed DMSO-treated Nrf2+/+ mice, is denoted by: $P < .05.
Figure 16
Figure 16
TBE-31 does not decrease steatosis in the livers of HFFr-fed Nrf2-/-mice. After completion of Study 2, livers were removed from Nrf2+/+ and Nrf2-/- mice to confirm absence of Nrf2 in the knockout mouse, and for biochemical analyses. (A, left side) Representative immunoblot of Nrf2 in livers of mice of both genotypes fed either a RC-diet or a HFFr-diet and treated with DMSO or TBE-31. (A, right side) Densitometric scans of the immunoblots (n = 4 biologic replicates). (B) Nqo1 catalytic activity in hepatic extracts from Nrf2+/+ and Nrf2-/- mice fed RC or HFFr diets, and treated with DMSO or TBE-31. (C, D) Triglycerides and cholesterol in livers from Nrf2+/+ mice fed RC and HF30Fr diets are shown on the left side of the graphs, and results from Nrf2-/- mice fed RC and HF30Fr diets are presented on the right side. (E) qRT-PCR for the lipid droplet-associated protein Adrp. In all cases, white bars represent DMSO and black bars represent TBE-31. In A, 4 mice per group were examined. In B–D, 6–8 mice per group. Data are means ± SEM. Significant differences from Nrf2+/+ control are indicated: ∗,$P < .05; ∗∗P < .01; ∗∗∗,$$$P < .001.
Figure 17
Figure 17
TBE-31 does not decrease expression of lipogenic transcription factors or fatty acid synthesis enzymes in livers of HFFr-fed Nrf2-/-mice. The expression of transcription factors associated with lipid metabolism, and their target genes, were examined in livers from Nrf2+/+ and Nrf2-/- mice that had been fed either a RC or HF30Fr (HFFr) diet and treated with DMSO or TBE-31. (A) qRT-PCR for the lipogenic transcription factors Srebf1, Mlxipl, Lxrα and Xbp1s. (B) Representative Srebp-1c immunoblots of cytoplasmic (cSrebp-1c) and nuclear (nSrebp-1c) protein on left side, with plots of densitometric scans on right side (n = 4 biologic replicates). (C) qRT-PCR for the fatty acid synthesis genes Acaca, Acly, Fasn, Scd1, and Dgat2. (D) qRT-PCR for the lipid import gene Cd36 and the export genes Mttp and ApoB. White bars, DMSO treated; black bars, TBE-31 treated. In A, C, and D, 6–8 mice per group. In B, n = 4. Results are means ± SEM. Significant increases relative to that found in livers of RC-fed DMSO-treated Nrf2+/+ mice are indicated by: *P < .05; **P < .01; ***P < .001. Significant decreases relative to HF30Fr-fed DMSO-treated Nrf2+/+ mice are indicated: $P < .05; $$P < .01.
Figure 18
Figure 18
TBE-31 fails to suppress ER stress in livers of HFFr-fed Nrf2-/-mice. Livers were collected from Nrf2+/+ and Nrf2-/- mice at the end of Study 2, and proteins and genes involved in the UPR were examined. Representative immunoblots of p-Ire1α, Xbp1s and Xbp1u, p58IPK, p-eIf2α and Atf4 proteins, along with actin as a loading control, are shown at the top. Plots of densitometric scans from the blots are shown at the bottom (n = 4 biologic replicates). White bars, DMSO treated; black bars, TBE-31 treated. Results are means ± SEM. Significant increases relative to that found in livers of RC-fed Nrf2+/+ mice are indicated by: *P < .05; **P < .01; ***P < .001. Significant decreases relative to HF30Fr-fed Nrf2+/+ mice are indicated: $P < .05; $$P < .01.
Figure 19
Figure 19
TBE-31 fails to suppress inflammation and oxidative stress in HFFr-fed Nrf2-/-mouse liver. The extent of inflammation and oxidative stress in livers of Nrf2+/+ and Nrf2-/- mice at the end of Study 2 was examined. (A) Representative immunoblots of hepatic nuclear levels of Nfkb p65 and Nfkb p50 (using proliferating cell nuclear antigen as a loading control), along with densitometric scans (n = 4 biologic replicates), from Nrf2+/+ and Nrf2-/- mice fed RC or HFFr diets and treated with DMSO or TBE-31. (B) qRT-PCR for the Nfkb-target genes Cox2 and Nos2 from the same livers (6–8 mice per group). (C) Malondialedehyde levels in livers from Nrf2+/+ and Nrf2-/- mice (6–8 mice per group). (D) Oxidized protein levels in livers of Nrf2+/+ and Nrf2-/- mice shown as a representative Oxyblot, with densitometric quantification below: lanes 1, 3, 5, and 7 negative controls; 2, RC-fed DMSO; 4, RC-fed TBE-31; 6, HF30Fr-fed DMSO; 8, HF30Fr-fed TBE-31 (n = 4). (E) Ratio of GSH to GSSG (6–8 mice per group). In all cases, white bars represent DMSO and black bars represent TBE-31. Data are means ± SEM. Significant differences are signified: ∗,$P < .05; ∗∗,$$P < .01; ∗∗∗,$$$P < .001.
Figure 20
Figure 20
Nrf2-dependent mechanisms by which TBE-31 suppresses insulin resistance, NASH and cirrhosis. (A) The various mechanisms by which consumption of a high-fat and high-fructose diet is believed to drive hepatic steatosis, NASH, and cirrhosis., , (B) The processes by which we envisage pharmacologic activation of Nrf2 inhibits and/or reverses liver disease caused by consumption of a diet enriched with high-fat and high-fructose foodstuffs. For further information see Results and Discussion sections. HSC, hepatic stellate cell.
Figure 20
Figure 20
Nrf2-dependent mechanisms by which TBE-31 suppresses insulin resistance, NASH and cirrhosis. (A) The various mechanisms by which consumption of a high-fat and high-fructose diet is believed to drive hepatic steatosis, NASH, and cirrhosis., , (B) The processes by which we envisage pharmacologic activation of Nrf2 inhibits and/or reverses liver disease caused by consumption of a diet enriched with high-fat and high-fructose foodstuffs. For further information see Results and Discussion sections. HSC, hepatic stellate cell.

References

    1. Vos M.B., Lavine J.E. Dietary fructose in non-alcoholic fatty liver disease. Hepatology. 2013;57:2525–2531. - PubMed
    1. Haas J.T., Francque S., Staels B. Pathophysiology and mechanisms of nonalcoholic fatty liver disease. Annu Rev Physiol. 2016;78:181–205. - PubMed
    1. Michelotti G.A., Machado M.V., Diehl A.M. NAFLD, NASH and liver cancer. Nat Rev Gastroenterol Hepatol. 2013;10:656–665. - PubMed
    1. Tilg H., Moschen A.R. Evolution of inflammation in nonalcoholic fatty liver disease: the multiple parallel hits hypothesis. Hepatology. 2010;52:1836–1846. - PubMed
    1. Takaki A., Kawai D., Yamamoto K. Multiple hits, including oxidative stress, as pathogenesis and treatment target in non-alcoholic steatohepatitis (NASH) Int J Mol Sci. 2013;14:20704–20728. - PMC - PubMed