. 2017 Sep;1(9):1700068.
doi: 10.1002/adbi.201700068. Epub 2017 Jul 31.

Deterministic Integration of Biological and Soft Materials onto 3D Microscale Cellular Frameworks

Affiliations

Deterministic Integration of Biological and Soft Materials onto 3D Microscale Cellular Frameworks

Joselle M McCracken et al. Adv Biosyst. 2017 Sep.

Abstract

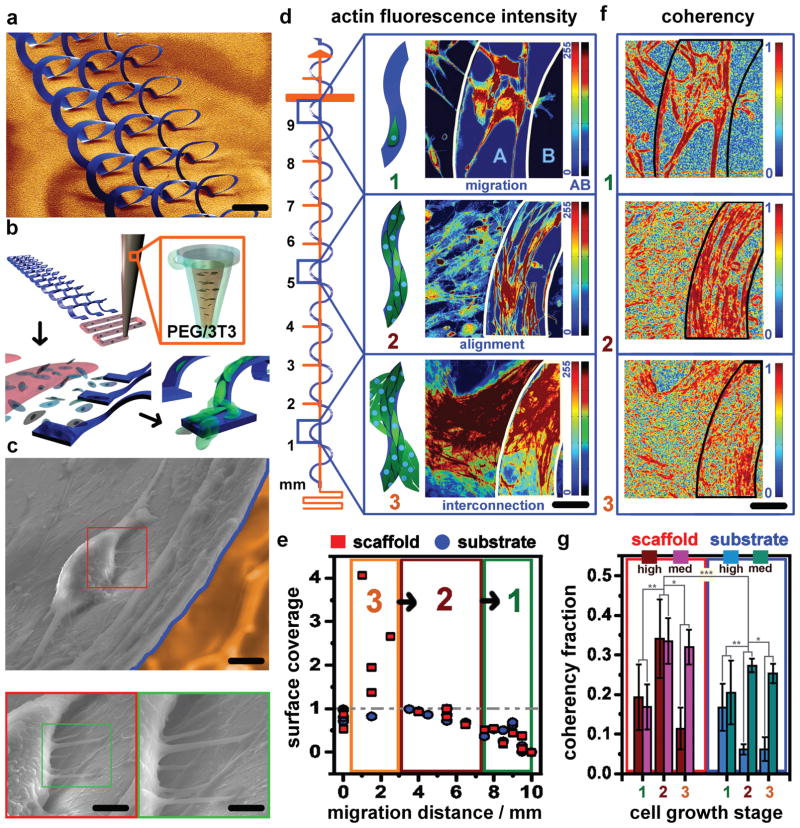
Complex 3D organizations of materials represent ubiquitous structural motifs found in the most sophisticated forms of matter, the most notable of which are in life-sustaining hierarchical structures found in biology, but where simpler examples also exist as dense multilayered constructs in high-performance electronics. Each class of system evinces specific enabling forms of assembly to establish their functional organization at length scales not dissimilar to tissue-level constructs. This study describes materials and means of assembly that extend and join these disparate systems-schemes for the functional integration of soft and biological materials with synthetic 3D microscale, open frameworks that can leverage the most advanced forms of multilayer electronic technologies, including device-grade semiconductors such as monocrystalline silicon. Cellular migration behaviors, temporal dependencies of their growth, and contact guidance cues provided by the nonplanarity of these frameworks illustrate design criteria useful for their functional integration with living matter (e.g., NIH 3T3 fibroblast and primary rat dorsal root ganglion cell cultures).

Keywords: 3D scaffolds; cellular contact guidance; compressive-assembly; direct ink writing; hydrogels.


Conflict of interest statement

Conflict of Interest The authors declare no conflict of interest.

Figures

Figure 1
Figure 1
Deterministic integration of hydrogels onto 3D microscaffolds. a) Schematics of direct ink writing (DIW) hydrogels onto, e.g., compressively buckled Si μ-CFs consisting of (1) silyl methacrylate surface treatment during transfer printing, (2) printing methacrylate-based hydrogel pre-polymer gels onto 2D μ-CFs on prestrained elastomers, and (3) releasing prestrain buckles the scaffolds and the UV treatment cures the hydrogel into place. b) Scaffold pattern schematics (orange bonded contacts, blue free-assembling scaffold) and corresponding colorized SEM images of hydrogel/μ-CF hybrid devices (HEMA hydrogel in red, scaffold in blue, substrate in yellow; scale bars 200 μm for 1,2,4; 50 μm for 3). c) HEMA (red) or NIPAM (green) monomers incorporated into printable hydrogel inks, resulting in d) the schematic and colorized image of hydrogel networks hybridized onto compressively buckled 300 nm Au ribbon patterns (scale bar 200 μm), and e,f) schematics (left) and confocal fluorescence data (right) for representative scaffold geometries patterned with HEMA and NIPAM-based hydrogel bilayer gradients (scale bars e)100 μm; f) 500 μm).
Figure 2
Figure 2
3D migration dynamics and coherency of fibroblasts on microscaffolds. a) Colorized SEM images of a compressively buckled solenoid array (scale bar 500 μm). b) Schematics of DIW poly(ethylene glycol)/media-3T3 gel (top) that dissolves in culture as 3T3 cells attach locally (bottom-left) and then migrate onto the solenoid array (bottom-right). c) Colorized SEM and higher magnification insets of a migrating 3T3 cell on the solenoid array (yellow substrate, blue border on cell-loaded scaffold; scale bars 5 μm (top), 3 μm (lower left), 1 μm (lower right). d) Growth stages of 3D 3T3 cell migration, shown schematically where they occur on the solenoid scaffold, consisting of: (1, 0–3 d) migration, (2, 3–14 d) alignment, and interconnection (3, 14–21 d). Growth phases over 21 d are qualified by relative actin fluorescence intensity from confocal images, depicted for clarity with separate 0–255 color-scales (image, right) mapping actin fluorescence for either scaffold (A) or substrate (B, scale bar 50 μm). e) Fractional actin surface coverage quantification for scaffold and substrate. Fractional coverage >1 signifies the interconnection growth stage (3, orange box). Fractional coverage approaching 1 signifies near-confluence during the alignment stage (2, maroon box). Fraction coverage far below 1 signifies low cell density during the migration stage (1, olive box). f) Coherency maps calculated for exemplary confocal images visually quantify coherency distribution for each growth stage, with the color-scale of 1 describing high anisotropy/alignment and 0 describing isotropy. g) Coherency fractional coverage quantified for all growth stage images shows peak high coherency fractions (C > 0.9) for scaffolds only during the alignment stage (2), and medium coherency fractions (0.7 < C < 0.9) increasing for stages 2 and 3 on scaffold and substrate. Highest coherency seen on scaffolds. Statistical analysis to determine significance is given in Figure S7 (Supporting Information).
Figure 3
Figure 3
Fibroblast responses to low and high alignment 3D microscaffold environments. a) Low alignment contact guidance from Si μ-CFs tables leads to disordered 3T3 networks shown with fluorescently stained (green) actin and (blue) nuclei (left, scale bar 50 μm), and with SEM images (yellow substrate, blue bordered scaffold loaded with cells, middle; scale bar: 50 μm). Long cell axes orient stochastically on planar table surfaces (right, scale bar 10 μm). b) High alignment contact guidance from Si μ-CF solenoids leads to ordered 3T3 networks with higher elongation, shown with fluorescently stained (green) actin and (blue) nuclei (left, 30 μm), and with SEM images (yellow substrate, blue bordered scaffold loaded with cells, middle; scale bar: 30 μm). Long cell axes orient in ordered networks that align to complex spatial vectors of the 3D ribbon surface (right, 10 μm). c) 3D alignment angles (Θ) compare the actin vector to the angle of the tangent at the nearest scaffold edge, a distance calculated from each nucleus center. d) Schematics of a Si μ-CF table (1 mm diameter) and Si μ-CF solenoid ribbons (widths 60, 100, 140 μm) are colorized relative to alignment conditions that occur on them (blue, higher alignment, low alignment angles; coral, lower alignment, high alignment angles). e) Histograms of elongation factor (left) and alignment angle (right) distributions for low and high alignment environments, shown with average values as bar graph insets. f) Distance from edge effects on average alignment angles and angle distribution FWHM for cells on a Si μ-CF table scaffold correspond with the points A and B (specified in d). Alignment angles and angle distribution FWHM for cells on Si μ-CF solenoid ribbon scaffolds correspond with the points C, D, and E (specified in d), with half widths (30, 50, 70 μm, respectively) used for the solenoids due to the presence of parallel edges. Statistical analysis to determine significance in e and f is given in Figure S16 (Supporting Information).
Figure 4
Figure 4
Dorsal root ganglion-derived cellular integration on 3D microscaffolds. a) Schematic of primary rat dorsal root ganglia and the cell populations that are dissociated from them (DRG neurons, Schwann cells, and satellite glia) which are b) cultured on Si μ-CF tables or SU8 epoxy polymer tables (light blue scaffolds). DRG scale bar is 450 μm and 2D DRG cell culture scale bar is 65 μm. c) Si μ-CF table arrays are cultured with DRG cells that redevelop tissue constructs guided by the 3D scaffolds (scale bar 1.5 mm) in (1) calcein AM-stained live cultures (scale bar 100 μm) and (2) fixed cultures immunocytochemically (ICC) stained for (red) neurons, (green) glia and (blue) nuclei. Red arrows specify neuron cell body positions (scale bar 150 μm). d) Colorized SEM images of SU8 epoxy μ-CF polymer tables of varying geometries include table legs only (top, 1), a mini table (middle,1), and an open table (bottom, 1; scale bar 150 μm), each cultured with DRG cells shown with phase contrast 2; scale bar 500 μm) and ICC microscopy (3; scale bar 400 μm).
Figure 5
Figure 5
3D-specific morphological formations of dorsal root ganglion-derived cells. DRG tissue constructs develop through contact guidance from the scaffold and through development of apparent tensile morphologies within their networks. Tissue construct motifs include a) ganglion mimetic clusters that re-form around elevated, high aspect ratio scaffold geometries in (top) phase contrast, (middle) live calcein-AM stained, and (bottom) ICC-stained (scale bars 100, 50, 100 μm). b) High tension fibers form shortcuts that interconnect scaffold geometries in scaffold-supported and scaffold-anchored morphologies shown at low and high magnification SEM images (left, middle) and (right) fluorescence micrographs (scale bars top: 150, 5, 15 μm; bottom: 20, 10, 20 μm). c) Cellular sheaths develop as glial cells network around DRG neurons on table scaffold planes. More exposed neurons are shown at left, with thicker cellular sheaths shown at middle, and fluorescence micrograph of on-scaffold tissue networks at right (scale bars 8, 5, 20 μm).

Similar articles

Cited by

References

    1. Kim DH, Ahn JH, Choi WM, Kim HS, Kim TH, Song J, Huang YY, Liu Z, Lu C, Rogers JA. Science. 2008;320:507. - PubMed
    2. Ahn JH, Kim HS, Lee KJ, Jeon S, Kang SJ, Sun YG, Nuzzo RG, Rogers JA. Science. 2006;314:1754. - PubMed
    1. Yoon J, Baca AJ, Park S-I, Elvikis P, Geddes JB, Li L, Kim RH, Xiao J, Wang S, Kim T-H, Motala MJ, Ahn BY, Duoss EB, Lewis JA, Nuzzo RG, Ferreira PM, Huang Y, Rockett A, Rogers JA. Nat Mater. 2008;7:907. - PubMed
    1. Yu C, Yuan P, Erickson EM, Daly CM, Rogers JA, Nuzzo RG. Soft Matter. 2015;11:7953. - PubMed
    2. Stewart ME, Anderton CR, Thompson LB, Maria J, Gray SK, Rogers JA, Nuzzo RG. Chem Rev. 2008;108:494. - PubMed
    1. Bronstein ND, Yao Y, Xu L, O’Brien E, Powers AS, Ferry VE, Alivisatos AP, Nuzzo RG. ACS Photonics. 2015;2:1576.
    2. Kim HS, Brueckner E, Song J, Li Y, Kim S, Lu C, Sulkin J, Choquette K, Huang Y, Nuzzo RG, Rogers JA. Proc Natl Acad Sci USA. 2011;108:10072. - PMC - PubMed
    3. Park SI, Xiong Y, Kim RH, Elvikis P, Meitl M, Kim DH, Wu J, Yoon J, Chang-Jae Y, Liu Z, Huang Y, Hwang KC, Ferreira P, Xiuling L, Choquette K, Rogers JA. Science. 2009;325:977. - PubMed
    1. Sun J, Ding Y, Lin NJ, Zhou J, Ro H, Soles CL, Cicerone MT, Lin-Gibson S. Biomacromolecules. 2010;11:3067. - PMC - PubMed
    2. Stevens MM, George JH. Science. 2005;310:1135. - PubMed
    3. Cukierman E, Pankov R, Stevens DR, Yamada KM. Science. 2001;294:1708. - PubMed
    4. Langer R, Vacanti JP. Science. 1993;260:920. - PubMed
    5. Curtis A, Wilkinson C. Bio-materials. 1997;18:1573. - PubMed
    6. Yoshinari M, Matsuzaka K, Inoue T, Oda Y, Shimono M. J Biomed Mater Res A. 2003;65A:359. - PubMed
    7. Clark P, Connolly P, Curtis AS, Dow JA, Wilkinson CD. Development. 1990;108:635. - PubMed
    8. Clark AK, Taubenberger AV, Taylor RA, Niranjan B, Chea ZY, Zotenko E, Sieh S, Pedersen JS, Norden S, Frydenberg M, Grummet JP, Pook DW, Stirzaker C, Clark SJ, Lawrence MG, Ellem SJ, Hutmacher DW, Risbridger GP Australian Prostate Cancer B. Biomaterials. 2013;34:4777. - PubMed
    9. Chou L, Firth JD, Uitto VJ, Brunette DM. J Cell Sci. 1995;108:1563. - PubMed
    10. Chen CS, Mrksich M, Huang S, Whitesides GM, Ingber DE. Science. 1997;276:1425. - PubMed