. 2017;1(3):035002.
doi: 10.1088/2399-1984/aa8f91. Epub 2017 Nov 6.

Observation of Giant Conductance Fluctuations in a Protein

Affiliations

Observation of Giant Conductance Fluctuations in a Protein

Bintian Zhang et al. Nano Futures. 2017.

Abstract

Proteins are insulating molecular solids, yet even those containing easily reduced or oxidized centers can have single-molecule electronic conductances that are too large to account for with conventional transport theories. Here, we report the observation of remarkably high electronic conductance states in an electrochemically-inactive protein, the ~200 kD αVβ3 extracelluar domain of human integrin. Large current pulses (up to nA) were observed for long durations (many ms, corresponding to many pC of charge transfer) at large gap (>5nm) distances in an STM when the protein was bound specifically by a small peptide ligand attached to the electrodes. The effect is greatly reduced when a homologous, weakly-binding protein (α4β1) is used as a control. In order to overcome the limitations of the STM, the time- and voltage-dependence of the conductance were further explored using a fixed-gap (5 nm) tunneling junction device that was small enough to trap a single protein molecule at any one time. Transitions to a high conductance (~ nS) state were observed, the protein being "on" for times from ms to tenths of a second. The high-conductance states only occur above ~ 100mV applied bias, and thus are not an equilibrium property of the protein. Nanoamp two-level signals indicate the specific capture of a single molecule in an electrode gap functionalized with the ligand. This offers a new approach to label-free electronic detection of single protein molecules. Electronic structure calculations yield a distribution of energy level spacings that is consistent with a recently proposed quantum-critical state for proteins, in which small fluctuations can drive transitions between localized and band-like electronic states.


Conflict of interest statement

Conflict of Interest SL is a cofounder of Recognition AnalytiX, licensee of this technology. SL, PZ, PP and YZ are inventors on patent applications resulting from this work.

Figures
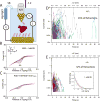
Figure 1
Figure 1
STM current-distance traces show large current peaks at large distances when integrin protein binds specifically to an electrode. (A) schematic layout of the experiment. The probe tip and the substrate were functionalized with a cysteine-containing cyclic RGD peptide that binds αVβ3 integrin but not α4β1. Electrodes were biased with respect to an Ag/AgCl reference connected via a salt bridge. Cyclic voltammetery on 0.5 cm2 Pd-coated substrate modified with cyclic RGD peptide (inset) in 1 mM phosphate buffer (B) and after the addition of 10 nM αVβ3 (C). Logarithm of current vs retraction distance (ΔZ) for solutions containing 10 nM αVβ3 (D) or α4β1 (E). Inset in E shows the rapid decay of current in buffer alone as the tip is retracted from its initial set-point (4pA at 200mV, corresponding to about a 2nm gap before retraction).
Figure 2
Figure 2
Summary of current peaks observed in STM retractions. Scatter plots of logarithm of peak current vs. retraction distance (i.e., from the initial set-point gap of about 2nm to the current peak) for αVβ3 (A) and α4β1 (B). (C) The distribution of charge in each peak (obtained by integrating each current-time curve) for the two proteins. The scale is logarithmic in charge.
Figure 3
Figure 3
Fabrication of the fixed-gap tunnel chip and some typical results at a bias of Vt=300 mV (and Vr=0V vs. Ag/AgCl). (A) shows the layered structure of the MEMED with an opening that exposes the electrodes to the solution, sized (in this illustration) so as to trap just one integrin molecule. Electrodes are functionalized with cyclic RGD peptide and biased as shown. (B) TEM image of a cross section of the junction showing the 4.8 nm dielectric layer. (C) TEM image of a “T” shaped top electrode that was milled with three RIE-etched slots (white openings). (D) Typical current trace in phosphate buffer. The high baseline current comes from stray leakage paths, and the noise distribution (E) is well-described by a single Gaussian. When the control protein, α4β1 was added (F) the noise distribution did not change. When αVβ3 protein was added (H) large current jumps to well defined levels (I) were observed. The background leakage was also reduced (as was observed in the cyclic voltammetry) indicating that the adsorbed protein passivates the surface.
Figure 4
Figure 4
Bias dependence of chip-signals from αVβ3 protein. (A) Some selected current traces, showing the onset of current jumps above the baseline leakage, starting at a bias of 100mV, with fluctuations increasing as bias is increased (amplitude histograms are plotted to the right of each trace to the same current scale as each trace). Note that the current scales are different for each trace to show detail. The background leakage increases linearly with bias. (B) Scatter plot of the separation of peaks in the amplitude histograms as a function of bias. Sets of identical symbols at a given bias show the values obtained from as analysis of each burst of signal in a given run, so that the spread of points represents the variations from burst to burst of signal in a given recording. Data are from 2 chips, chip 6 (a-e) and chip 7 (f,g). Points d are for a first run with chip 6, and a,b, and c are for a second run. Here the b points are for a second peak in the distribution, and c are for a third peak. Runs were taken at a bias with respect to the reference of 0V except for e, and f which were taken at + 50mV. (C) Distribution (gray bars) of charge under each signal peak for the chip data at 300mV (gray) and for the STM data at 200 mV (red data). Over these ranges of potential and bias, both electrodes were in a region that avoids Faradaic currents.
Figure 5
Figure 5
Time structure of the current fluctuations. (A) The short-time distribution of “on” times is Poisson and identical for two values of bias (as labeled). (B) The fraction of time spent in the “on” state as a function of bias (red squares). Additional black points are for the sharp additional features that appear as the larger current steps in the histograms at 250 and 300mV, possibly representing binding of more than one molecule in the junction. (C,D) Showing scatter plots of the “on” time vs. amplitude of the current peak for individual signal events. The time scales are logarithmic so the linear fits (red lines) demonstrate an exponential relationship between peak current and on-time. The fitted slope is 0.006 pA−1 in each case.
Figure 6
Figure 6
Calculated cumulative level spacing distribution (orange circles) for αVβ3 Integrin protein (PDB ID: 4G1M). Only one in every 2000 values are shown for clarity. For comparison the theoretical curves IP(s) (black line), IW(s) (blue line) and IT(s) (yellow line) are also shown. Inset: Difference between the data curves and IT(s) are shown. Each value is plotted. The error is below 4 % in probability. The calculated distribution is compatible with quantum criticality.

Similar articles

Cited by

  • Holographic nature of critical quantum states of proteins.
    Papp E, Vattay G. Papp E, et al. Comput Struct Biotechnol J. 2025 May 29;30:59-63. doi: 10.1016/j.csbj.2025.05.049. eCollection 2025. Comput Struct Biotechnol J. 2025. PMID: 40524885 Free PMC article.
  • Electronic Conductance Resonance in Non-Redox-Active Proteins.
    Zhang B, Song W, Brown J, Nemanich R, Lindsay S. Zhang B, et al. J Am Chem Soc. 2020 Apr 1;142(13):6432-6438. doi: 10.1021/jacs.0c01805. Epub 2020 Mar 23. J Am Chem Soc. 2020. PMID: 32176496 Free PMC article.
  • Progress in the Development of Flexible Devices Utilizing Protein Nanomaterials.
    Zhang C, Zhang C, Liu Y. Zhang C, et al. Nanomaterials (Basel). 2025 Feb 27;15(5):367. doi: 10.3390/nano15050367. Nanomaterials (Basel). 2025. PMID: 40072172 Free PMC article. Review.
  • Role of contacts in long-range protein conductance.
    Zhang B, Song W, Pang P, Lai H, Chen Q, Zhang P, Lindsay S. Zhang B, et al. Proc Natl Acad Sci U S A. 2019 Mar 26;116(13):5886-5891. doi: 10.1073/pnas.1819674116. Epub 2019 Mar 7. Proc Natl Acad Sci U S A. 2019. PMID: 30846548 Free PMC article.
  • The emerging landscape of single-molecule protein sequencing technologies.
    Alfaro JA, Bohländer P, Dai M, Filius M, Howard CJ, van Kooten XF, Ohayon S, Pomorski A, Schmid S, Aksimentiev A, Anslyn EV, Bedran G, Cao C, Chinappi M, Coyaud E, Dekker C, Dittmar G, Drachman N, Eelkema R, Goodlett D, Hentz S, Kalathiya U, Kelleher NL, Kelly RT, Kelman Z, Kim SH, Kuster B, Rodriguez-Larrea D, Lindsay S, Maglia G, Marcotte EM, Marino JP, Masselon C, Mayer M, Samaras P, Sarthak K, Sepiashvili L, Stein D, Wanunu M, Wilhelm M, Yin P, Meller A, Joo C. Alfaro JA, et al. Nat Methods. 2021 Jun;18(6):604-617. doi: 10.1038/s41592-021-01143-1. Epub 2021 Jun 7. Nat Methods. 2021. PMID: 34099939 Free PMC article. Review.

References

    1. Nitzan A. Chemical dynamics in condensed phases. Oxford: Oxford University Press; 2006.
    1. Onuchic JN, et al. Pathway analysis of protein electron-transfer reactions. Annu Rev Biophys Biomol Struct. 1992;21:349–77. - PubMed
    1. Polizzi NF, Skourtis SS, Beratan DN. Physical Constraints on Charge Transport through Bacterial Nanowires. Faraday Discussions. 2012;153:43–62. - PMC - PubMed
    1. Beratan DN, et al. Charge transfer in dynamical biosystems, or the treachery of (static) images. Acc Chem Res. 2015;48(2):474–81. - PMC - PubMed
    1. Xiao X, Xu BQ, Tao NJ. Conductance Titration of Single Peptide Molecules. J Am Chem Soc. 2004;126:5370–5371. - PubMed