

A systems approach using OSMAC, Log P and NMR fingerprinting: An approach to novelty
- PMID: 29552652
- PMCID: PMC5851912
- DOI: 10.1016/j.synbio.2017.10.001
A systems approach using OSMAC, Log P and NMR fingerprinting: An approach to novelty
Abstract
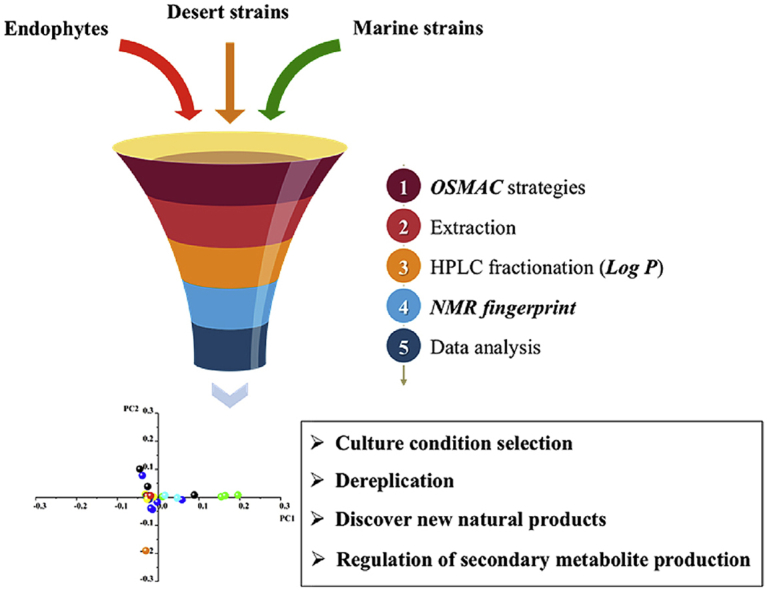
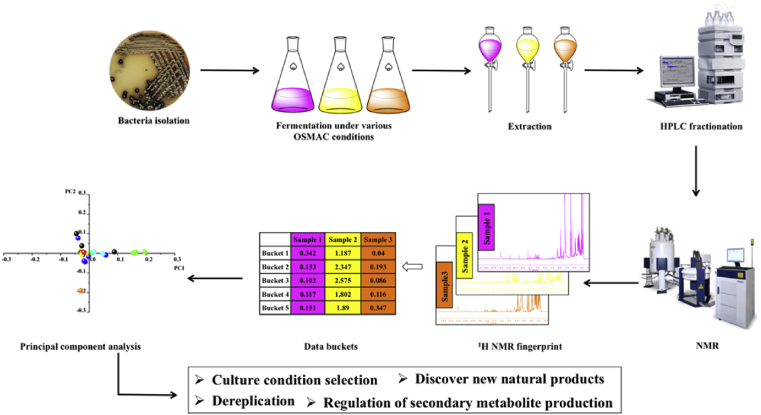
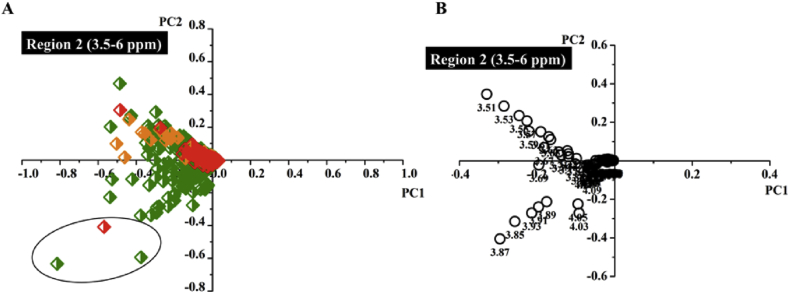
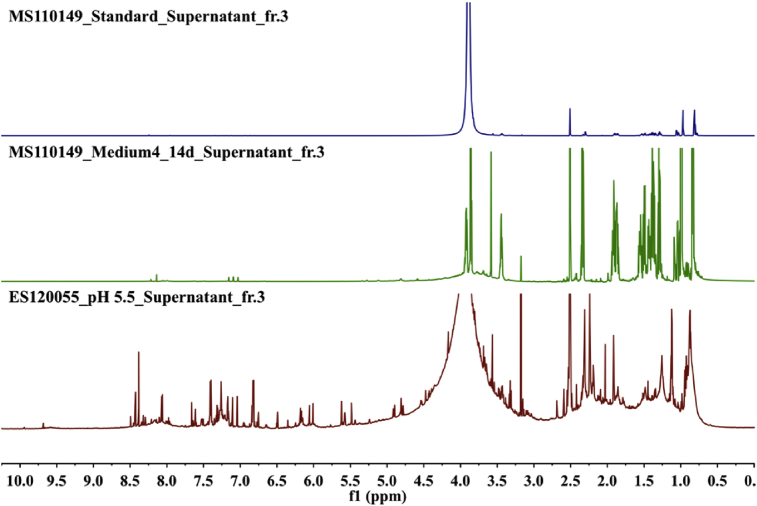
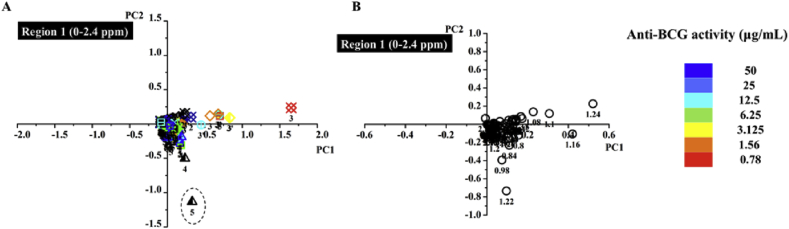
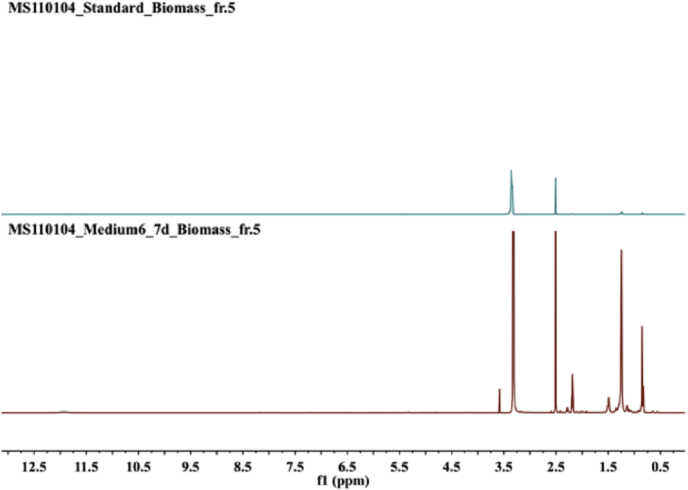
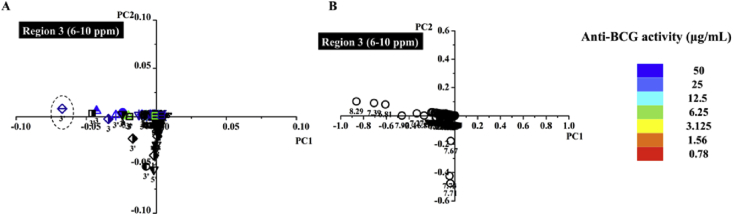
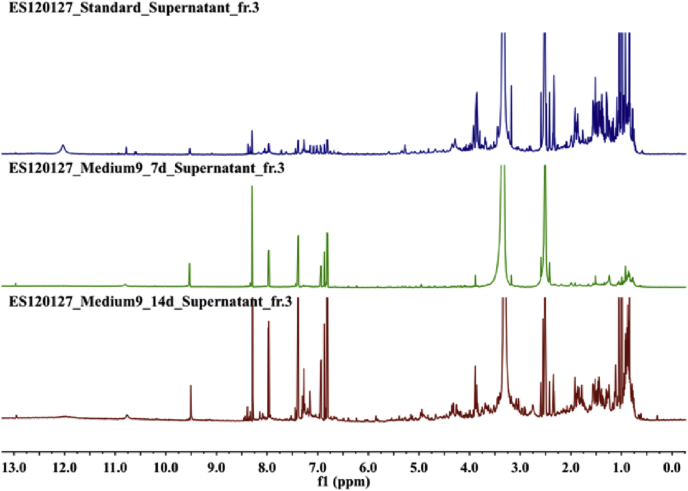
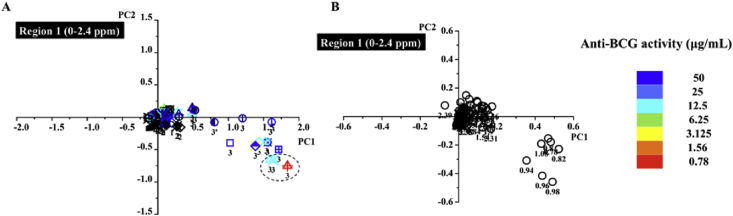
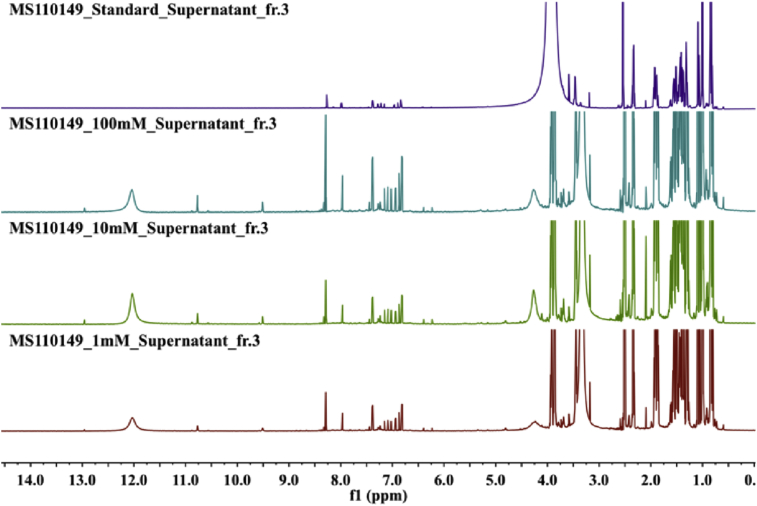
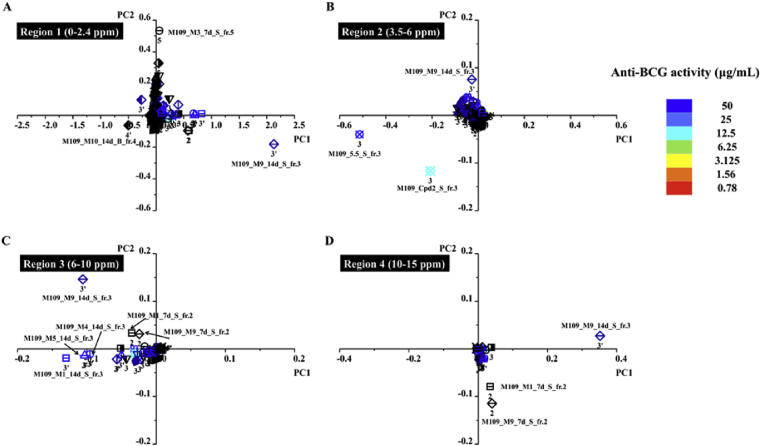
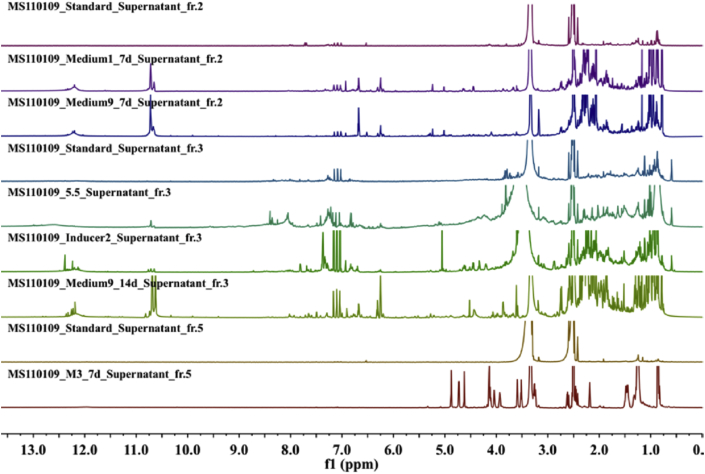
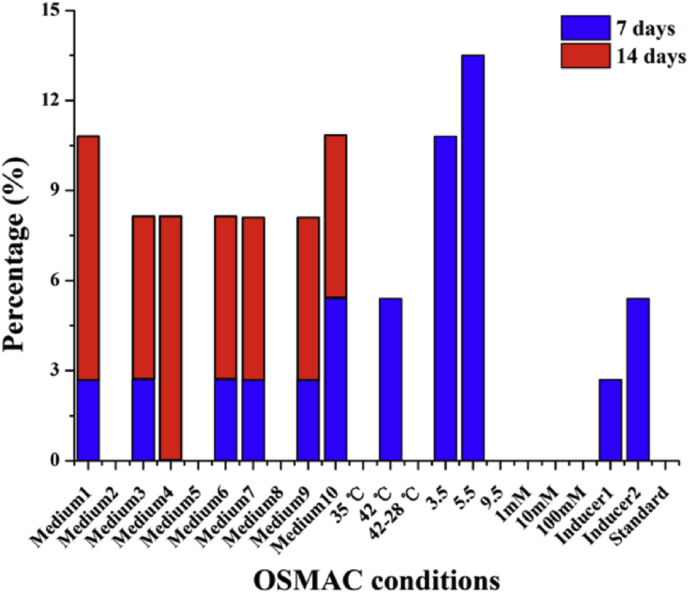
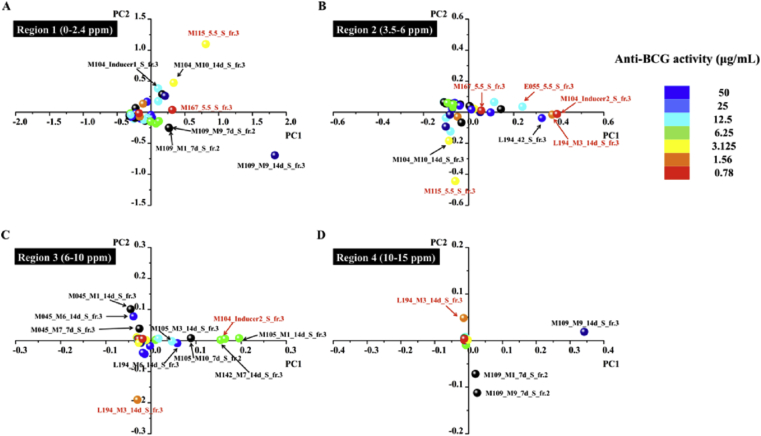
The growing number of sequenced microbial genomes has revealed a remarkably large number of secondary metabolite biosynthetic clusters for which the compounds are still unknown. The aim of the present work was to apply a strategy to detect newly induced natural products by cultivating microorganisms in different fermentation conditions. The metabolomic analysis of 4160 fractions generated from 13 actinomycetes under 32 different culture conditions was carried out by 1H NMR spectroscopy and multivariate analysis. The principal component analysis (PCA) of the 1H NMR spectra showed a clear discrimination between those samples within PC1 and PC2. The fractions with induced metabolites that are only produced under specific growth conditions was identified by PCA analysis. This method allows an efficient differentiation within a large dataset with only one fractionation step. This work demonstrates the potential of NMR spectroscopy in combination with metabolomic data analysis for the screening of large sets of fractions.
Keywords: Metabolites; NMR fingerprints; OSMAC.
Figures
Similar articles
-
Fingerprinting analysis of fresh ginseng roots of different ages using 1H-NMR spectroscopy and principal components analysis.Arch Pharm Res. 2007 Dec;30(12):1625-8. doi: 10.1007/BF02977333. Arch Pharm Res. 2007. PMID: 18254251
-
Bivariate One Strain Many Compounds Designs Expand the Secondary Metabolite Production Space in Corallococcus coralloides.Microorganisms. 2023 Oct 20;11(10):2592. doi: 10.3390/microorganisms11102592. Microorganisms. 2023. PMID: 37894250 Free PMC article.
-
Improvement of bioactive metabolite production in microbial cultures-A systems approach by OSMAC and deconvolution-based 1 HNMR quantification.Magn Reson Chem. 2019 Aug;57(8):458-471. doi: 10.1002/mrc.4874. Epub 2019 May 30. Magn Reson Chem. 2019. PMID: 30993742
-
Extending the "One Strain Many Compounds" (OSMAC) Principle to Marine Microorganisms.Mar Drugs. 2018 Jul 23;16(7):244. doi: 10.3390/md16070244. Mar Drugs. 2018. PMID: 30041461 Free PMC article. Review.
-
Big effects from small changes: possible ways to explore nature's chemical diversity.Chembiochem. 2002 Jul 2;3(7):619-27. doi: 10.1002/1439-7633(20020703)3:7<619::AID-CBIC619>3.0.CO;2-9. Chembiochem. 2002. PMID: 12324995 Review.
Cited by
-
Induction of metabolic variability of the endophytic fungus Xylaria sp. by OSMAC approach and experimental design.Arch Microbiol. 2021 Aug;203(6):3025-3032. doi: 10.1007/s00203-021-02283-w. Epub 2021 Mar 29. Arch Microbiol. 2021. PMID: 33779769
-
Induction of New Aromatic Polyketides from the Marine Actinobacterium Streptomyces griseorubiginosus through an OSMAC Approach.Mar Drugs. 2023 Oct 3;21(10):526. doi: 10.3390/md21100526. Mar Drugs. 2023. PMID: 37888461 Free PMC article.
-
Chemical Elicitors of Antibiotic Biosynthesis in Actinomycetes.Microorganisms. 2018 Jun 8;6(2):52. doi: 10.3390/microorganisms6020052. Microorganisms. 2018. PMID: 29890642 Free PMC article. Review.
-
Study on secondary metabolites of endophytic fungus Diaporthe sp. AC1 induced by tryptophan analogs.Front Microbiol. 2023 Oct 9;14:1254609. doi: 10.3389/fmicb.2023.1254609. eCollection 2023. Front Microbiol. 2023. PMID: 37876783 Free PMC article.
-
Cost-effective hybrid long-short read assembly delineates alternative GC-rich Streptomyces hosts for natural product discovery.Synth Syst Biotechnol. 2023 Mar 10;8(2):253-261. doi: 10.1016/j.synbio.2023.03.001. eCollection 2023 Jun. Synth Syst Biotechnol. 2023. PMID: 37007277 Free PMC article.
References
-
- Leeds J.A., Schmitt E.K., Krastel P. Recent developments in antibacterial drug discovery: microbe-derived natural products–from collection to the clinic. Expert Opin Investig Drugs. 2006;15:211–226. - PubMed
-
- Lew W., Pai M., Oxlade O., Martin D., Menzies D. Initial drug resistance and tuberculosis treatment outcomes: systematic review and meta-analysis. Ann Intern Med. 2008;149:123–134. - PubMed
-
- Lam K.S. Discovery of novel metabolites from marine actinomycetes. Curr Opin Microbiol. 2006;9:245–251. - PubMed
LinkOut - more resources
Full Text Sources
Other Literature Sources
Research Materials
Miscellaneous
