Within-Day, Between-Day, and Between-Week Variability of Urinary Concentrations of Phenol Biomarkers in Pregnant Women
- PMID: 29553460
- PMCID: PMC6071804
- DOI: 10.1289/EHP1994
Within-Day, Between-Day, and Between-Week Variability of Urinary Concentrations of Phenol Biomarkers in Pregnant Women
Abstract
Background: Toxicology studies have shown adverse effects of developmental exposure to industrial phenols. Evaluation in humans is challenged by potentially marked within-subject variability of phenol biomarkers in pregnant women, which is poorly characterized.
Objectives: We aimed to characterize within-day, between-day, and between-week variability of phenol urinary biomarker concentrations during pregnancy.
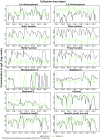
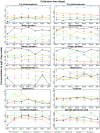
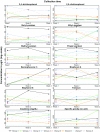
Methods: In eight French pregnant women, we collected all urine voids over a 1-wk period (average, 60 samples per week per woman) at three occasions (15±2, 24±2, and 32±1 gestational weeks) in 2012-2013. Aliquots of each day and of the whole week were pooled within-subject. We assayed concentrations of 10 phenols in these pools, and, for two women, in all spot (unpooled) samples collected during a 1-wk period. We characterized variability using intraclass correlation coefficients (ICCs) with spot samples (within-day variability), daily pools (between-day variability), and weekly pools (between-week variability).
Results: For most biomarkers, the within-day variability was high (ICCs between 0.03 and 0.50). The between-day variability, based on samples pooled within each day, was much lower, with ICCs >0.60 except for bisphenol S (0.14, 95% confidence interval [CI]: 0.00, 0.39). The between-week variability differed between compounds, with triclosan and bisphenol S having the lowest ICCs (<0.3) and 2,5-dichlorophenol the highest (ICC >0.9).
Conclusion: During pregnancy, phenol biomarkers showed a strong within-day variability, while the variability between days of a given week was more limited. One biospecimen is not enough to efficiently characterize exposure; collecting biospecimens during a single week may be enough to represent well the whole pregnancy exposure for some but not all phenols. https://doi.org/10.1289/EHP1994.
Figures


Similar articles
-
Prenatal exposure to environmental phenols: concentrations in amniotic fluid and variability in urinary concentrations during pregnancy.Environ Health Perspect. 2013 Oct;121(10):1225-31. doi: 10.1289/ehp.1206335. Epub 2013 Aug 13. Environ Health Perspect. 2013. PMID: 23942273 Free PMC article.
-
An Empirical Validation of the Within-subject Biospecimens Pooling Approach to Minimize Exposure Misclassification in Biomarker-based Studies.Epidemiology. 2019 Sep;30(5):756-767. doi: 10.1097/EDE.0000000000001056. Epidemiology. 2019. PMID: 31373935 Free PMC article.
-
Associations between urinary phenol and paraben concentrations and markers of oxidative stress and inflammation among pregnant women in Puerto Rico.Int J Hyg Environ Health. 2015 Mar;218(2):212-9. doi: 10.1016/j.ijheh.2014.11.001. Epub 2014 Nov 18. Int J Hyg Environ Health. 2015. PMID: 25435060 Free PMC article.
-
Early-Life Exposure to a Mixture of Phenols and Phthalates in Relation to Child Social Behavior: Applying an Evidence-Based Prioritization to a Cohort with Improved Exposure Assessment.Environ Health Perspect. 2023 Aug;131(8):87006. doi: 10.1289/EHP11798. Epub 2023 Aug 9. Environ Health Perspect. 2023. PMID: 37556305 Free PMC article. Review.
-
Folic acid supplementation and malaria susceptibility and severity among people taking antifolate antimalarial drugs in endemic areas.Cochrane Database Syst Rev. 2022 Feb 1;2(2022):CD014217. doi: 10.1002/14651858.CD014217. Cochrane Database Syst Rev. 2022. PMID: 36321557 Free PMC article.
Cited by
-
How Many Urine Samples Are Needed to Accurately Assess Exposure to Non-Persistent Chemicals? The Biomarker Reliability Assessment Tool (BRAT) for Scientists, Research Sponsors, and Risk Managers.Int J Environ Res Public Health. 2020 Dec 6;17(23):9102. doi: 10.3390/ijerph17239102. Int J Environ Res Public Health. 2020. PMID: 33291237 Free PMC article.
-
Comparison of strategies to efficiently combine repeated urine samples in biomarker-based studies.Environ Res. 2021 Jan;192:110275. doi: 10.1016/j.envres.2020.110275. Epub 2020 Oct 3. Environ Res. 2021. PMID: 33022216 Free PMC article.
-
Variability of Urinary Concentrations of Phenols, Parabens, and Triclocarban during Pregnancy in First Morning Voids and Pooled Samples.Environ Sci Technol. 2021 Dec 7;55(23):16001-16010. doi: 10.1021/acs.est.1c04140. Epub 2021 Nov 24. Environ Sci Technol. 2021. PMID: 34817155 Free PMC article.
-
Use of personal care products during pregnancy in relation to urinary concentrations of select phenols: A longitudinal analysis from the SEPAGES feasibility study.Int J Hyg Environ Health. 2020 Jun;227:113518. doi: 10.1016/j.ijheh.2020.113518. Epub 2020 Apr 9. Int J Hyg Environ Health. 2020. PMID: 32279061 Free PMC article.
-
Variability and Longitudinal Trajectories of Phthalate and Replacement Biomarkers across Pregnancy in the Human Placenta and Phthalates Study.Environ Sci Technol. 2023 Sep 5;57(35):13036-13046. doi: 10.1021/acs.est.3c04043. Epub 2023 Aug 22. Environ Sci Technol. 2023. PMID: 37607343 Free PMC article.
References
Publication types
MeSH terms
Substances
Grants and funding
LinkOut - more resources
Full Text Sources
Other Literature Sources

