. 2018 May;15(5):343-346.
doi: 10.1038/nmeth.4636. Epub 2018 Mar 19.

SpatialDE: identification of spatially variable genes

Affiliations

SpatialDE: identification of spatially variable genes

Valentine Svensson et al. Nat Methods. 2018 May.

Abstract

Technological advances have made it possible to measure spatially resolved gene expression at high throughput. However, methods to analyze these data are not established. Here we describe SpatialDE, a statistical test to identify genes with spatial patterns of expression variation from multiplexed imaging or spatial RNA-sequencing data. SpatialDE also implements 'automatic expression histology', a spatial gene-clustering approach that enables expression-based tissue histology.


Conflict of interest statement

Competing financial interests

The authors declare no financial conflicts of interest.

Figures

Figure 1
Figure 1. Overview of SpatialDE for the identification of spatially variable genes.
(A) In spatial gene expression studies, expression levels are measured as a function of spatial coordinates of cells or samples. SpatialDE defines spatial dependence for a given gene using a non-parametric regression model, testing whether gene expression levels at different locations co-vary in a manner that depends on their relative location, and thus are spatially variable. (B) SpatialDE partitions expression variation into a spatial component (using functional dependencies f(x1, x2)), characterized by spatial covariance, and independent observation noise (ψ). Representative simulated expression patterns are plotted below the corresponding covariance matrices for the null model (None) and the alternative model (Spatial covariance) with different lengthscales. (C) Automatic expression histology uses spatial clustering to model the expression levels of spatially variable genes using a set of unobserved tissue structure patterns. Both the underlying patterns and the gene-pattern assignments are learned from data.
Figure 2
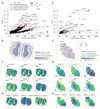
Figure 2. Application of SpatialDE to spatial transcriptomics and SeqFISH data.
(A) Fraction of variance explained by spatial variation (FSV) versus significance of spatial variation (SpatialDE negative log P-value) for all genes in the mouse olfactory bulb data. Dashed line corresponds to FDR=0.05 significance level (N=67 SV genes, Q-value adjusted). Genes are classified as periodically variable (N=19) or with a general spatial dependency (N=48). Classical histological marker genes highlighted in Stahl et al are in red text. Point size indicates uncertainty of FSV estimates; CI, confidence intervals. The X symbol shows the result of applying SpatialDE to the estimated total RNA content per spot. (B) Hematoxylin and eosin image for mouse olfactory bulb data from Stahl et al. (C) Visualization of selected SV genes. Orange bar shows fitted period length for genes with periodic dependencies; blue bar shows fitted length scale for genes with general spatial trends. 2D plots depict expression level for genes across the tissue section coded in color. Asterisks denote statistical significance of spatial variation (* FDR < 0.05, ** FDR < 0.01, *** FDR < 0.001). Insets in lower left show the posterior probability for gene assignments as general spatial, periodic spatial, or linear trend. (D) Example histological expression patterns identified by automatic expression histology analysis, with expression levels encoded in color. The number of genes assigned to each pattern are noted. (E) Proportion of spatial variance versus significance of spatial variation (SpatialDE negative log P-value) for all 249 genes in the SeqFISH data from a region of mouse hippocampus from Shah et al, as in A, showing genes with linear dependency in green. (F) Voronoi tessellation representative of tissue structure. (G) Expression of selected SV genes (out of 32, FDR < 0.05, Q-value adjusted) with linear (htr3a), periodic (foxj1), and general spatial trends. Black arrows indicate distinct region of low expression of Mog, Myl14 and Ndnf. (H) Three examples of histological expression patterns identified by AEH.

Comment in

References

    1. Lee JH. Quantitative approaches for investigating the spatial context of gene expression. Wiley Interdiscip Rev Syst Biol Med. 2017;9 - PMC - PubMed
    1. Achim K, et al. High-throughput spatial mapping of single-cell RNA-seq data to tissue of origin. Nat Biotechnol. 2015;33:503–509. - PubMed
    1. Satija R, Farrell JA, Gennert D, Schier AF, Regev A. Spatial reconstruction of single-cell gene expression data. Nat Biotechnol. 2015;33:495–502. - PMC - PubMed
    1. Junker JP, et al. Genome-wide RNA Tomography in the zebrafish embryo. Cell. 2014;159:662–675. - PubMed
    1. Chen J, et al. Spatial transcriptomic analysis of cryosectioned tissue samples with Geo-seq. Nat Protoc. 2017;12:566–580. - PubMed

Publication types