. 2018 Apr;38(1_suppl):54S-65S.
doi: 10.1177/0272989X17711928.

Simulating the Impact of Risk-Based Screening and Treatment on Breast Cancer Outcomes with MISCAN-Fadia

Affiliations

Simulating the Impact of Risk-Based Screening and Treatment on Breast Cancer Outcomes with MISCAN-Fadia

Jeroen J van den Broek et al. Med Decis Making. 2018 Apr.

Abstract

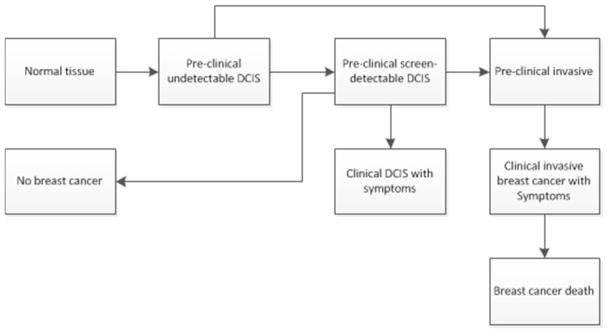
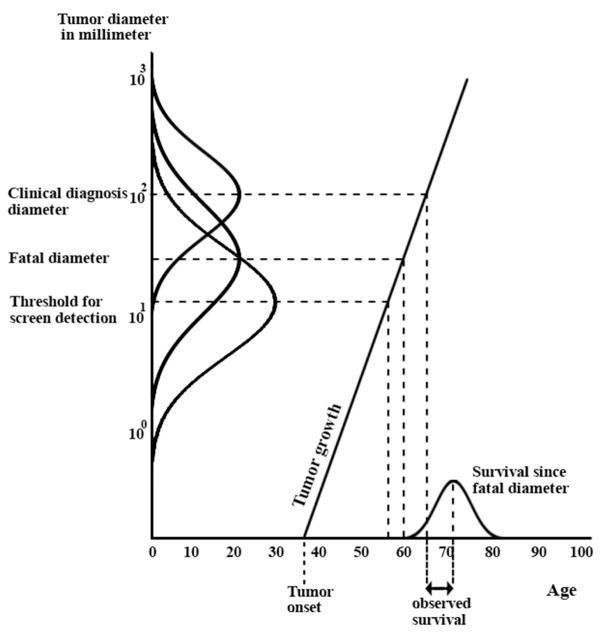
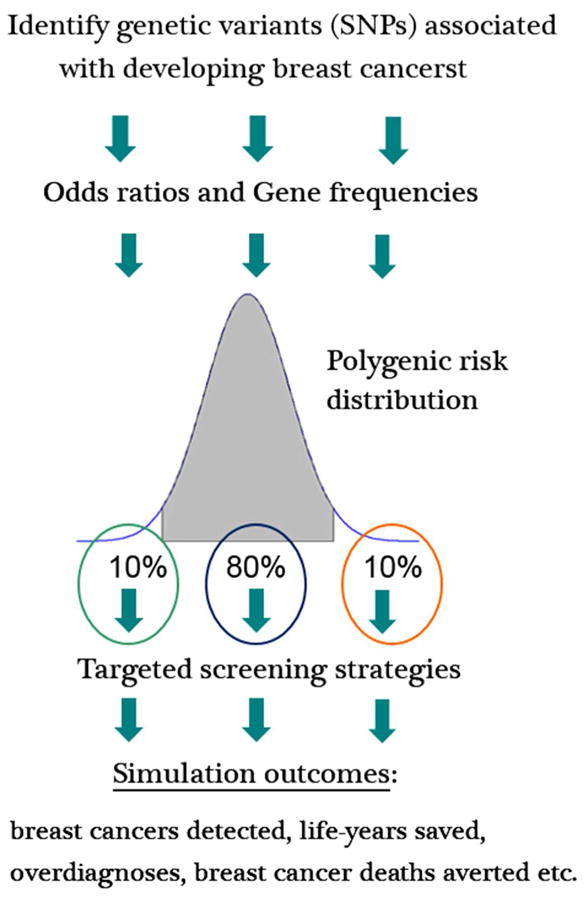
The MISCAN-Fadia microsimulation model uses continuous tumor growth to simulate the natural history of breast cancer and has been used extensively to estimate the impact of screening and adjuvant treatment on breast cancer incidence and mortality trends. The model simulates individual life histories from birth to death, with and without breast cancer, in the presence and in the absence of screening and treatment. Life histories are simulated according to discrete events such as birth, tumor inception, the tumor's clinical diagnosis diameter in the absence of screening, and death from breast cancer or death from other causes. MISCAN-Fadia consists of 4 main components: demography, natural history of breast cancer, screening, and treatment. Screening impact on the natural history of breast cancer is assessed by simulating continuous tumor growth and the "fatal diameter" concept. This concept implies that tumors diagnosed at a size that is between the screen detection threshold and the fatal diameter are cured, while tumors diagnosed at a diameter larger than the fatal tumor diameter metastasize and lead to breast cancer death. MISCAN-Fadia has been extended by including a different natural history for molecular subtypes based on a tumor's estrogen receptor (ER) status and human epidermal growth factor receptor 2 (HER2) status. In addition, personalized screening strategies that target women based on their risk such as breast density have been incorporated into the model. This personalized approach to screening will continue to develop in light of potential polygenic risk stratification possibilities and new screening modalities.

Keywords: breast cancer epidemiology; microsimulation model; risk-based breast cancer screening.


Figures

Figure 1
Figure 1
Ductal carcinoma in situ model in MISCAN-Fadia. Once a breast lesion emerges from normal breast tissue, a woman is in the preclinical undetectable DCIS phase. The two possible transitions from there are either: preclinical screen detectable DCIS or preclinical invasive breast cancer. From the preclinical screen detectable DCIS phase the tumor may regress and the woman will end up in the ‘No Breast Cancer’ pool. However, from the preclinical screen detectable DCIS phase the tumor may also progress to preclinical invasive breast cancer or the tumor may cause clinical symptoms and a DCIS case will be diagnosed as a result of clinical symptoms. If a tumor is in the preclinical invasive breast cancer state, the cancer may be screen detected or cause clinical symptoms that lead to a clinical breast cancer diagnosis. Depending on the moment of diagnosis and the type of treatment a women may cure or die from breast cancer.
Figure 2
Figure 2
The MISCAN-Fadia breast cancer natural history model. After tumor onset, the values of six tumor characteristics are generated: growth rate of the tumor, the tumor’s fatal diameter that represents distant metastasis, survival time after reaching the fatal diameter, screen detectability diameter (threshold), and the clinical diagnosis diameter. The distribution curves on the y-axis demonstrate the probabilistic nature of the simulations and the variation between the screen-detection, fatal and clinical diagnosis diameter of tumors. The growth rate of the tumor determines the times since its initiation at which the tumor reaches the screen detectability diameter, the clinical diagnosis diameter, and the fatal diameter. If in the absence of screening the clinical diagnosis diameter is larger than the fatal diameter, the woman will die of breast cancer and the observed survival time is given as depicted in Figure 2. A woman will be cured if the breast cancer is detected, either clinically or through screening, before the fatal diameter is reached. Treatment (not shown in Figure 2) is modeled as a shift in fatal diameter and may affect survival and in the best scenario cause of death.
Figure 3
Figure 3
Simulating a personalized approach to breast cancer screening based on genetic risk profile. Genetic variants for breast cancer have different risk alleles. Multiple single nucleotide polymorphisms (SNPs) combined together can be translated into a polygenic risk score to stratify women based on their polygenic risk. In Figure 3, a simplified analysis of the potential population impact of using polygenic risk to inform screening strategies is demonstrated by dividing the population into three (low, median, high) risk groups with varying prevalence. In this simplified example 10% of the population has a low risk of developing breast cancer, 80% an average risk, and 10% a high risk. More frequent screening could be offered to the high risk group and less frequent screening (compared to average risk group) could be offered to the low risk group. With more risk groups, or even a continuous risk distribution we could potentially optimize the tailoring of screening strategies based on polygenic risk which would lead to a redistribution of benefits and harms compared to current practice. A more in depth analysis will be performed in the near future within CISNET.

Similar articles

Cited by

References

    1. Habbema JD, van Oortmarssen GJ, Lubbe JT, van der Maas PJ. The MISCAN simulation program for the evaluation of screening for disease. Comput Methods Programs Biomed. 1985;20(1):79–93. - PubMed
    1. Boer R, de Koning H, van Oortmarssen G, Warmerdam P, van der Maas P. Stage distribution at first and repeat examinations in breast cancer screening. J Med Screen. 1999;6(3):132–8. - PubMed
    1. Mandelblatt JS, Near AM, Miglioretti DL, Munoz D, Sprague BL, Trentham-Dietz A, et al. Common Model Inputs used in CISNET Collaborative Breast Cancer Modeling Medical Decision Making. 2016 submitted. - PMC - PubMed
    1. Tabar L, Fagerberg G, Duffy SW, Day NE, Gad A, Grontoft O. Update of the Swedish two-county program of mammographic screening for breast cancer. Radiol Clin North Am. 1992;30(1):187–210. - PubMed
    1. Tabar L, Fagerberg G, Day NE, Duffy SW. The Swedish two-county trial of mammographic screening for breast cancer: recent results on mortality and tumor characteristics. Pathol Biol (Paris) 1992;39(9):846. - PubMed

Publication types

Substances