. 2018 Apr;38(1_suppl):99S-111S.
doi: 10.1177/0272989X17711927.

The University of Wisconsin Breast Cancer Epidemiology Simulation Model: An Update

Affiliations

The University of Wisconsin Breast Cancer Epidemiology Simulation Model: An Update

Oguzhan Alagoz et al. Med Decis Making. 2018 Apr.

Abstract

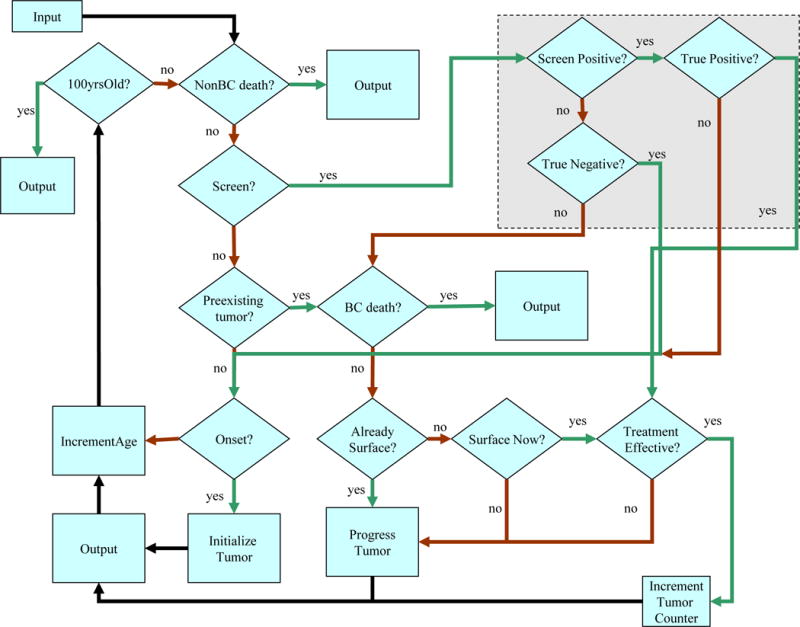
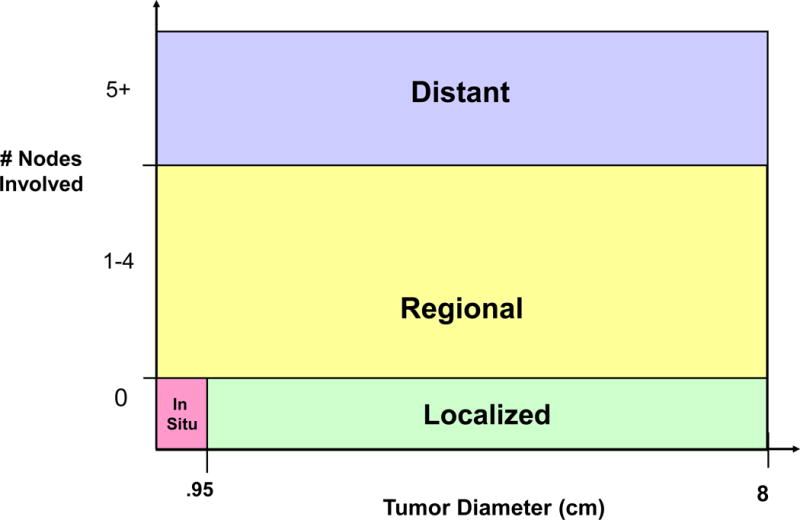
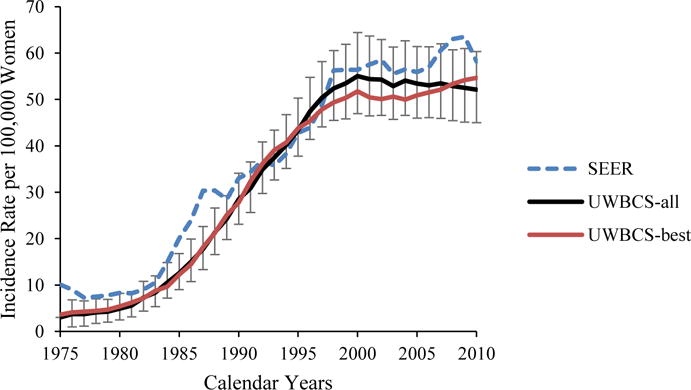
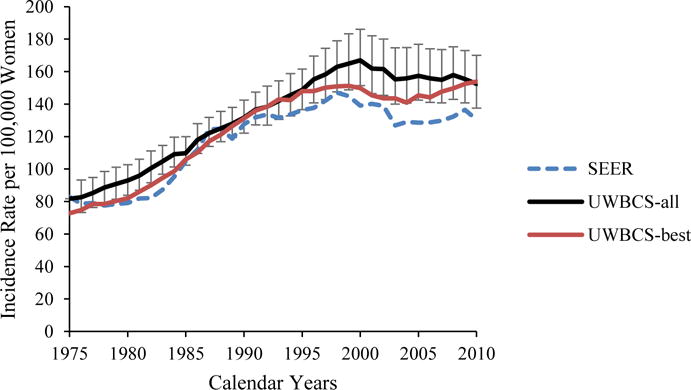
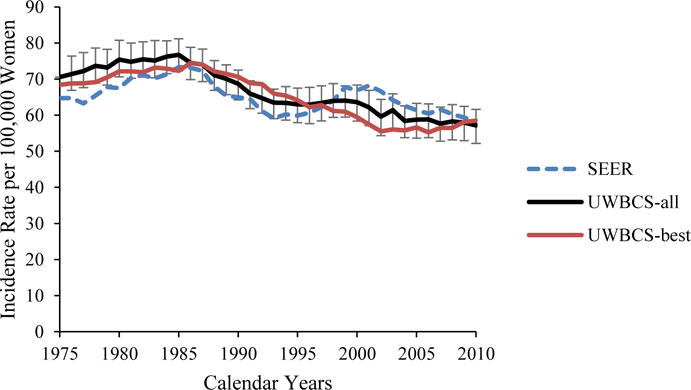
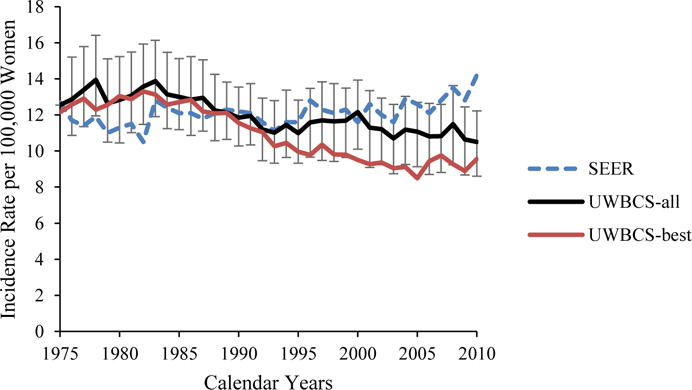
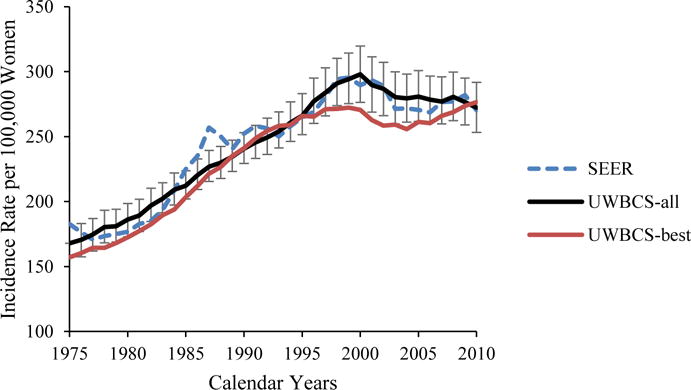
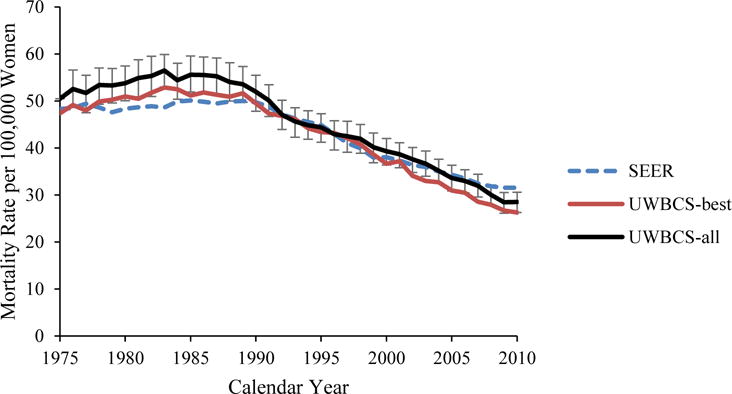
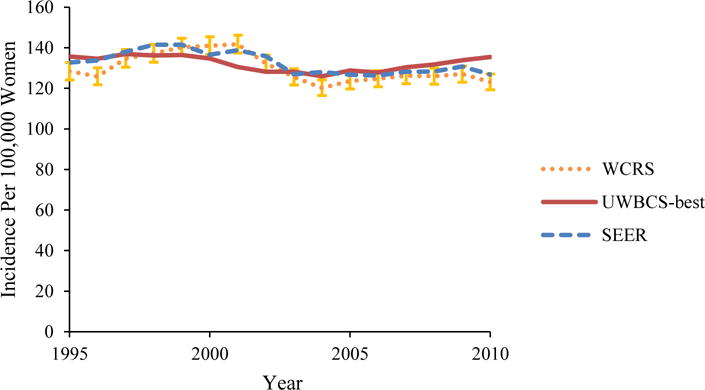
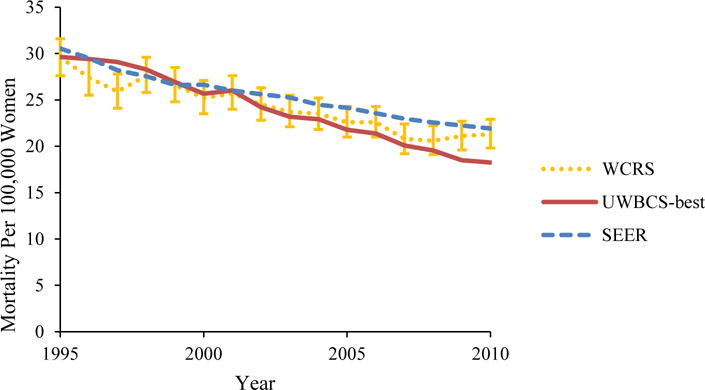
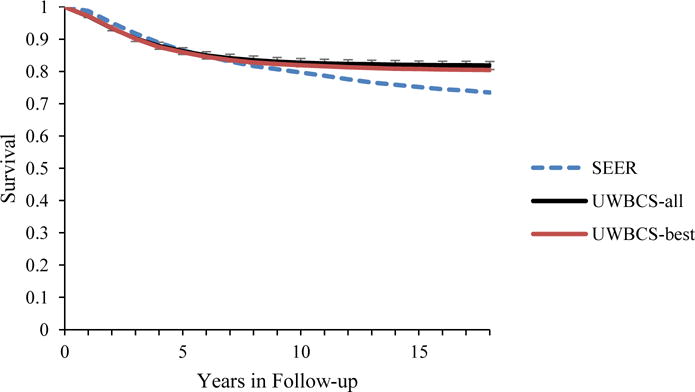
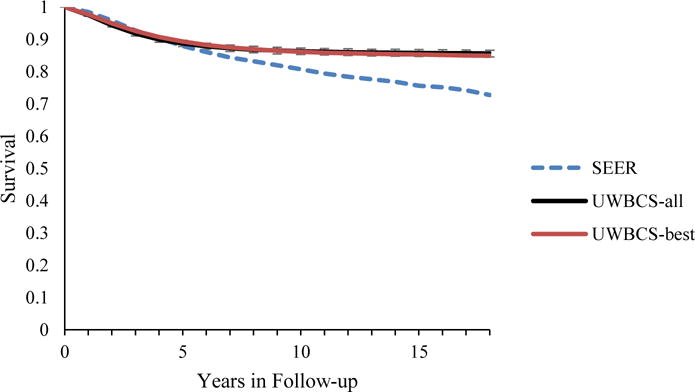
The University of Wisconsin Breast Cancer Epidemiology Simulation Model (UWBCS), also referred to as Model W, is a discrete-event microsimulation model that uses a systems engineering approach to replicate breast cancer epidemiology in the US over time. This population-based model simulates the lifetimes of individual women through 4 main model components: breast cancer natural history, detection, treatment, and mortality. A key feature of the UWBCS is that, in addition to specifying a population distribution in tumor growth rates, the model allows for heterogeneity in tumor behavior, with some tumors having limited malignant potential (i.e., would never become fatal in a woman's lifetime if left untreated) and some tumors being very aggressive based on metastatic spread early in their onset. The model is calibrated to Surveillance, Epidemiology, and End Results (SEER) breast cancer incidence and mortality data from 1975 to 2010, and cross-validated against data from the Wisconsin cancer reporting system. The UWBCS model generates detailed outputs including underlying disease states and observed clinical outcomes by age and calendar year, as well as costs, resource usage, and quality of life associated with screening and treatment. The UWBCS has been recently updated to account for differences in breast cancer detection, treatment, and survival by molecular subtypes (defined by ER/HER2 status), to reflect the recent advances in screening and treatment, and to consider a range of breast cancer risk factors, including breast density, race, body-mass-index, and the use of postmenopausal hormone therapy. Therefore, the model can evaluate novel screening strategies, such as risk-based screening, and can assess breast cancer outcomes by breast cancer molecular subtype. In this article, we describe the most up-to-date version of the UWBCS.

Keywords: breast cancer; incidence; screening; simulation.


Figures

Figure 1
Figure 1
Simulation Flowchart of the UWBCS
Figure 2
Figure 2
Translation of Tumor size and Nodal Involvement in the Model to SEER staging
Figure 3
Figure 3. Incidence and Mortality over time compared to SEER
UWBCS-best represents the outcomes obtained when the best input vector is used and UWBCS-all represents the outcomes obtained when 310 input vectors that have a score of 9 or less are used. The errors bars around UWBCS-all represent 95% “uncertainty intervals,” which are generated using the 2.5th and 97.5th percentiles’ values among 310 vectors at each annual time point for each model output. (a) Age-Adjusted (30–79 years) Insitu Breast Cancer Incidence (b) Age-Adjusted (30–79 years) Localized Breast Cancer Incidence (c) Age-Adjusted (30–79 years) Regional Breast Cancer Incidence (d) Age-Adjusted (30–79 years) Distant Breast Cancer Incidence (e) Overall Age-Adjusted (30–79 years) Breast Cancer Incidence (f) Age-Adjusted (30–79 years) Breast Cancer Mortality
Figure 4
Figure 4. Female Breast Cancer Incidence and Mortality over Time in the UWBCS Compared to the Wisconsin Cancer Reporting System (WCRS) and the SEER Program
UWBCS-best represents the outcomes obtained when the best input vector is used (a) Age-Adjusted (all ages) Breast Cancer Incidence (b) Age-Adjusted (all ages) Breast Cancer Mortality
Figure 5
Figure 5. Survival after Diagnosis Compared to SEER According to Age, Years of Follow-up and Estrogen Receptor (ER) status (1990–1994)
UWBCS-best represents the outcomes obtained when the best input vector is used and UWBCS-all represents the outcomes obtained when 310 input vectors that have a score of 9 or less are used. The errors bars around UWBCS-all represent 95% “uncertainty intervals,” which are generated using the 2.5th and 97.5th percentiles’ values among 310 vectors at each annual time point for each model output. Note that some of the error bars are very narrow therefore are not clearly visible in all of the figures. (a) All cancers (40–49 years) (b) All cancers (50–59 years) (c) All cancers (60–69 years) (d) All cancers (70–84 years) (e) ER- cases (50–59 years) (f) ER- cases (50–59 years)

Similar articles

Cited by

References

    1. Berry DA, Cronin KA, Plevritis SK, Fryback DG, Clarke L, Zelen M, et al. Effect of screening and adjuvant therapy on mortality from breast cancer. New England Journal of Medicine. 2005;353(17):1784–92. - PubMed
    1. Fryback DG, Stout NK, Rosenberg MA, Trentham-Dietz A, Kuruchittham V, Remington PL. The Wisconsin breast cancer epidemiology simulation model. Journal of the National Cancer Institute Monographs. 2006;36:37. - PubMed
    1. Cancer Intervention and Surveillance Modeling Network (CISNET) Breast Cancer Model Profiles. 2016 Jun 27; Available from http://cisnetcancergov/breast/profileshtml 2016.
    1. Kelton WD, Law AM. Simulation modeling and analysis. McGraw Hill; Boston: 2000.
    1. Holford TR, Cronin KA, Mariotto AB, Feuer EJ. Changing patterns in breast cancer incidence trends. Journal of the National Cancer Institute Monographs. 2005;(36):19–25. - PubMed

Publication types

MeSH terms