Comparative Study
. 2018 Apr;38(1_suppl):112S-125S.
doi: 10.1177/0272989X17743244.

Comparing CISNET Breast Cancer Models Using the Maximum Clinical Incidence Reduction Methodology

Affiliations
Comparative Study

Comparing CISNET Breast Cancer Models Using the Maximum Clinical Incidence Reduction Methodology

Jeroen J van den Broek et al. Med Decis Making. 2018 Apr.

Abstract

Background: Collaborative modeling has been used to estimate the impact of potential cancer screening strategies worldwide. A necessary step in the interpretation of collaborative cancer screening model results is to understand how model structure and model assumptions influence cancer incidence and mortality predictions. In this study, we examined the relative contributions of the pre-clinical duration of breast cancer, the sensitivity of screening, and the improvement in prognosis associated with treatment of screen-detected cases to the breast cancer incidence and mortality predictions of 5 Cancer Intervention and Surveillance Modeling Network (CISNET) models.

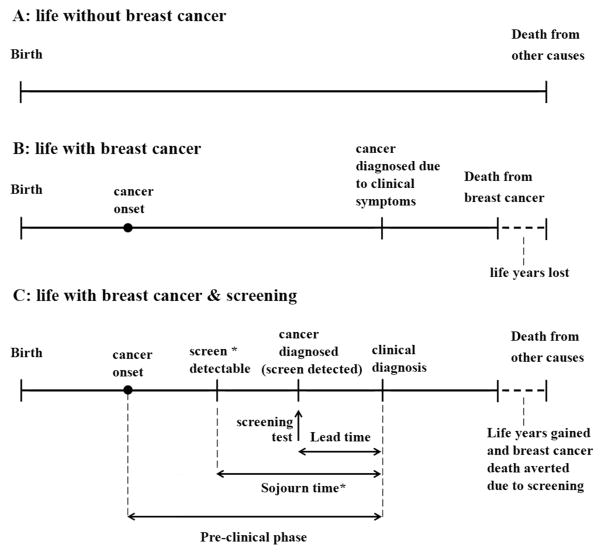
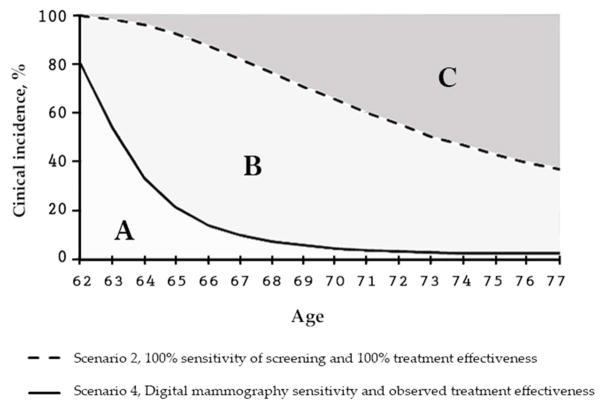
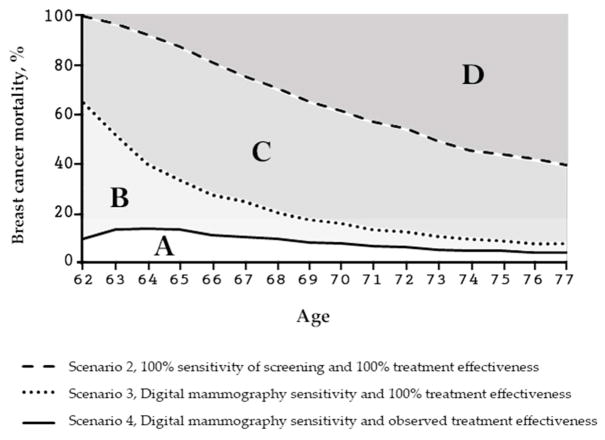
Methods: To tease out the impact of model structure and assumptions on model predictions, the Maximum Clinical Incidence Reduction (MCLIR) method compares changes in the number of breast cancers diagnosed due to clinical symptoms and cancer mortality between 4 simplified scenarios: 1) no-screening; 2) one-time perfect screening exam, which detects all existing cancers and perfect treatment (i.e., cure) of all screen-detected cancers; 3) one-time digital mammogram and perfect treatment of all screen-detected cancers; and 4) one-time digital mammogram and current guideline-concordant treatment of all screen-detected cancers.

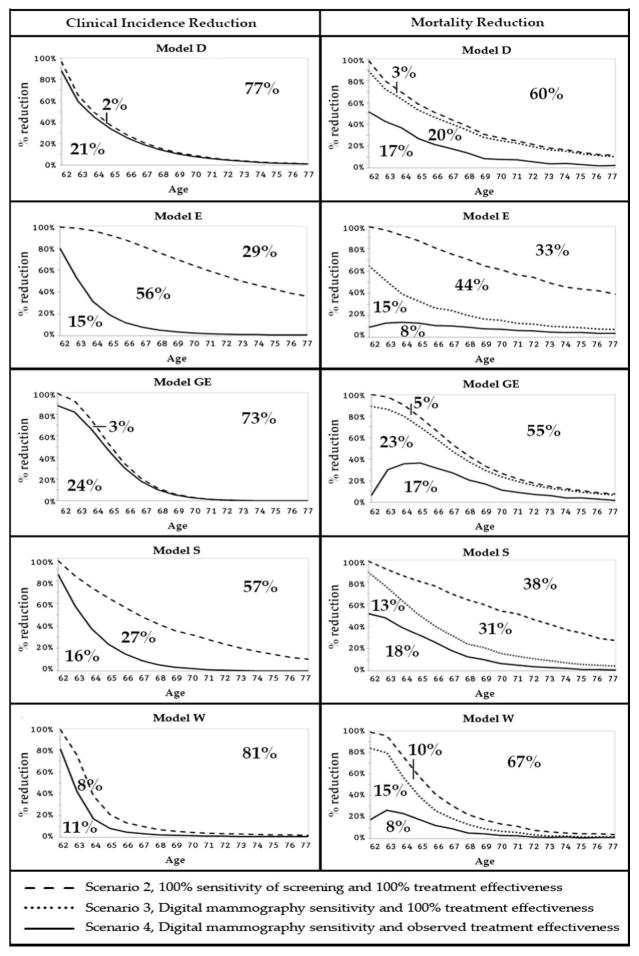
Results: The 5 models predicted a large range in maximum clinical incidence (19% to 71%) and in breast cancer mortality reduction (33% to 67%) from a one-time perfect screening test and perfect treatment. In this perfect scenario, the models with assumptions of tumor inception before it is first detectable by mammography predicted substantially higher incidence and mortality reductions than models with assumptions of tumor onset at the start of a cancer's screen-detectable phase. The range across models in breast cancer clinical incidence (11% to 24%) and mortality reduction (8% to 18%) from a one-time digital mammogram at age 62 y with observed sensitivity and current guideline-concordant treatment was considerably smaller than achievable under perfect conditions.

Conclusions: The timing of tumor inception and its effect on the length of the pre-clinical phase of breast cancer had a substantial impact on the grouping of models based on their predictions for clinical incidence and breast cancer mortality reduction. This key finding about the timing of tumor inception will be included in future CISNET breast analyses to enhance model transparency. The MCLIR approach should aid in the interpretation of variations in model results and could be adopted in other disease screening settings to enhance model transparency.

Keywords: breast cancer natural history assumptions; maximum clinical incidence reduction; screening effectiveness.


Figures

Figure 1
Figure 1
Three versions of a woman’s life history: A, without breast cancer; B, with breast cancer and without screening; C, with breast cancer and mammography screening. In scenario C, the preclinical phase is the period of time between tumor inception and clinical diagnosis in the absence of screening. The sojourn time for a screening test, e.g., mammography is the period of time within the preclinical phase that a cancer can be screen detectable; this period can also be termed the preclinical screen-detectable phase. The point when the cancer is detected by screening depends on when the screening test is performed and the sensitivity of the screening test. The period before the sojourn time represents a period in which the tumor is present but undetectable by mammography. Should the sensitivity of mammography improve, or new types of screening tests evolve, the point of screen-detectability would shift to the left and tumors could be detected closer to tumor inception.
Figure 2
Figure 2
The MCLIR metrics explained for breast cancer incidence. Overall reductions in breast cancer incidence at 15-year follow-up: The light gray area denoted by A is the overall clinical incidence reduction over the 15 years after the digital mammogram at age 62. The area B alone represents the proportion of clinical incidence that could not be reduced because of the non-perfect sensitivity of the digital mammogram. As a digital mammogram does not detect all tumors in existence, the area B provides a measure of the room to further reduce breast cancer clinical incidence if better (more sensitive) screening would become available. The 2 light gray areas combined (A and B) are the maximum clinical incidence reduction from perfect screening. The dark gray area denoted by C, is the proportion of clinical incidence that is not reducible by a perfect screen at age 62 because these clinical cancers had a tumor onset after age 62. Age-specific reductions in breast cancer incidence: Scenario 1, the no-screening scenario, serves as comparator from which the reductions, as measured on the y-axis, are calculated. Scenario 2 (dashed line) is the age-specific percent reduction in clinical incidence from one perfect screening test at age 62 with perfect sensitivity relative to the clinical incidence in the no-screening scenario. Scenario 4 (solid line) is the age-specific percent clinical incidence reduction from one digital mammogram at age 62 relative to the no-screening scenario. Scenario 3 (also solid line) uses sensitivity of current digital mammography and in contrast to scenario 4 has perfect treatment effectiveness which only affects breast cancer mortality, and thus, scenario 3 has the same impact on breast cancer incidence as scenario 4.
Figure 3
Figure 3
The MCLIR metrics explained for breast cancer mortality. Overall reductions in breast cancer mortality at 15-year follow-up: The light gray area denoted by A is the overall breast cancer mortality reduction over the 15 years after one digital mammogram at age 62 and guideline recommended treatment with observed treatment effectiveness. The area B alone represents the proportion of breast cancer mortality that could not be reduced because of the non-perfect treatment effectiveness of current guideline recommended treatment. Since guideline recommended treatment does not cure all screen-detected cancers, B provides a measure of the room to further reduce breast cancer mortality if better (more effective) treatment would become available. The area C alone represents the proportion of breast cancer mortality that could not be reduced because of the non-perfect sensitivity of currently available digital mammography. As a digital mammogram does not detect all tumors in existence, B provides a measure of the room to further reduce breast cancer mortality if better (more sensitive) screening would become available. The 3 areas combined (A, B and C) are the maximum mortality reduction from perfect screening and perfect treatment where B + C represent the maximum room to further reduce breast cancer mortality if screening sensitivity and treatment effectiveness would become improve. The dark gray area, denoted by D, is the proportion of breast cancer deaths that is not reducible by a perfect screen at age 62 and perfect treatment because these breast cancer deaths had tumor onset after age 62. Age-specific reductions in breast cancer mortality: Scenario 1, the no-screening scenario, serves as comparator from which the reductions, as measured on the y-axis, are calculated. Scenario 2 (dashed line) is the age-specific percent breast cancer mortality reduction from one perfect screening test with perfect sensitivity and perfect treatment relative to the breast cancer mortality in the no-screening scenario. Scenario 3 (dotted line) is the age-specific percent breast cancer mortality reduction from one digital mammogram at age 62 and perfect treatment relative to the no-screening scenario. Scenario 4 (solid line) is the age-specific percent mortality reduction from one digital mammogram at age 62 and guideline-concordant treatment with observed treatment effectiveness in screen-detected cases relative to the no-screening scenario.
Figure 4
Figure 4
Age-specific reductions in breast cancer clinical incidence and mortality over 15 years after a one-time screening test at age 62 by model. The percent marks in the panels of Figure 4 represent the cumulative outcomes for the 15-year follow-up period from age 62 to age 77. The line at the top in the breast cancer incidence panels on the left of Figure 4 is the maximum clinical incidence reduction from a screening test at age 62 with 100% sensitivity and perfect treatment of screen-detected cancers (Scenario 2). Just after the screening test, the reduction in clinical incidence (panels on the left) is highest and decreases by age as it becomes less likely that clinical cancers at later ages were already in existence at age 62 and could have been prevented by a screening test at that age. The percentages in the left-panel figures represent, for example for Model S: 57% of the cancers that are clinically diagnosed in the absence of screening between ages 62 and 77 have an onset after age 62, this implies that 100-57=43% (Scenario 2, Table 3) of the cancers diagnosed in the absence of screening could be prevented from becoming clinical diagnosis at later ages by a perfect screening test at age 62. The solid line below the dashed line is the clinical incidence reduction from a digital mammography screening test: 16% of clinical diagnoses could be prevented by a one-time digital mammogram at age 62 (Scenario 3, Table 3). This implies that 27% of clinical incidence between ages 62 and 77 was not reduced by the one-time digital mammogram at age 62 (Scenario 3 vs 2). The dashed line at the top in the breast cancer mortality panels on the right of Figure 4 is the maximum achievable mortality reduction from a screening test with 100% sensitivity combined with perfect treatment in screen-detected cases (Scenario 2). The dotted line below the top line represents the breast cancer mortality reduction over the 15-years after a current digital mammogram at age 62 and perfect treatment in the screen-detected cases (Scenario 3). The solid line at the bottom is the reduction in breast cancer mortality from a current screening test combined with current treatment (Scenario 4). The percentages in these figures are, for example for Model S: 38% of breast cancer deaths observed in the scenario without screening stem from cancers with onset after age 62 and could therefore not be screen-detected and prevented from breast cancer death by screening at age 62. This implies that 100-38=42% of breast cancer deaths could be reduced by perfect screening and perfect treatment of screen-detected cases (Scenario 2, Table 4). However, 31% of breast cancer deaths are not prevented due to lack of screen-detection if screening is performed with a digital mammogram (Scenario 3 vs 2, Table 4), and 13% of breast cancer deaths is not prevented because current guideline-concordant treatment lacks the effectiveness to cure those screen-detected breast cancers (Scenario 4 vs 3). The 18% mortality reduction follows from current screening and current treatment (Scenario 4).

Similar articles

Cited by

References

    1. Lee SJ, Li X, Huang H. Models for Breast Cancer Screening Strategies Updated for Ductal Carcinoma In Situ and Subgroups Medical Decision Making. 2017 In Press.
    1. van den Broek JJ, van Ravesteyn NT, Heijnsdijk EA, de Koning HJ. Estimating the effects of risk-based screening and adjuvant treatment using the MISCAN-Fadia continuous tumor growth model for breast cancer. Medical Decision Making. 2017 In Press.
    1. Schechter CB, Near AM, Jayasekera J, Chang Y, Mandelblatt JS. Structure, Function, and Applications of the Georgetown-Einstein (GE) Breast Cancer Simulation Model Medical Decision Making. 2017 In Press. - PMC - PubMed
    1. Huang X, Li Y, Song J, Berry DA. The MD Anderson CISNET Model for Estimating Benefits of Adjuvant Therapy and Screening Mammography for Breast Cancer: An Update. Medical Decision Making. 2017 In Press.
    1. Munoz D, Xu C, Plevritis S. A Molecular Subtype-Specific Stochastic Simulation Model of US Breast Cancer Incidence and Mortality Trends from 1975 to 2010 Medical Decision Making. 2017 In Press. - PMC - PubMed

Publication types