. 2018 Mar 19;14(1):7.
doi: 10.1186/s12993-018-0139-6.

Interaction of basolateral amygdala, ventral hippocampus and medial prefrontal cortex regulates the consolidation and extinction of social fear

Affiliations

Interaction of basolateral amygdala, ventral hippocampus and medial prefrontal cortex regulates the consolidation and extinction of social fear

Chu-Chu Qi et al. Behav Brain Funct. .

Abstract

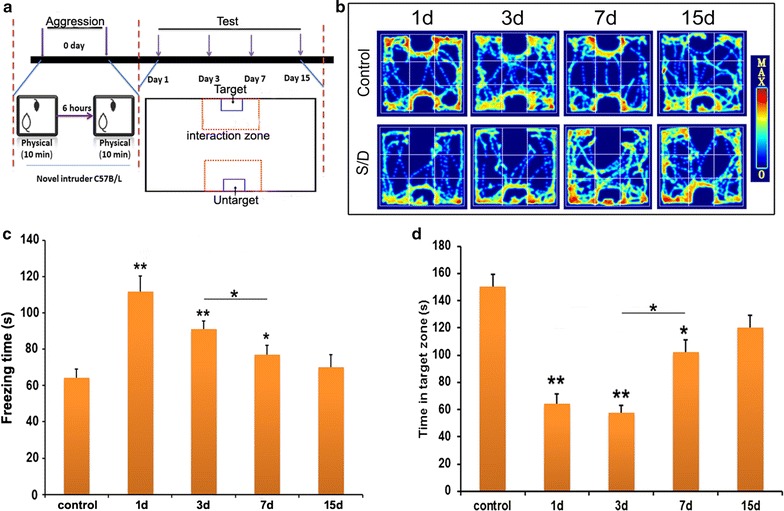
Background: Following a social defeat, the balanced establishment and extinction of aversive information is a beneficial strategy for individual survival. Abnormal establishment or extinction is implicated in the development of mental disorders. This study investigated the time course of the establishment and extinction of aversive information from acute social defeat and the temporal responsiveness of the basolateral amygdala (BLA), ventral hippocampus (vHIP) and medial prefrontal cortex (mPFC) in this process.

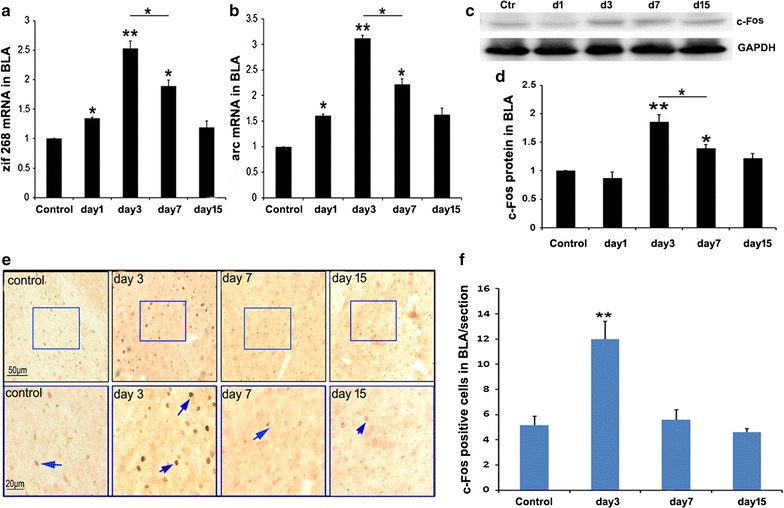
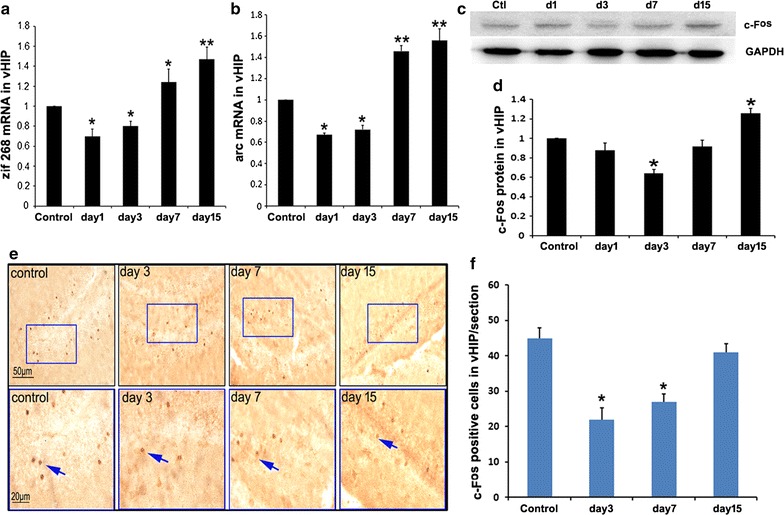
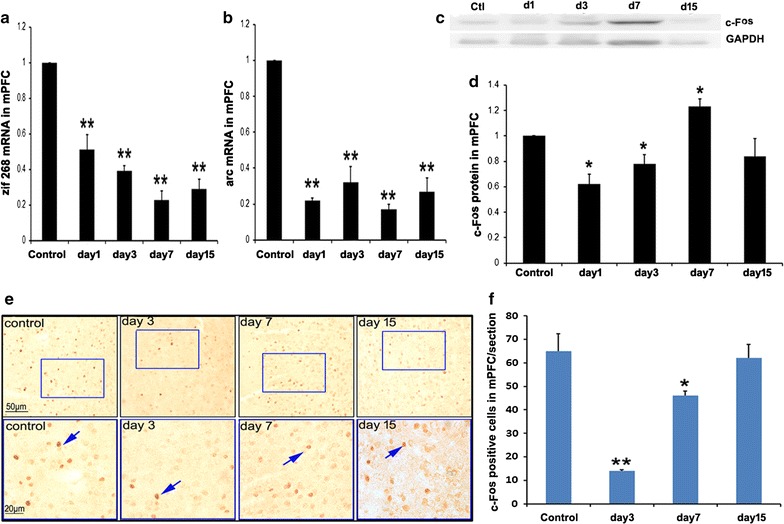
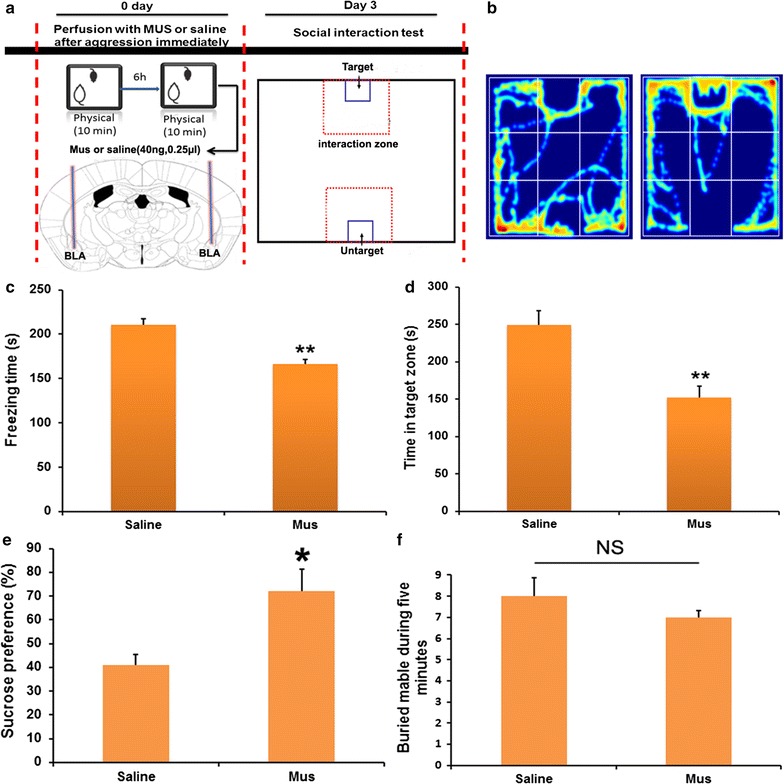
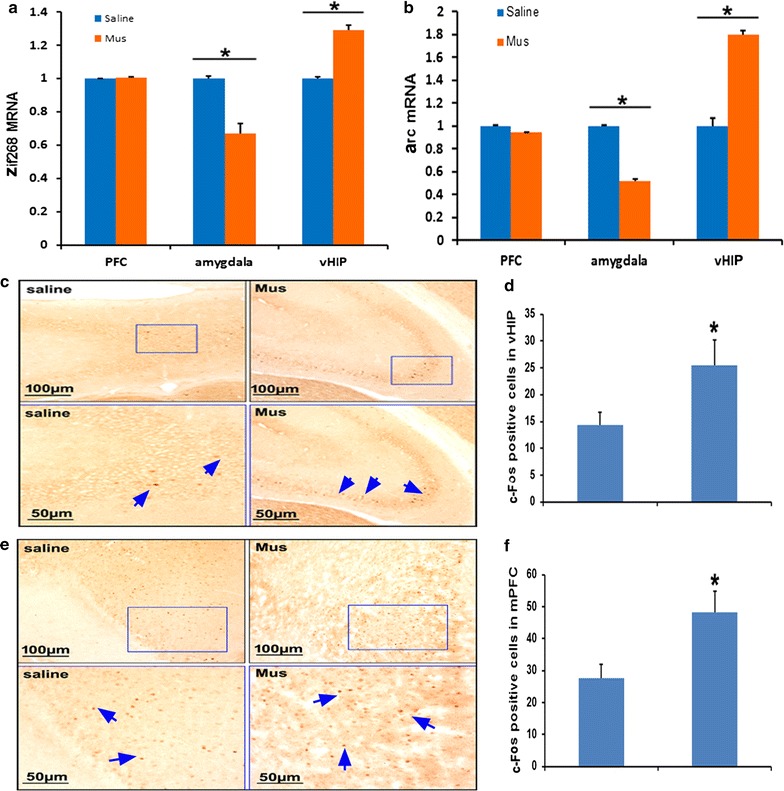
Methods: Mouse models of acute social defeat were established by using the resident-intruder paradigm. To evaluate the engram of social defeat, the intruder mice were placed into the novel context at designated time to test the social behavior. Furthermore, responses of BLA, vHIP and mPFC were investigated by analyzing the expression of immediate early genes, such as zif268, arc, and c-fos.

Results: The results showed after an aggressive attack, aversive memory was maintained for approximately 7 days before gradually diminishing. The establishment and maintenance of aversive stimulation were consistently accompanied by BLA activity. By contrast, vHIP and mPFC response was inhibited from this process. Additionally, injecting muscimol (Mus), a GABA receptor agonist, into the BLA alleviated the freezing behavior and social fear and avoidance. Simultaneously, Mus treatment decreased the zif268 and arc expression in BLA, but it increased their expression in vHIP.

Conclusion: Our data support and extend earlier findings that implicate BLA, vHIP and mPFC in social defeat. The time courses of the establishment and extinction of social defeat are particularly consistent with the contrasting BLA and vHIP responses involved in this process.

Keywords: Basolateral amygdala; Information extinction; Medial prefrontal cortex; Social defeat; Ventral hippocampus.


Figures

Fig. 1
Fig. 1
Behavioral changes after acute social aggressive stimulation. a Diagram of social aggression and social behavioral test. Social aggression is based on the resident (KM mouse)—intruder (C57B6/L mouse) paradigm. b Representative images of the track during social interaction. c Freezing time in the open field. On days 1 and 3 after stimulation, the freezing time of intruder mice was longer than that of control mice. On day 7 after stimulation, the freezing time of intruder mice was shorter than that at day 1 after stimulation but remained longer than that of control mice, one way ANOVA with Tukey’s test was used, F = 4.46, *p < 0.05, **p < 0.01 compared with control, n = 12. d Time spent in the social interaction zones. On days 1 and 3 after stimulation, intruder mice spent less time in the interaction zone than the control mice. On day 7 after stimulation, intruder mice spent more time in the interaction zone than at days 1 and 3 after stimulation but still spent less time in the interaction zone than control mice, one way ANOVA with Tukey’s test was used, F = 8.98, *p < 0.05, **p < 0.01 compared with control, n = 12
Fig. 2
Fig. 2
Response of BLA to social defeat stress. a mRNA levels of zif 268 and arc in BLA tissues gradually increased at day 1 after stimulation, peaked at day 3 after stimulation, and decreased at day 7 after stimulation compared with control mice, one way ANOVA with Tukey’s test was used, F = 21.5, *p < 0.05, **p < 0.01 compared with the control, n = 8. b mRNA levels of arc in BLA tissues gradually increased at day 1 after stimulation, peaked at day 3 after stimulation, and decreased at day 7 after stimulation compared with control mice, one way ANOVA with Tukey’s test was used, F = 26.7, *p < 0.05, **p < 0.01 compared with the control, n = 8. c Representative image of the Western blot of c-Fos. d Statistical analysis of c-Fos expression, one way ANOVA with Tukey’s test was used, F = 5.6, *p < 0.05, **p < 0.01 compared with the control, n = 8. e Representative images of c-Fos staining in BLA. Squares in the upper images indicate areas that are shown magnified in the bottom images. Blue arrows indicate c-Fos-positive cells. f Cell count in the BLA, one way ANOVA with Tukey’s test was used, F = 16.357, **p < 0.01 compared with the control, n = 4
Fig. 3
Fig. 3
Response of vHIP to social defeat stress. a mRNA levels of zif268 in vHIP tissues from intruder mice decreased at days 1 and 3 after stimulation and increased at days 7 and 15 after stimulation compared with those in the control mice, one way ANOVA with Tukey’s test was used, F = 22.233, p < 0.05, **p < 0.01 compared with the control, n = 8. b mRNA levels of arc in vHIP tissues from intruder mice decreased at days 1 and 3 after stimulation and increased at days 7 and 15 after stimulation compared with those in the control mice, one way ANOVA with Tukey’s test was used, F = 23.655, p < 0.05, ** p < 0.01 compared with the control, n = 8. c Representative Western blot image of c-Fos. d Statistical analysis of c-Fos expression, one way ANOVA with Tukey’s test was used, F = 4.73, *p < 0.05, compared with the control, n = 8. e The representative images of c-Fos staining in vHIP. Squares in the upper images indicate areas that are shown magnified in the bottom images. Blue arrows indicate c-Fos-positive cells. f Cell counts in the vHIP, one way ANOVA with Tukey’s test was used, F = 5.287, *p < 0.05 compared with control, n = 4
Fig. 4
Fig. 4
Response of mPFC to social defeat stress. a mRNA levels of zif268 in mPFC tissues from intruder mice decreased at days 1, 3, 7 and 15 after stimulation compared with the control mice, one way ANOVA with Tukey’s test was used, F = 99.345, **p < 0.01 compared with the control, n = 8. b mRNA levels of arc in mPFC tissues from intruder mice decreased at days 1, 3, 7 and 15 after stimulation compared with the control mice, one way ANOVA with Tukey’s test was used, F = 43.18, **p < 0.01 compared with the control, n = 8. c Representative Western blot image of c-Fos. d Statistical analysis of c-Fos expression, one way ANOVA with Tukey’s test was used, F = 11.4, *p < 0.05, compared with the control, n = 8. e The representative images of c-Fos staining in mPFC. Squares in the upper images indicate areas that are shown magnified in the bottom images. Blue arrows indicate c-fos-positive cells. f Cell counts in the mPFC, one way ANOVA with Tukey’s test was used, F = 23.965, *p < 0.05, **p < 0.01 compared with the control, n = 4
Fig. 5
Fig. 5
Effects of Mus microinjection to the BLA on social defeat stress. a Diagram of experimental flow. b Representative images of the moving track during social interaction. c Freezing time of intruder mice during a 5-min open-field test at day 3 after treatment. d Time spent in the social interaction zone at day 3 after treatment, compared with saline injection. e Sucrose reference at day 3 after treatment. f Marble burying test at day 3 after treatment. Independent student t test was used, *p < 0.05, **p < 0.01 compared with the saline-group, n = 8
Fig. 6
Fig. 6
Effects of Mus microinjection to the BLA on IEGs expression. a zif268 mRNA expression levels in the BLA, vHIP and mPFC. b arc mRNA expression in the BLA, vHIP and mPFC. c Representative images of c-Fos in vHIP. d Numbers of c-Fos-positive cell in vHIP were calculated and statistically analyzed. e Representative images of c-Fos in mPFC. f Numbers of c-fos-positive cell in mPFC were calculated and statistically analyzed. Independent student t test was used, *p < 0.05 compared with the saline-group, n = 4

Similar articles

Cited by

References

    1. Kessler RC, Akiskal HS, Ames M, Birnbaum H, Greenberg P, Hirschfeld RM, et al. Prevalence and effects of mood disorders on work performance in a nationally representative sample of U.S. workers. Am J Psychiatry. 2006;163(9):1561–1568. doi: 10.1176/ajp.2006.163.9.1561. - DOI - PMC - PubMed
    1. Han B, Compton WM, Blanco C, Colpe LJ. Prevalence, treatment, and unmet treatment needs of US adults with mental health and substance use disorders. Health Aff. 2017;36(10):1739–1747. doi: 10.1377/hlthaff.2017.0584. - DOI - PubMed
    1. Toyoda A. Social defeat models in animal science: what we have learned from rodent models. Anim Sci J. 2017;88(7):944–952. doi: 10.1111/asj.12809. - DOI - PMC - PubMed
    1. Blanchard DC, Griebel G, Blanchard RJ. Conditioning and residual emotionality effects of predator stimuli: some reflections on stress and emotion. Prog Neuropsychopharmacol Biol Psychiatry. 2003;27(8):1177–1185. doi: 10.1016/j.pnpbp.2003.09.012. - DOI - PubMed
    1. Treit D, Pinel JP, Fibiger HC. Conditioned defensive burying: a new paradigm for the study of anxiolytic agents. Pharmacol Biochem Behav. 1981;15(4):619–626. doi: 10.1016/0091-3057(81)90219-7. - DOI - PubMed

LinkOut - more resources