Improving cancer detection through combinations of cancer and immune biomarkers: a modelling approach
- PMID: 29554938
- PMCID: PMC5859525
- DOI: 10.1186/s12967-018-1432-8
Improving cancer detection through combinations of cancer and immune biomarkers: a modelling approach
Abstract
Background: Early cancer diagnosis is one of the most important challenges of cancer research, since in many cancers it can lead to cure for patients with early stage diseases. For epithelial ovarian cancer (which is the leading cause of death among gynaecologic malignancies) the classical detection approach is based on measurements of CA-125 biomarker. However, the poor sensitivity and specificity of this biomarker impacts the detection of early-stage cancers.
Methods: Here we use a computational approach to investigate the effect of combining multiple biomarkers for ovarian cancer (e.g., CA-125 and IL-7), to improve early cancer detection.
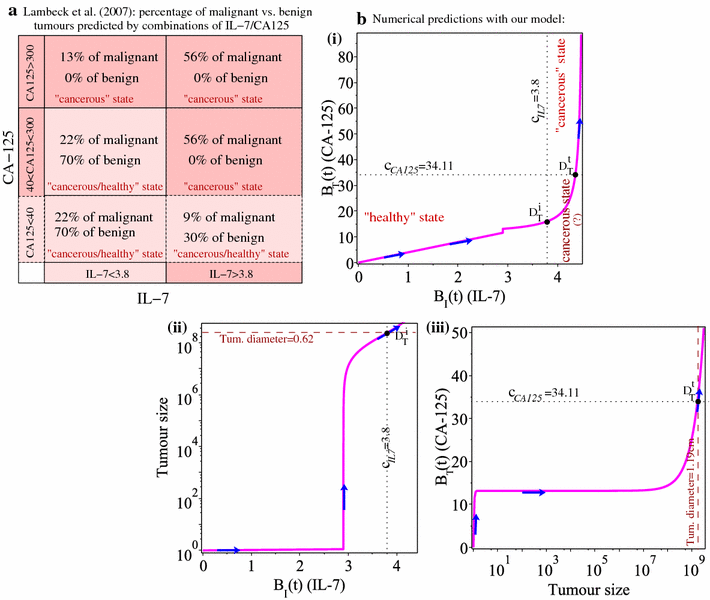
Results: We show that this combined biomarkers approach could lead indeed to earlier cancer detection. However, the immune response (which influences the level of secreted IL-7 biomarker) plays an important role in improving and/or delaying cancer detection. Moreover, the detection level of IL-7 immune biomarker could be in a range that would not allow to distinguish between a healthy state and a cancerous state. In this case, the construction of solution diagrams in the space generated by the IL-7 and CA-125 biomarkers could allow us predict the long-term evolution of cancer biomarkers, thus allowing us to make predictions on cancer detection times.
Conclusions: Combining cancer and immune biomarkers could improve cancer detection times, and any predictions that could be made (at least through the use of CA-125/IL-7 biomarkers) are patient specific.
Keywords: CA-125 biomarker; Cancer detection times; IL-7 biomarker; Mathematical model; Ovarian cancer.
Figures
Similar articles
-
Cancer screening: a mathematical model relating secreted blood biomarker levels to tumor sizes.PLoS Med. 2008 Aug 19;5(8):e170. doi: 10.1371/journal.pmed.0050170. PLoS Med. 2008. PMID: 18715113 Free PMC article.
-
Multi-biomarker panel signature as the key to diagnosis of ovarian cancer.Heliyon. 2019 Dec 5;5(12):e02826. doi: 10.1016/j.heliyon.2019.e02826. eCollection 2019 Dec. Heliyon. 2019. PMID: 31867451 Free PMC article. Review.
-
[Clinical validation of multiple biomarkers suspension array technology for ovarian cancer].Zhonghua Fu Chan Ke Za Zhi. 2017 Jan 25;52(1):11-19. doi: 10.3760/cma.j.issn.0529-567X.2017.01.005. Zhonghua Fu Chan Ke Za Zhi. 2017. PMID: 28190310 Chinese.
-
A novel algorithm to improve specificity in ovarian cancer detection.Cancer Treat Res Commun. 2018;15:32-35. doi: 10.1016/j.ctarc.2017.11.004. Epub 2017 Nov 10. Cancer Treat Res Commun. 2018. PMID: 30207285
-
The role of biomarkers in the management of epithelial ovarian cancer.Expert Rev Mol Diagn. 2017 Jun;17(6):577-591. doi: 10.1080/14737159.2017.1326820. Epub 2017 May 15. Expert Rev Mol Diagn. 2017. PMID: 28468520 Free PMC article. Review.
Cited by
-
Genetic predisposition and prediction protocol for epithelial neoplasms in disease-free individuals: A systematic review.J Oral Maxillofac Pathol. 2020 May-Aug;24(2):293-307. doi: 10.4103/jomfp.JOMFP_348_19. Epub 2020 Sep 9. J Oral Maxillofac Pathol. 2020. PMID: 33456239 Free PMC article.
-
Oncological Ligand-Target Binding Systems and Developmental Approaches for Cancer Theranostics.Mol Biotechnol. 2021 Mar;63(3):167-183. doi: 10.1007/s12033-020-00296-2. Epub 2021 Jan 9. Mol Biotechnol. 2021. PMID: 33423212 Review.
-
A hitchhiker's guide to cancer models.Trends Biotechnol. 2022 Nov;40(11):1361-1373. doi: 10.1016/j.tibtech.2022.04.003. Epub 2022 May 7. Trends Biotechnol. 2022. PMID: 35534320 Free PMC article. Review.
-
A high-performance microfluidic detection platform to conduct a novel multiple-biomarker panel for ovarian cancer screening.RSC Adv. 2021 Feb 19;11(14):8124-8133. doi: 10.1039/d0ra10200h. eCollection 2021 Feb 17. RSC Adv. 2021. PMID: 35423342 Free PMC article.
-
Modeling EV Kinetics for Use in Early Cancer Detection.Adv Biosyst. 2020 Dec;4(12):e1900305. doi: 10.1002/adbi.201900305. Epub 2020 May 12. Adv Biosyst. 2020. PMID: 32394646 Free PMC article.
References
-
- Oza AM, Cook AD, Pfisterer J, Embleton A, Ledermann JA, Pujade-Lauraine E, Kristensen G, Carey MS, Beale P, Cervantes A, Park-Simon T-W, Rustin G, Joly F, Mirza MR, Plante M, Quinn M, Poveda A, Jayson GC, Stark D, Swart AM, Farrelly L, Kaplan R, Parmar MKB, Perren TJ. Standard chemotherapy with or without bevacizumab for women with newly diagnosed ovarian cancer (ICON7): overall survival results of a phase 3 randomised trial. Lancet Oncol. 2015;16(8):928–936. doi: 10.1016/S1470-2045(15)00086-8. - DOI - PMC - PubMed
-
- Pepin K, del Carmen M, Brown A, Dizon DS. Ca125 and epithelial ovarian cancer: role in screening, diagnosis and surveillance. Am J Hematol Oncol. 2014;10(6):22.
-
- Shapira I, Oswald M, Lovecchio J, Khalili H, Menzin A, Whyte J, Santos LD, Liang S, Bhuiya T, Keogh M, Mason C, Sultan K, Budman D, Gregersen PK, Lee AT. Circulating biomarkers for detection of ovarian cancer and predicting cancer outcomes. Br J Cancer. 2014;110(4):976–983. doi: 10.1038/bjc.2013.795. - DOI - PMC - PubMed
MeSH terms
Substances
LinkOut - more resources
Full Text Sources
Other Literature Sources
Research Materials
Miscellaneous

