

Epigenetic silencing of miR-125b is required for normal B-cell development
- PMID: 29555645
- PMCID: PMC5921965
- DOI: 10.1182/blood-2018-01-824540
Epigenetic silencing of miR-125b is required for normal B-cell development
Abstract
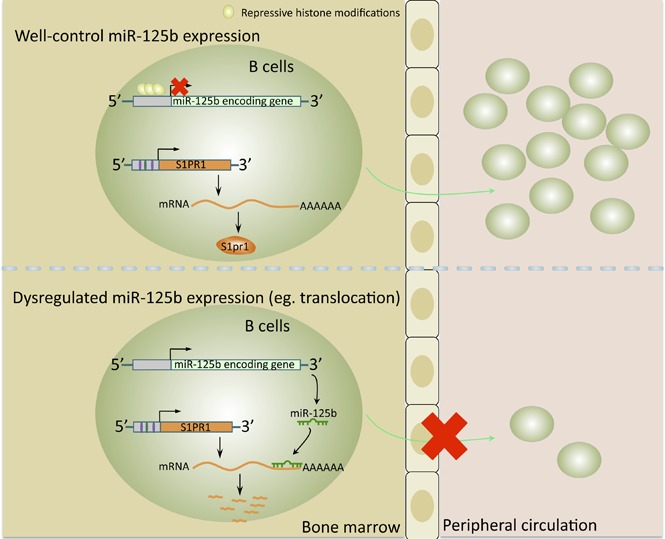
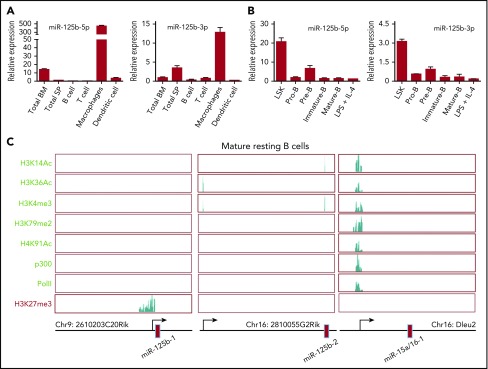
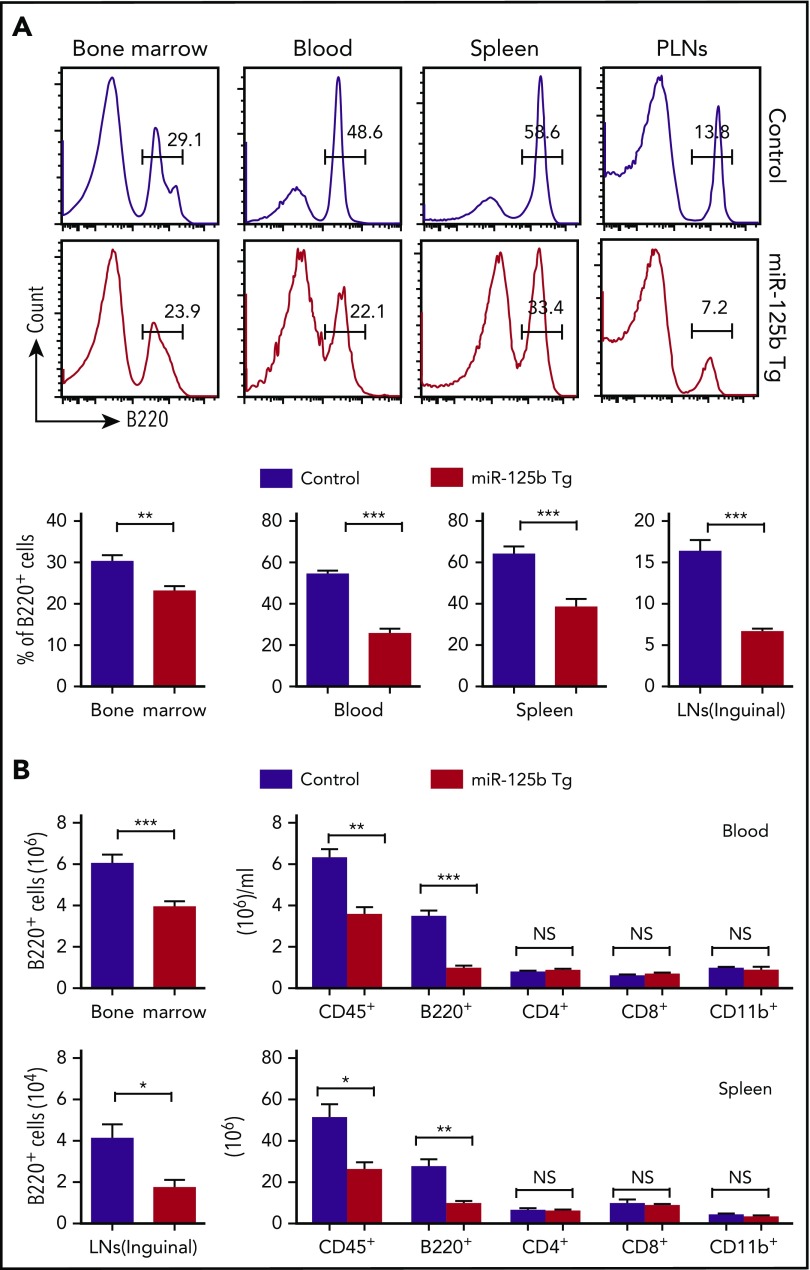
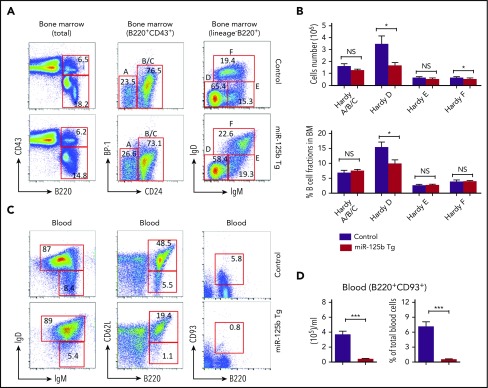
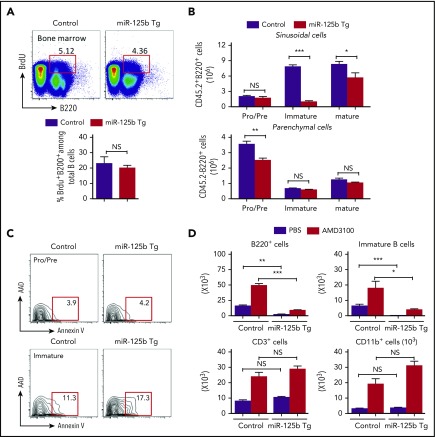
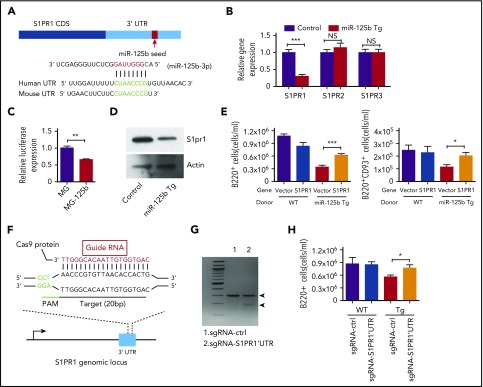
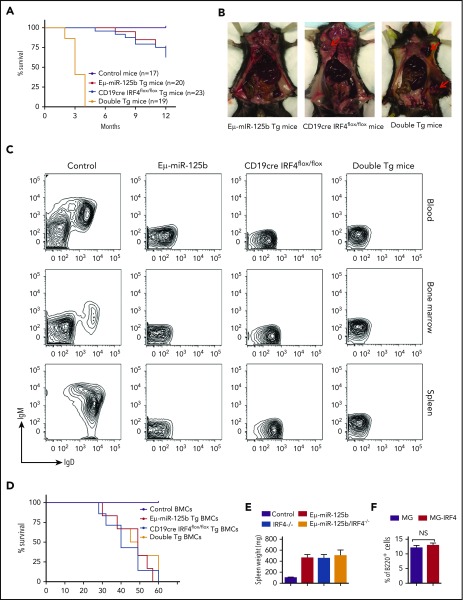
Deregulation of several microRNAs (miRs) can influence critical developmental checkpoints during hematopoiesis as well as cell functions, eventually leading to the development of autoimmune disease or cancer. We found that miR-125b is expressed in bone marrow multipotent progenitors and myeloid cells but shut down in the B-cell lineage, and the gene encoding miR-125b lacked transcriptional activation markers in B cells. To understand the biological importance of the physiological silencing of miR-125b expression in B cells, we drove its expression in the B-cell lineage and found that dysregulated miR-125b expression impaired egress of immature B cells from the bone marrow to peripheral blood. Such impairment appeared to be mediated primarily by inhibited expression of the sphingosine-1-phosphate receptor 1 (S1PR1). Enforced expression of S1PR1 or clustered regularly interspaced short palindromic repeats/Cas9-mediated genome editing of the miR-125b targeting site in the S1PR1 3' untranslated region rescued the miR-125b-mediated defect in B-cell egress. In addition to impaired B-cell egress, miR-125b dysregulation initially reduced pre-B-cell output but later induced pre-B-cell lymphoma/leukemia in mice. Genetic deletion of IRF4 was found in miR-125b-induced B-cell cancer, but its role in oncogenic miR-125b-induced B-cell transformation is still unknown. Here, we further demonstrated an interaction of the effects of miR-125b and IRF4 in cancer induction by showing that miR125b-induced B-cell leukemia was greatly accelerated in IRF4 homozygous mutant mice. Thus, we conclude that physiological silencing of miR-125b is required for normal B-cell development and also acts as a mechanism of cancer suppression.
Conflict of interest statement
Conflict-of-interest disclosure: The authors declare no competing financial interests.
Figures
Similar articles
-
Oncomir miR-125b regulates hematopoiesis by targeting the gene Lin28A.Proc Natl Acad Sci U S A. 2012 Mar 13;109(11):4233-8. doi: 10.1073/pnas.1200677109. Epub 2012 Feb 24. Proc Natl Acad Sci U S A. 2012. PMID: 22366319 Free PMC article.
-
Dual mechanisms by which miR-125b represses IRF4 to induce myeloid and B-cell leukemias.Blood. 2014 Aug 28;124(9):1502-12. doi: 10.1182/blood-2014-02-553842. Epub 2014 Jul 8. Blood. 2014. PMID: 25006123 Free PMC article.
-
MicroRNA miR-125b causes leukemia.Proc Natl Acad Sci U S A. 2010 Dec 14;107(50):21558-63. doi: 10.1073/pnas.1016611107. Epub 2010 Nov 30. Proc Natl Acad Sci U S A. 2010. PMID: 21118985 Free PMC article.
-
Regulation of the MIR155 host gene in physiological and pathological processes.Gene. 2013 Dec 10;532(1):1-12. doi: 10.1016/j.gene.2012.12.009. Epub 2012 Dec 14. Gene. 2013. PMID: 23246696 Review.
-
Cytokines and microRNA in pediatric B-acute lymphoblastic leukemia.Cytokine Growth Factor Rev. 2011 Jun;22(3):149-56. doi: 10.1016/j.cytogfr.2011.05.003. Epub 2011 Jul 20. Cytokine Growth Factor Rev. 2011. PMID: 21764355 Review.
Cited by
-
Acidic leucine-rich nuclear phosphoprotein-32A expression contributes to adverse outcome in acute myeloid leukemia.Ann Transl Med. 2020 Mar;8(6):345. doi: 10.21037/atm.2020.02.54. Ann Transl Med. 2020. PMID: 32355789 Free PMC article.
-
MicroRNAs: Tiny Regulators of Gene Expression with Pivotal Roles in Normal B-Cell Development and B-Cell Chronic Lymphocytic Leukemia.Cancers (Basel). 2021 Feb 3;13(4):593. doi: 10.3390/cancers13040593. Cancers (Basel). 2021. PMID: 33546241 Free PMC article. Review.
-
Application of Hi-C and other omics data analysis in human cancer and cell differentiation research.Comput Struct Biotechnol J. 2021 Apr 8;19:2070-2083. doi: 10.1016/j.csbj.2021.04.016. eCollection 2021. Comput Struct Biotechnol J. 2021. PMID: 33995903 Free PMC article. Review.
-
miRNA-Mediated Control of B Cell Responses in Immunity and SLE.Front Immunol. 2021 May 17;12:683710. doi: 10.3389/fimmu.2021.683710. eCollection 2021. Front Immunol. 2021. PMID: 34079558 Free PMC article. Review.
-
Potential of the tumor‑derived extracellular vesicles carrying the miR‑125b‑5p target TNFAIP3 in reducing the sensitivity of diffuse large B cell lymphoma to rituximab.Int J Oncol. 2021 Jun;58(6):31. doi: 10.3892/ijo.2021.5211. Epub 2021 Apr 23. Int J Oncol. 2021. PMID: 33887878 Free PMC article.
References
-
- Mandel EM, Grosschedl R. Transcription control of early B cell differentiation. Curr Opin Immunol. 2010;22(2):161-167. - PubMed
Publication types
MeSH terms
Substances
Grants and funding
LinkOut - more resources
Full Text Sources
Other Literature Sources
Molecular Biology Databases
