. 2018 May 18;293(20):7549-7563.
doi: 10.1074/jbc.M117.817692. Epub 2018 Mar 19.

Aberrant fatty acid metabolism in skeletal muscle contributes to insulin resistance in zinc transporter 7 (znt7)-knockout mice

Affiliations

Aberrant fatty acid metabolism in skeletal muscle contributes to insulin resistance in zinc transporter 7 (znt7)-knockout mice

Liping Huang et al. J Biol Chem. .

Abstract

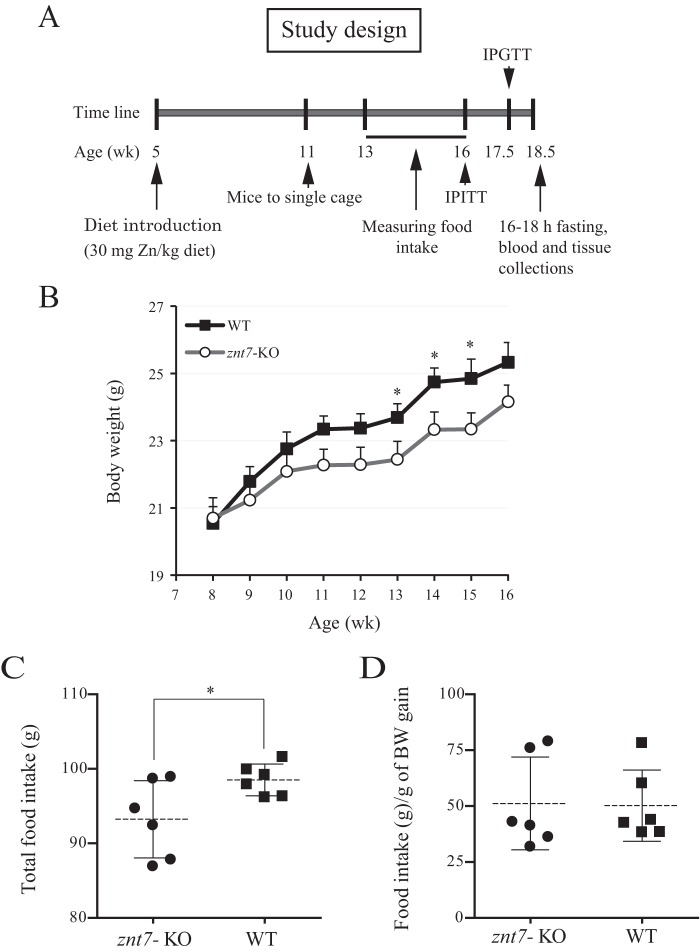
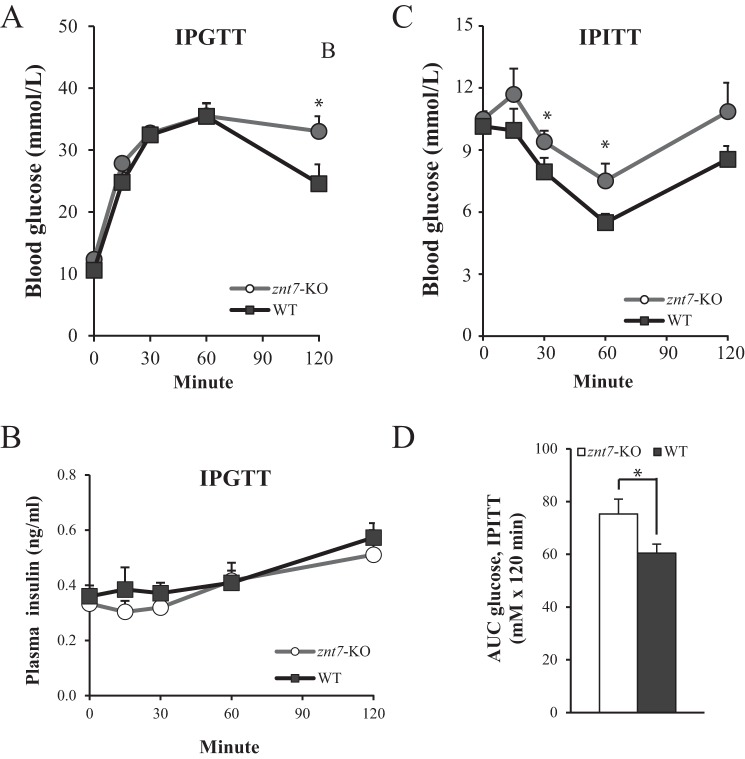
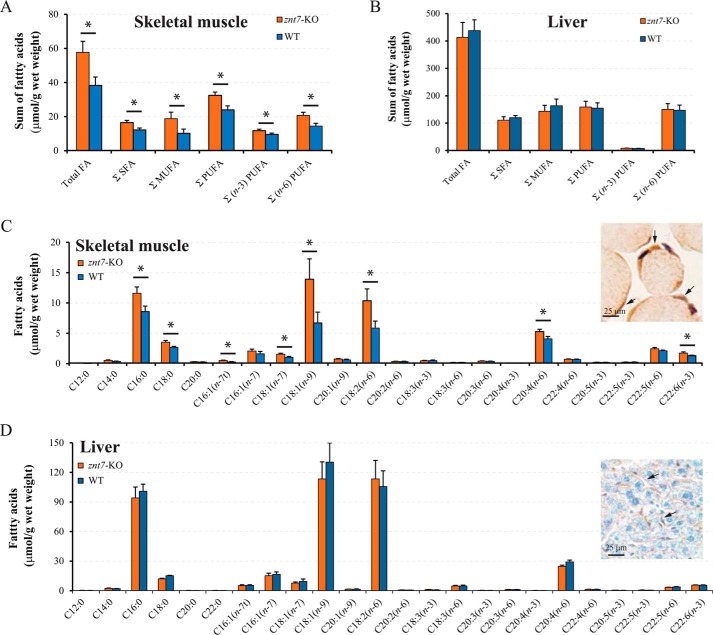
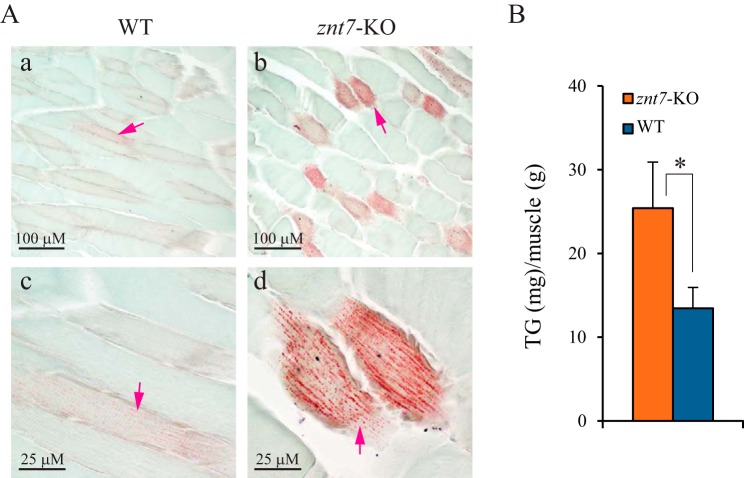
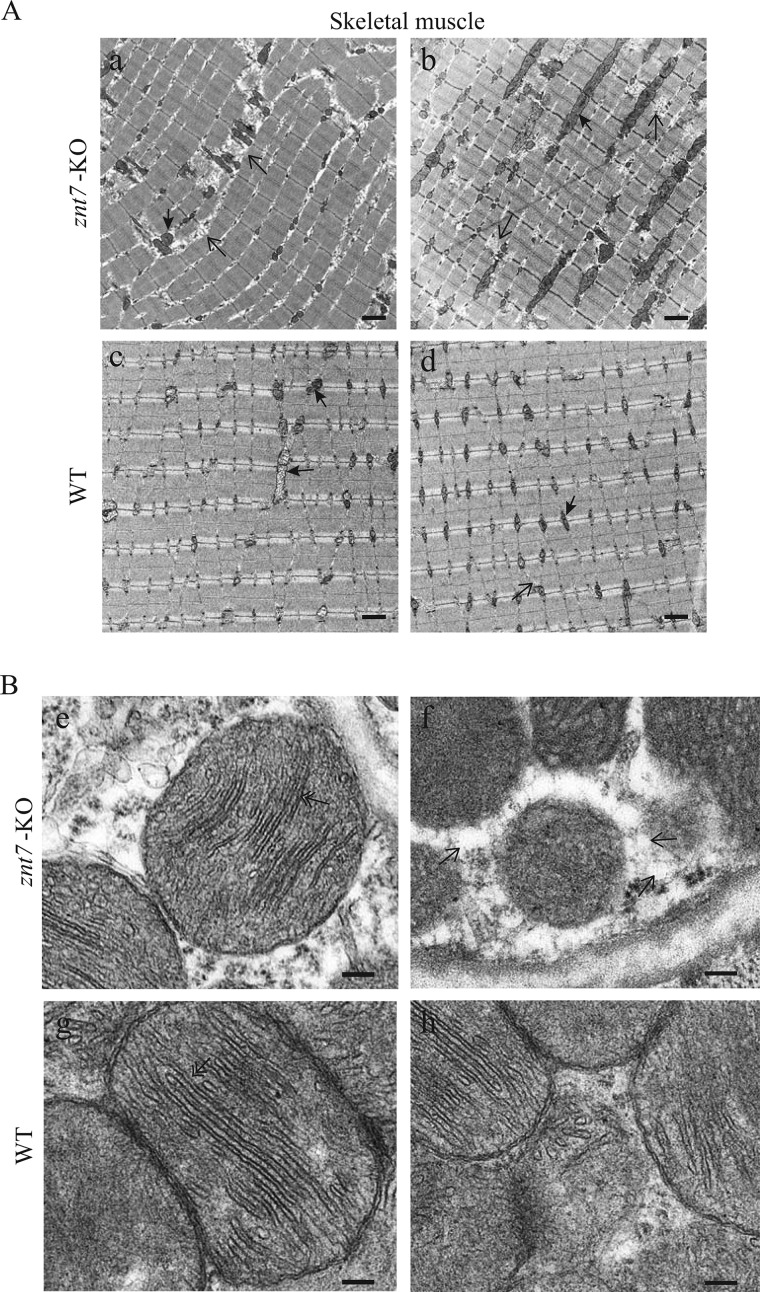
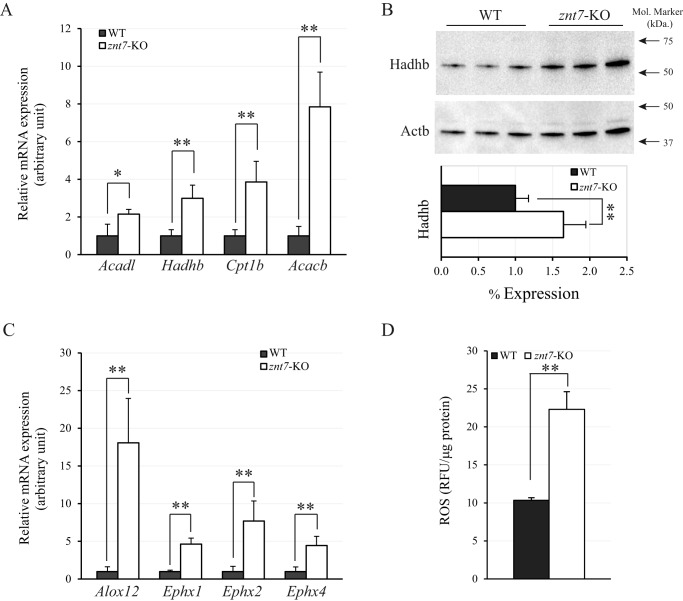
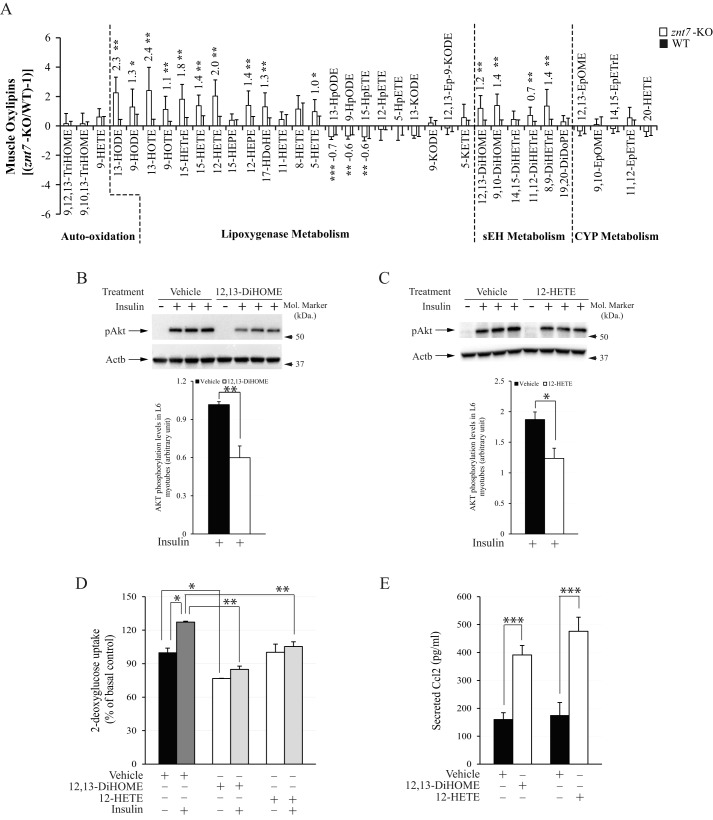
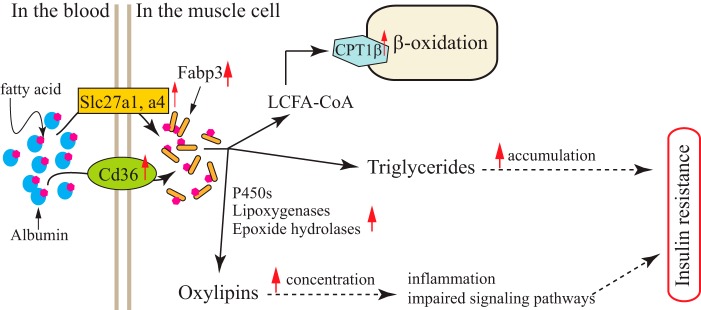
ZnT7 (Slc30a7) is a widely expressed zinc transporter involved in sequestration of zinc into the Golgi apparatus and vesicular compartments. znt7-knockout (KO) mice are mildly zinc-deficient and lean. Despite their lean phenotype, adult male znt7-KO mice are prone to insulin resistance. We hypothesized that fat partitioning from adipose to nonadipose tissues causes insulin resistance in znt7-KO mice. Here, we used biological and biochemical methods, including fatty acid and oxylipin profiling, EM, immunohistochemistry, quantitative RT-PCR, and Western blot analysis, to identify the underlying mechanism of insulin resistance in znt7-KO mice. We found that insulin resistance in this model was primarily associated with increased intracellular fatty acid levels in the skeletal muscle, which promoted intracellular lipid accumulation and production of bioactive lipid mediators, such as 12,13-dihydroxyoctadecanoic acid (12,13-DiHOME) and 12-hydroxyeicosatetraenoic acid (12-HETE). The expression of fatty acid-binding protein 3 (Fabp3) was dramatically up-regulated in the znt7-KO muscle cells accompanied by increased expression of Cd36, Slc27a1, and Slc27a4, the three major fatty acid transporters in the skeletal muscle. We also demonstrated that znt7-KO muscle cells had increased fatty acid oxidative capacity, indicated by enlarged mitochondria and increased mRNA or protein expression of key enzymes involved in the fatty acid mitochondrial shuttle and β-oxidation. We conclude that increased fatty acid uptake in the znt7-KO skeletal muscle is a key factor that contributes to the excessive intracellular lipid deposit and elevated production of bioactive lipid mediators. These mediators may play pivotal roles in oxidative stress and inflammation, leading to insulin resistance.

Keywords: Slc30a7; ZnT7; fatty acid metabolism; glucose metabolism; impaired glucose metabolism; insulin resistance; long-chain fatty acid; skeletal muscle; transporter; triglyceride; zinc; zinc transporter 7.


Conflict of interest statement

The authors declare that they have no conflicts of interest with the contents of this article. USDA is an equal opportunity provider and employer

Figures

Figure 1.
Figure 1.
znt7-KO mice gained less weight than the WT littermates. A, a schematic diagram of the study. Mice were weaned at 3 weeks old. An AIN96-based rodent diet containing 30 mg of zinc/kg of diet was introduced to both znt7-KO and control mice at 5 weeks old. All mice were euthanized at 18.5 weeks old. B, growth curves during the food intake measuring period. Body weights were monitored for 3 weeks after the special diet was introduced until before the insulin resistance test was performed. C, total food (grams) consumed by znt7-KO and control mice during the 3-week data collection period. znt7-KO and control mice were housed individually at 11 weeks old. Food intake was measured 2 weeks after mice were singly housed. D, food intake per gram of body weight gain. BW, body weight; wk, week; IPGTT, intraperitoneal glucose tolerance test; IPITT, intraperitoneal insulin tolerance test. Data are means, and error bars represent S.D. *, p < 0.05.
Figure 2.
Figure 2.
Intraperitoneal glucose and insulin tolerance tests. A, blood glucose levels during IPGTT. B, plasma insulin levels during IPGTT. C, blood glucose levels during IPITT. D, the area under the curve (AUC) for glucose concentrations during IPITT. Both znt7-KO and WT mice were fasted 6 (IPGTT) or 4 h (IPITT) at 7:00 a.m. before the test. Blood was collected at the indicated time points before and after administration of glucose or insulin. Values are means, and error bars represent S.E., n = 6 per genotype of mice. *, p < 0.05.
Figure 3.
Figure 3.
Fatty acid profiling in the skeletal muscle and liver of znt7-KO and WT mice. Skeletal muscle and liver were collected from znt7-KO and control mice at 18.5 weeks old after overnight fasting (16–18 h). Total fatty acids, total saturated fatty acids (ΣSFA), total monounsaturated fatty acids (ΣMUFA), total polyunsaturated fatty acids (ΣPUFA), total ω-3 polyunsaturated fatty acids (Σ(n-3)PUFA), and total ω-6 polyunsaturated fatty acids (Σ(n-6)PUFA) were calculated by the sum of the fatty acids quantified (see “Experimental procedures” for details). A, fatty acid contents in the skeletal muscle. B, fatty acid contents in the liver. C, fatty acid compositions in the skeletal muscle. The inset is a representative photograph of immunohistochemical staining of ZnT7 in the mouse skeletal muscle. Arrows indicate ZnT7 in the myofibrils. D, fatty acid compositions in the liver. The inset is a representative photograph of immunohistochemical staining of ZnT7 in the mouse liver. ZnT7 is expressed in the hepatic sinusoid (arrows) but not in the hepatocyte. Values are means, and error bars represent S.E., n = 6 per genotype of mice. *, p < 0.05.
Figure 4.
Figure 4.
Lipid accumulation in the skeletal muscle of znt7-KO mice. Skeletal muscle was isolated from znt7-KO and control mice at 18.5 weeks old after 16–18-h fasting. A, panels a–d, intracellular lipid accumulation in the myofibril of znt7-KO and control mice. Neutral lipids and triglycerides in the skeletal muscle were stained by Oil Red O. Arrows indicate the location of lipids stained by Oil Red O. B, quantification of triglycerides (TG) in the skeletal muscle. Triglycerides in the muscle protein lysate were determined using an L-Type Triglyceride M kit. Values are means, and error bars represent S.E., n = 6 per genotype of mice. *, p < 0.05.
Figure 5.
Figure 5.
Electron micrographs of the skeletal muscle from znt7-KO and WT mice. A, low magnification of electron micrographs. Panels a and b, the electron microscopic views of the znt7-KO skeletal muscle. Nonuniform distribution of mitochondria was observed. Enlarged mitochondria and expanded sarcoplasm were also noticeable. Panels c and d, the electron microscopic views of the WT skeletal muscle. The solid and open arrows indicate the mitochondria and the sarcoplasm, respectively. Scale bars, 1 μm. B, high magnification of electron micrographs. Panels e and f, the electron microscopic views of the znt7-KO skeletal muscle. Abundant lipid droplets were observed. The open arrows in panel f indicate lipid droplets in the sarcoplasm. Panels g and h, the electron microscopic views of the WT skeletal muscle. The double-headed arrows in panels e and g indicate the double leaflet structure of the mitochondria. Scale bars, 0.1 μm.
Figure 6.
Figure 6.
Expression of Cd36, Slc27a1, Slc27a4, Acsl1, and Fabp3 and [1-14C]palmitic acid uptake in primary skeletal myotubes. A, expression of Cd36, Slc27a1, Slc27a4, Acsl1, and Fabp3 mRNAs. Primary myoblasts of znt7-KO and the WT control were allowed to differentiate for 4–6 days before harvest. The amount of the target mRNA was measured by SYBR-based quantitative RT-PCR. Actb was used as the internal reference, and three independent experiments, each with duplicate or triplicate, were performed. B, effect of znt7-KO on the protein expression level of Fabp3 in primary myotubes. Primary myoblasts of znt7-KO and the WT control were allowed to differentiate for 4 days before harvest. Three micrograms of total proteins were loaded for the Western blot assay. Actb was used as the loading control. Similar results were obtained from multiple experiments, and a representative image is shown. C, [14C]palmitic acid (PA) uptake. Differentiated primary myotubes were incubated with 80 μm [1-14C]palmitic acid for 0 or 3 min at 37 °C in 5% CO2. The panel shows the palmitate uptake as nmol/mg of protein/min. Results are presented as means, and error bars represent S.D. from three independent experiments, each with three to six replicates. *, p < 0.05; **, p < 0.01.
Figure 7.
Figure 7.
Expression of key enzymes involved in the mitochondrial β-oxidation, bioactive lipid mediator production, and ROS accumulation in primary skeletal myotubes. A, expression of Acadl, Hadhb, Cpt1b, and Acacb mRNAs. B, expression of Hadhb protein. C, expression of Alox12, Ephx1, Ephx2, and Ephx4 mRNAs. Primary myoblasts of znt7-KO and the WT control were allowed to differentiate for 4–6 days before the experiments. The amount of the target mRNA was measured by SYBR-based quantitative RT-PCR. Three micrograms of total proteins were loaded for the Western blotting assay. Actb was used as the internal reference for mRNA measurements or as the loading control for Western blotting assays. Three independent experiments, each with duplicate or triplicate, were performed. A representative image of the Western blot assays is shown. D, ROS levels in living myotubes. Results are means, and error bars represent S.E. (three independent experiments with three to six replicates, n = 12). RFU, relative fluorescence units, excitation/emission, 540/570 nm. *, p < 0.05; **, p < 0.01.
Figure 8.
Figure 8.
Oxylipin profiling of skeletal muscle of znt7-KO and the controls and effects of oxylipins on insulin signaling and cytokine secretion in L6 muscle cells. A, oxylipin profiling of the znt7-KO and WT skeletal muscle. Femoral skeletal muscle tissues were isolated from znt7-KO and control mice at 18.5 weeks old after 16–18 h fasting. Oxylipin concentrations were measured as described under “Experimental procedures.” Among the metabolites examined, 14 oxylipins were significantly higher in the znt7-KO skeletal muscle than the WT controls. Values are means, and error bars represent S.E., n = 6 per genotype. Metabolites were grouped in their metabolic pathways. sEH, epoxide hydrolase; CYP, cytochrome p450; 9,12,13-TriHOME, 9,12,13-trihydroxyoctadecenoic acid; 9,10,13-TriHOME, 9,10,13-trihydroxyoctadecenoic acid; 9-HETE, 9-hydroxyeicosatetraenoic acid; 13-HODE, 13-hydroxyoctadecadienoic acid; 9-HODE, 9-hydroxyoctadecadienoic acid; 13-HOTE, 13-hydroxyoctadecatrienoic acid; 9-HOTE, 9-hydroxyocatadecatrienoic acid; 15-HETrE, 15-hydroxyeicosatrienoic acid; 15-HETE, 15-hydroxyeicosatetraenoic acid; 15-HEPE, 15-eicosapentaenoic acid; 12-HEPE, 12-hydroxyeicosapentaenoic acid; 17-HDoHE, 17-hydroxydocosahexaenoic acid; 11-HETE, 11-hydroxyeicosatetraenoic acid; 8-HETE, 8-hydroxyeicosatetraenoic acid; 5-HETE, 5-hydroxyeicosatetraenoic acid; 13-HpODE, 13-hydroxyoctadecadienoic acid; 9-HpODE, 9-hydroxyoctadecadienoic acid; 15-HpETE, 15-hydroperoxyeicosatetraenoic acid; 12-HpETE, 12-hydroperoxyeicosatetraenoic acid; 5-HpETE, 5-hydroperoxyeicosatetraenoic acid; 13-KODE, 13-oxooctadecadienoic acid; 9-KODE, 9-oxooctadecadienoic acid; 12,13-Ep-9-KODE, 12,13-epoxyoxo-9-octadecenoic acid; 5-KETE, 5-oxoeicosatetraenoic acid; 9,10-DiHOME, 9,10-dihydroxyoctadecanoic acid; 14,15-DiHETrE, 14,15-dihydroxyeicosatrienoic acid; 11,12-DiHETrE, 11,12-dihydroxyeicosatrienoic acid; 8,9-DiHETrE, 8,9-dihydroxyeicosatrienoic acid; 19,20-DiHDoPE, 19,20-dihydroxydocosapentaenoic acid; 12,13-EpOME, 12,13-epoxyoctadecenoic acid; 9,10-EpOME, 9,10-epoxyoctadecenoic acid; 14,15-EpETrE, 14,15-epoxyeicosatrienoic acid; 11,12-EpETrE, 11,12-epoxyeicosatrienoic acid; 20-HETE, 20-hydroxyeicosatetraenoic acid. B and C, phosphorylation of Akts. L6 myotubes (6 × 10⁴) were treated with 2 μm 12,13-DiHOME (B) or 2 μm 12-HETE (C) at 37 °C for 18 h and then serum-starved for 2 h followed by insulin stimulation (100 nm) at 37 °C for 7 min. Representative Western blots are displayed. Densitometry of the phosphorylated Akt (pAkt) band in the blots was determined and is shown under the Western blot images. Treatment of L6 myotubes with 12,13-DiHOME and 12-HETE caused 40 and 35% reduction, respectively, in insulin-stimulated Akt phosphorylation. D, 2-[3H]deoxyglucose uptake in L6 myotubes. Myotubes were treated with 2 μm 12,13-DiHOME or 2 μm 12-HETE at 37 °C for 18 h followed by 2-[3H]deoxyglucose uptake in the presence of 0 or 100 nm insulin at 37 °C for 15 min. Cells were then washed and lysed for radioactive determinations. Treatment of L6 myotubes with 12,13-DiHOME inhibited glucose uptake by 23% in the basal condition compared with the mock-treated cells. No significant reduction was observed in glucose uptake in L6 myotubes treated with 12-HETE. Insulin treatment of L6 myotubes increased glucose uptake by 27% in the control L6 myotubes. However, this insulin-stimulated glucose uptake was not observed in the L6 myotubes treated with either 12,13-DiHOME or 12-HETE. E, secreted Ccl2 from L6 myotubes. L6 myoblasts (6 × 10⁴) were differentiated for 7 days and then treated with 10 μm 12,13-DiHOME or 10 μm 12-HETE at 37 °C for 2 days. Secreted Ccl2 in the supernatant was then determined. L6 myotubes treated with 12,13-DiHOME and 12-HETE increased Ccl2 secretion by 2.4- and 2.7-fold, respectively, compared with the mock-treated controls. All data are reported in B–E as means, and error bars represent S.D., n = 3 per treatment. *, p < 0.05; **, p < 0.01; ***, p < 0.001.
Figure 9.
Figure 9.
A schematic diagram of fatty acid metabolism and pathways leading to insulin resistance in the znt7-KO muscle cell. In the skeletal muscle cell, long-chain fatty acids are taken up by Cd36, Slc27a1, and Slc27a4. Once fatty acids are brought into the sarcoplasm, they are immediately bound to Fabp3. This binding also provides a positive feedback for more fatty acid uptake. Bound fatty acids can then be transported intracellularly for β-oxidation in the mitochondria to produce ATPs, for triglyceride synthesis to avoid lipid toxicity from elevated fatty acid concentrations, and for bioactive lipid mediator production to regulate physiological function of the muscle. In znt7-KO muscle cells, fatty acid uptake and Fabp3 binding are up-regulated, leading to increased β-oxidation in the mitochondria. However, it seems that the increased β-oxidation cannot keep up with the increased fatty acid levels in the znt7-KO muscle cell. Excessive levels of fatty acids are converted into lipids and lipid mediators, resulting in inflammation and oxidative stress, two key processes that drive insulin resistance.

Similar articles

Cited by

References

    1. Huang L., and Tepaamorndech S. (2013) The SLC30 family of zinc transporters—a review of current understanding of their biological and pathophysiological roles. Mol. Aspect Med. 34, 548–560 10.1016/j.mam.2012.05.008 - DOI - PubMed
    1. Jeong J., and Eide D. J. (2013) The SLC39 family of zinc transporters. Mol. Aspects Med. 34, 612–619 10.1016/j.mam.2012.05.011 - DOI - PMC - PubMed
    1. Thirumoorthy N., Shyam Sunder A., Manisenthil Kumar K., Senthil Kumar M., Ganesh G., and Chatterjee M. (2011) A review of metallothionein isoforms and their role in pathophysiology. World J. Surg. Oncol. 9, 54 10.1186/1477-7819-9-54 - DOI - PMC - PubMed
    1. Huang L., Kirschke C. P., Lay Y. A., Levy L. B., Lamirande D. E., and Zhang P. H. (2012) Znt7-null mice are more susceptible to diet-induced glucose intolerance and insulin resistance. J. Biol. Chem. 287, 33883–33896 10.1074/jbc.M111.309666 - DOI - PMC - PubMed
    1. Tepaamorndech S., Kirschke C. P., Pedersen T. L., Keyes W. R., Newman J. W., and Huang L. (2016) Zinc transporter 7 deficiency affects lipid synthesis in adipocytes by inhibiting insulin-dependent Akt activation and glucose uptake. FEBS J. 283, 378–394 10.1111/febs.13582 - DOI - PubMed

Publication types