. 2018 May 9;200(11):e00737-17.
doi: 10.1128/JB.00737-17. Print 2018 Jun 1.

Depletion of Glucose Activates Catabolite Repression during Pneumonic Plague

Affiliations

Depletion of Glucose Activates Catabolite Repression during Pneumonic Plague

Jeremy T Ritzert et al. J Bacteriol. .

Abstract

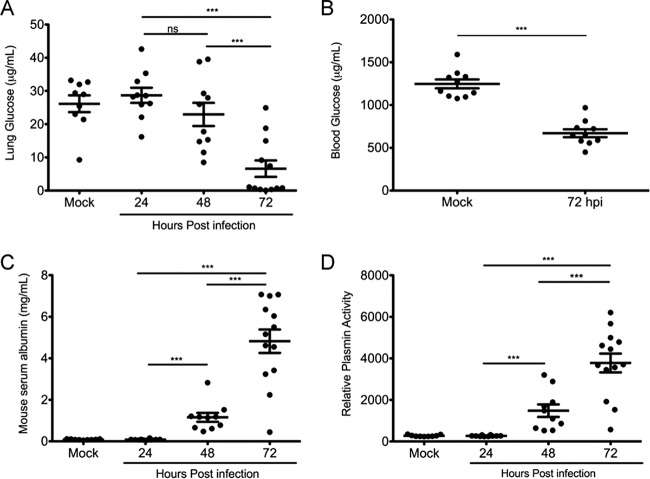
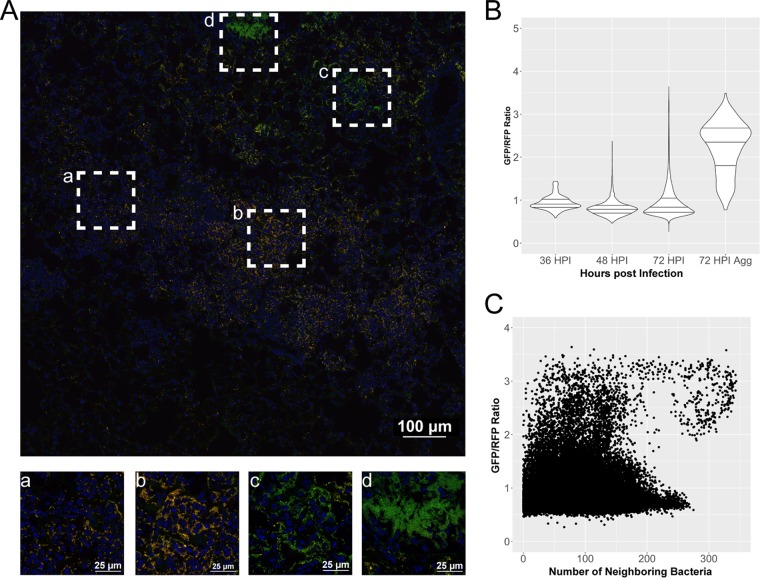
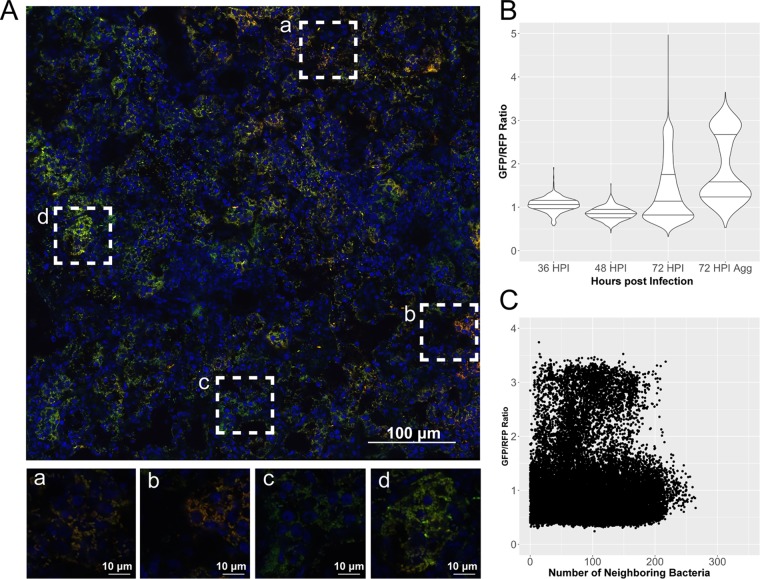
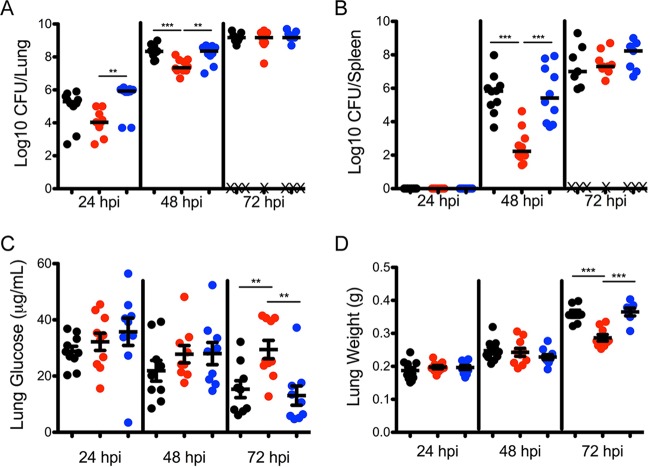
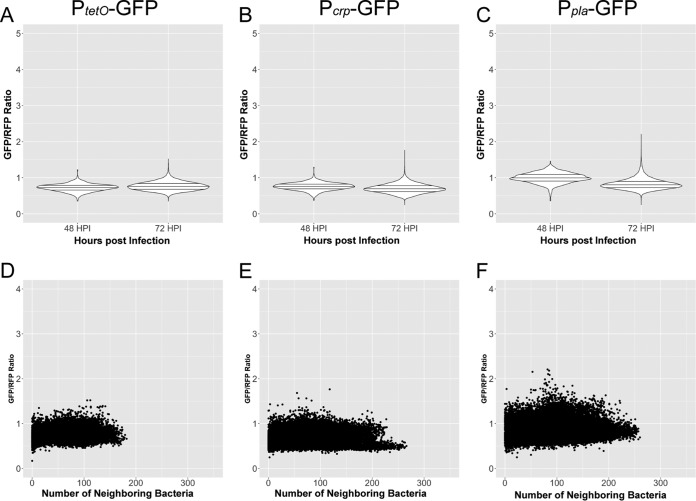
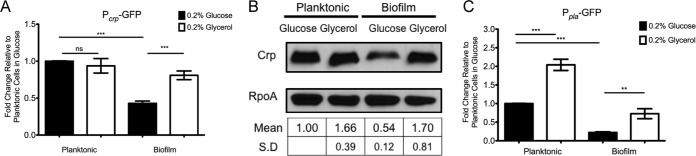
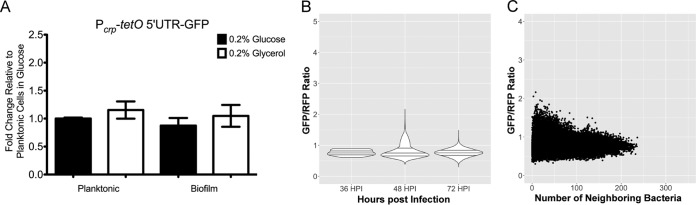
Bacterial pathogenesis depends on changes in metabolic and virulence gene expression in response to changes within a pathogen's environment. The plague-causing pathogen, Yersinia pestis, requires expression of the gene encoding the Pla protease for progression of pneumonic plague. The catabolite repressor protein Crp, a global transcriptional regulator, may serve as the activator of pla in response to changes within the lungs as disease progresses. By using gene reporter fusions, the spatial and temporal activation of the crp and pla promoters was measured in a mouse model of pneumonic plague. In the lungs, crp was highly expressed in bacteria found within large aggregates resembling biofilms, while pla expression increased over time independent of the aggregated state. Increased expression of crp and pla correlated with a reduction in lung glucose levels. Deletion of the glucose-specific phosphotransferase system EIIBC (PtsG) of Y. pestis rescued glucose levels in the lungs, resulting in reduced expression of both crp and pla We propose that activation of pla expression during pneumonic plague is driven by an increase of both Crp and cAMP levels following consumption of available glucose in the lungs by Y. pestis Thus, Crp operates as a sensor linking the nutritional environment of the host to regulation of virulence gene expression.IMPORTANCE Using Yersinia pestis as a model for pneumonia, we discovered that glucose is rapidly consumed, leading to a catabolite-repressive environment in the lungs. As a result, expression of the gene encoding the plasminogen activator protease, a target of the catabolite repressor protein required for Y. pestis pathogenesis, is activated. Interestingly, expression of the catabolite repressor protein itself was also increased in the absence of glucose but only in biofilms. The data presented here demonstrate how a bacterial pathogen senses changes within its environment to coordinate metabolism and virulence gene expression.

Keywords: Crp; Pla; PtsG; Yersinia pestis; catabolite repression; glucose; plague.


Figures

FIG 1
FIG 1
Available glucose in the lungs decreases as the pneumonia progresses. (A) Concentration of glucose in BALF recovered from the lungs of mock (PBS)-infected or Y. pestis-infected mice at 24, 48, and 72 hpi. (B) Concentration of glucose in the serum of infected mice at 72 hpi. (C) Concentration of mouse serum albumin in BALF of mock- and Y. pestis-infected mice measured by ELISA. (D) Relative plasmin activity in BALF from mock- and Y. pestis-infected mice measured by a plasmin activity assay. Data are combined from two independent infections with mock-infected and 24- and 48-h-infected mice (n = 5) and 72-h-infected mice (n = 10). Error bars represent the means and standard errors of the means. ***, P < 0.001; ns, not significant (one-way ANOVA with Bonferroni multiple-comparison test for panels A, C, and D and Student's t test for panel B).
FIG 2
FIG 2
Expression of crp is increased in large aggregates or biofilm-like structures in the lungs. Cross sections of lungs from mice infected with strain CO92 carrying the Pcrp-GFP reporter (green) and pGEN-RFP plasmid (red) were stained with DAPI (blue) and imaged by confocal microscopy. (A) Large image generated with the tile feature in NIS Elements acquisition software to cover Y. pestis-containing lesions within the lung space. Magnified images of boxed areas (a to d) highlight heterogeneity in expression patterns of crp within a single lesion. (B) Violin plots displaying the relative expression of crp as a ratio of GFP to RFP, quantified in individual cells combined from the lung lesions of at least three mice at each time point, across two independent infection experiments at 36, 48, and 72 hpi. Horizontal lines within the violins represent the 25th percentile, median, and 75th percentile. Aggregates were also imaged and analyzed separately. (C) Expression of crp in individual cells as a function of neighboring bacterial cell density from all images and time points postinfection.
FIG 3
FIG 3
Expression of pla increases during progression of pneumonia independent of presence in a biofilm. Cross sections of lungs from mice infected with strain CO92 carrying the Ppla-GFP reporter (green) and pGEN-RFP plasmid (red) were stained with DAPI (blue) and imaged by confocal microscopy. (A) The large image was generated in NIS Elements similarly to infections with the Pcrp-GFP strain. Magnified images of boxed areas (a to d) highlight the heterogeneity in expression patterns of pla within the larger lesion. (B) Violin plots displaying the relative expression of pla as a ratio of GFP to RFP, quantified in individual cells combined from the lung lesions of at least three mice at each time point, across two independent infection experiments at 36, 48, and 72 hpi. Horizontal lines within the violins represent the 25th percentile, median, and 75th percentile. Aggregates were also imaged and analyzed separately. (C) Expression of pla in individual cells as a function of neighboring bacterial cell density.
FIG 4
FIG 4
Deletion of ptsG from Y. pestis prevents depletion of glucose during infection. (A and B) Bacterial burden in the lungs (A) and spleens (B) of mice infected at 24, 48, and 72 hpi as follows: black, Y. pestis; red, Y. pestis ΔptsG; blue, Y. pestis ΔptsG ptsG. X, mouse succumbed to infection. (C) Concentration of glucose measured in BALF recovered from mice infected with Y. pestis, Y. pestis ΔptsG, and Y. pestis ΔptsG ptsG. (D) Wet lung weight of the lungs from mice infected as described for panel A. Data are combined from two independent infection experiments with five mice at each time point. Horizontal bars (A and B), medians; error bars (C and D), means and standard errors of the means. **, P < 0.01; ***, P < 0.001 (one-way ANOVA with Bonferroni multiple comparisons).
FIG 5
FIG 5
Expression levels of crp and pla do not increase during Y. pestis ΔptsG infection. Cross sections of lungs from mice infected with Y. pestis ΔptsG carrying the pGEN-RFP and either the PtetO-GFP, Pcrp-GFP, or Ppla-GFP reporter construct were analyzed identically to those from the wild-type-infected counterparts. (A to C) Violin plots of relative gene expression levels in individual cells combined from the lung lesions of at least three mice at each time point, across two independent infection experiments measured at 48 and 72 hpi for Y. pestis ΔptsG expressing either the PtetO-GFP, Pcrp-GFP, or Ppla-GFP reporter construct, as indicated. Horizontal lines within the violins represent the 25th percentile, median, and 75th percentile. (D to F) Relative expression as a function of cell density for infection with Y. pestis ΔptsG carrying the PtetO-GFP, Pcrp-GFP, or Ppla-GFP reporter construct. Individual points represent individual cells analyzed from infections at 48 and 72 hpi.
FIG 6
FIG 6
Expression of crp is repressed by glucose in biofilms in vitro. (A) Y. pestis Lcr with the Pcrp-GFP reporter was grown in 10 ml of TMH medium supplemented with 0.2% glucose or 0.2% glycerol. Planktonic bacteria growing within the medium were separated from bacteria in the biofilm formed at the air-liquid interface on the flask, and fluorescence intensity was measured and standardized to that of planktonic cells in 0.2% glucose. (B) Representative blot from whole-cell lysates generated from Y. pestis Lcr grown as described for panel A and immunoblotted for Crp protein. RpoA was used as a loading control, and blots were quantified in Fiji and standardized to planktonic cells in 0.2% glucose. (C) Y. pestis Lcr carrying the Ppla-GFP reporter was grown as described for panel A. Fluorescence intensity from the reporter was measured and standardized to that of planktonic cells in 0.2% glucose. Data are representative of three independent experiments. Error bars represent the means and standard errors of the means. **, P < 0.01; ***, P < 0.001; ns, not significant (one-way ANOVA with Bonferroni multiple-comparison test).
FIG 7
FIG 7
Increased expression of crp in biofilms requires the crp 5′ UTR. (A) Y. pestis with the Pcrp-tetO 5′ UTR-GFP reporter was grown in TMH medium supplemented with 0.2% glucose or 0.2% glycerol overnight. Planktonic and biofilm cells were separated, and GFP intensity was standardized to that of planktonic cells grown in 0.2% glucose. (B) Cross sections from mice infected with Y. pestis CO92/pGEN-RFP containing the Pcrp-tetO 5′ UTR-GFP reporter construct were imaged by confocal microscopy at 36, 48, and 72 hpi. Violin plots show the distribution of expression from single cells combined from at least three lung cross sections from the lung lesions of at least three mice at each time point, across two independent infection experiments. Horizontal lines within the violins represent the 25th percentile, median, and 75th percentile. (C) Relative expression as a function of density of neighboring Y. pestis cells measured from the Pcrp-tetO 5′ UTR-GFP reporter construct.

Similar articles

Cited by

References

    1. Perry RD, Fetherston JD. 1997. Yersinia pestis—etiologic agent of plague. Clin Microbiol Rev 10:35–66. - PMC - PubMed
    1. Pechous RD, Sivaraman V, Price PA, Stasulli NM, Goldman WE. 2013. Early host cell targets of Yersinia pestis during primary pneumonic plague. PLoS Pathog 9:e1003679. doi:10.1371/journal.ppat.1003679. - DOI - PMC - PubMed
    1. Pechous RD, Sivaraman V, Stasulli NM, Goldman WE. 2016. Pneumonic plague: the darker side of Yersinia pestis. Trends Microbiol 24:190–197. doi:10.1016/j.tim.2015.11.008. - DOI - PubMed
    1. Chauvaux S, Rosso ML, Frangeul L, Lacroix C, Labarre L, Schiavo A, Marceau M, Dillies MA, Foulon J, Coppee JY, Medigue C, Simonet M, Carniel E. 2007. Transcriptome analysis of Yersinia pestis in human plasma: an approach for discovering bacterial genes involved in septicaemic plague. Microbiology 153:3112–3124. doi:10.1099/mic.0.2007/006213-0. - DOI - PubMed
    1. Vadyvaloo V, Jarrett C, Sturdevant DE, Sebbane F, Hinnebusch BJ. 2010. Transit through the flea vector induces a pretransmission innate immunity resistance phenotype in Yersinia pestis. PLoS Pathog 6:e1000783. doi:10.1371/journal.ppat.1000783. - DOI - PMC - PubMed

Publication types

MeSH terms

Substances