. 2018 May 15;38(11):e00548-17.
doi: 10.1128/MCB.00548-17. Print 2018 Jun 1.

MicroRNA 199a-5p Attenuates Retrograde Transport and Protects against Toxin-Induced Inhibition of Protein Biosynthesis

Affiliations

MicroRNA 199a-5p Attenuates Retrograde Transport and Protects against Toxin-Induced Inhibition of Protein Biosynthesis

Juan F Aranda et al. Mol Cell Biol. .

Abstract

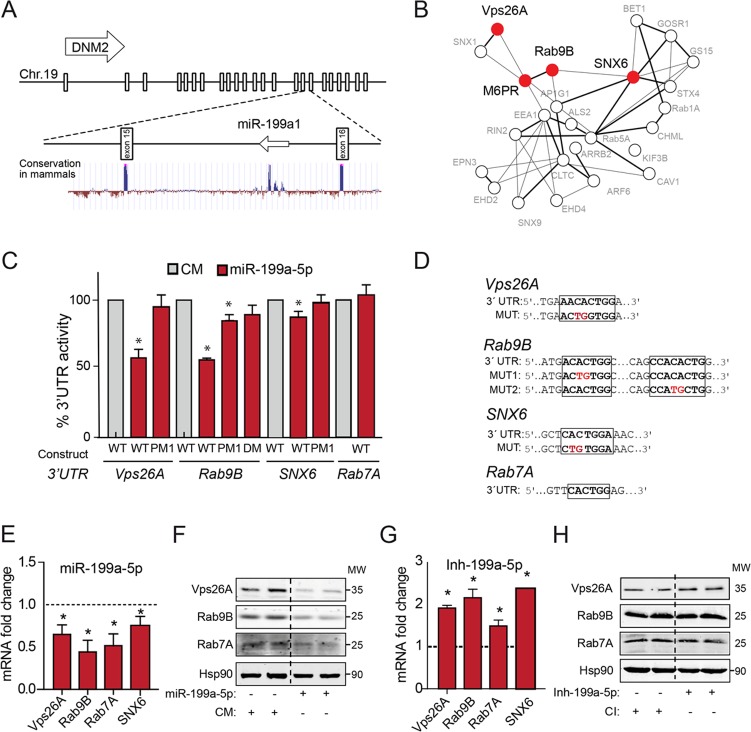
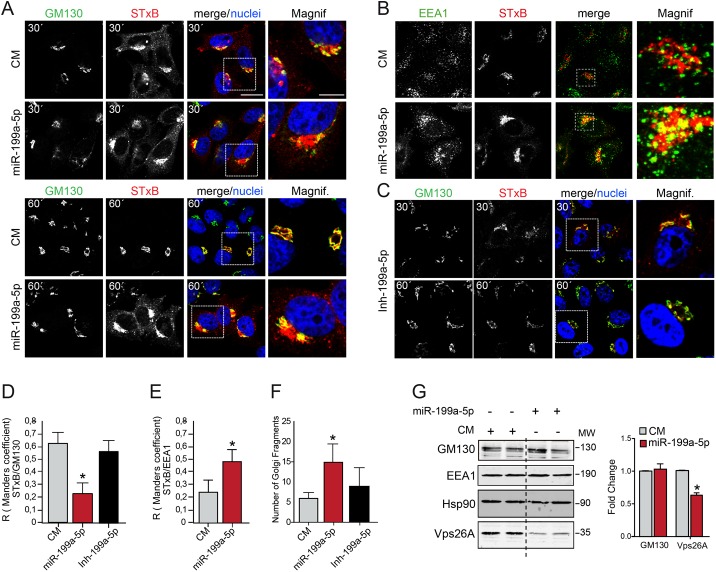
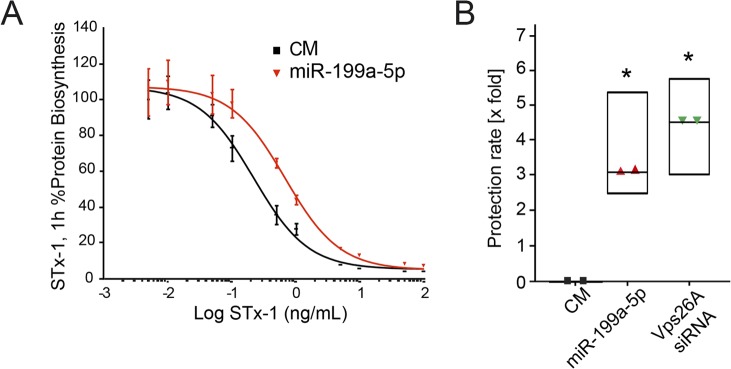
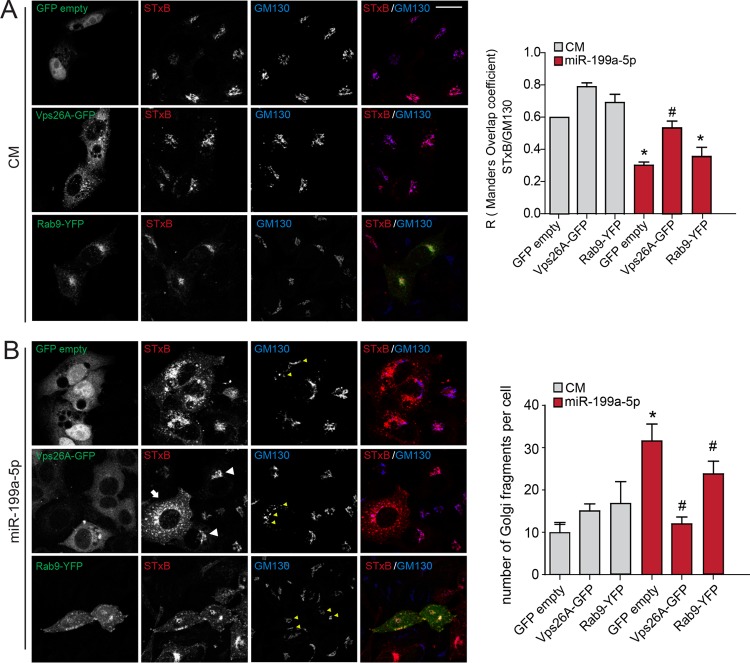
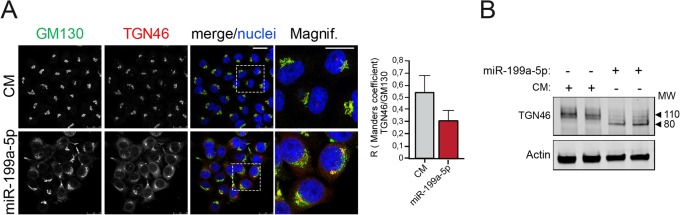
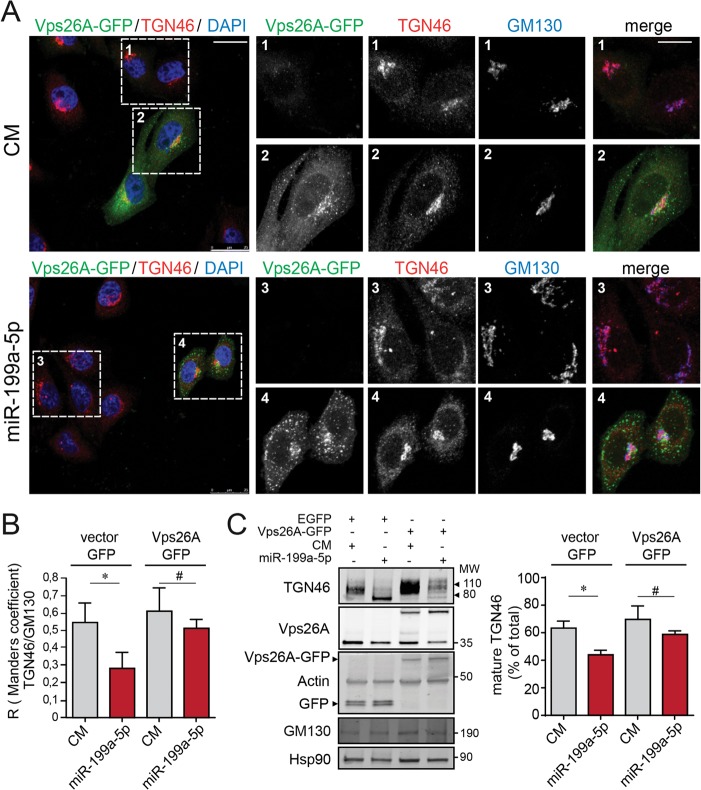
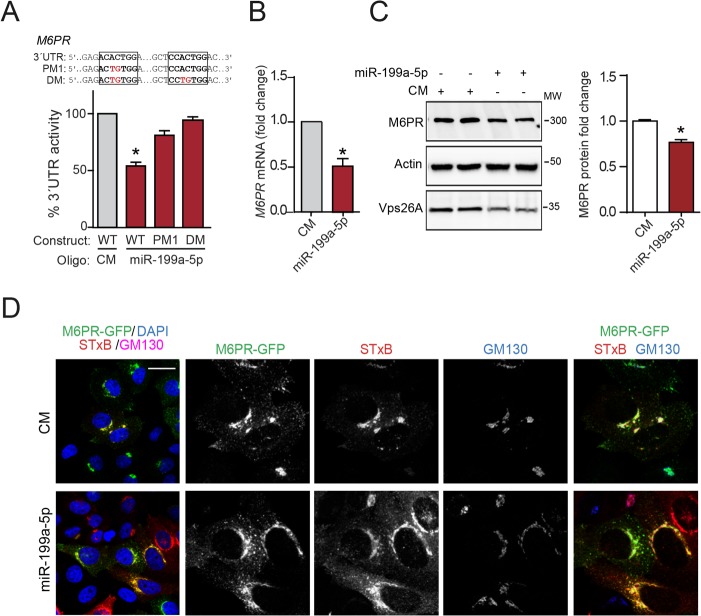
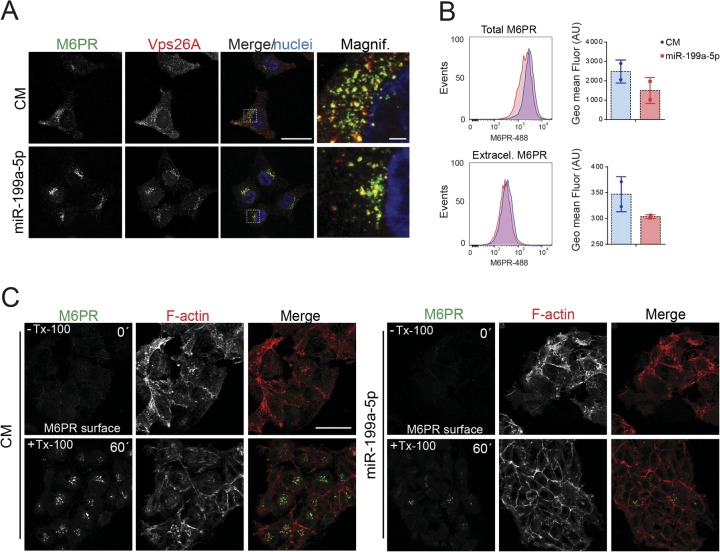
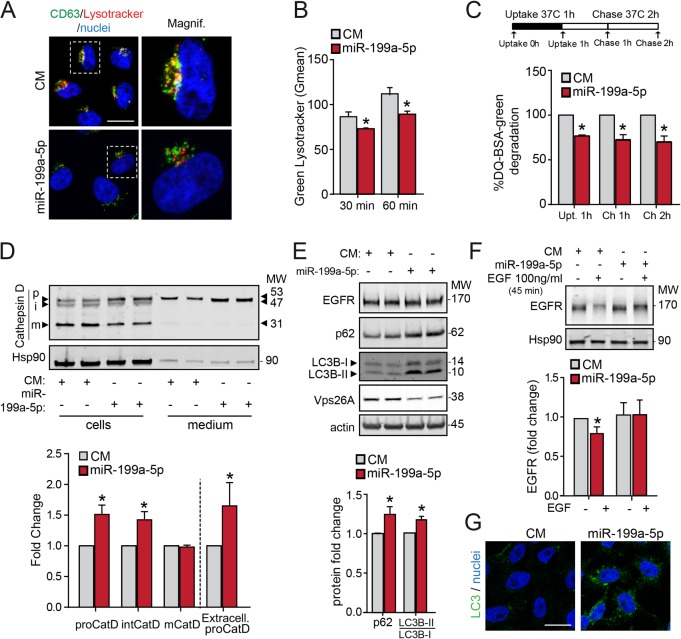
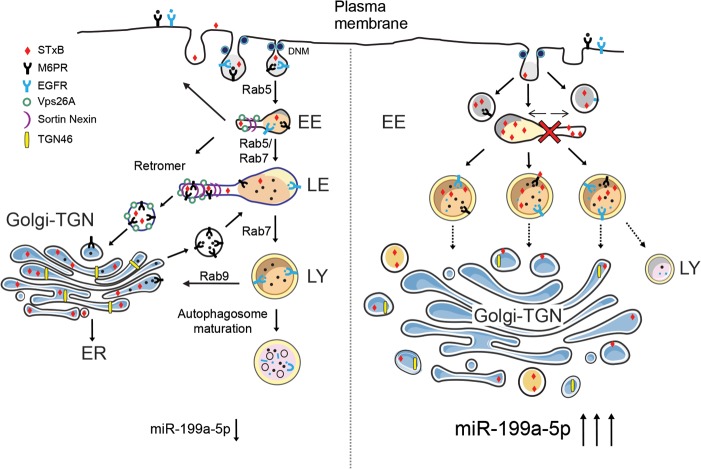
Retrograde transport (RT) allows cells to retrieve receptors and other cellular cargoes for delivery to the Golgi apparatus, contributing to the maintenance of cellular homeostasis. This transport route is also commonly used by several bacterial toxins to exert their deleterious actions on eukaryotic cells. While the retrograde transport process has been well characterized, the contribution of microRNAs (miRNAs) in regulating this cellular transport mechanism remains unknown. Here, we determined that mir-199a and mir-199b, members of the intronic miRNA family, coordinate genes regulating RT and endosome trafficking. We demonstrate that miR-199a-5p attenuates the expression of Vps26A, Rab9B, and M6PR, thereby controlling RT from endosomes to the trans-Golgi network (TGN). Importantly, we found that overexpression of a Vps26A construct resistant to the inhibitory action of miR-199a-5p abrogates the effect of miR-199a-5p on RT. Finally, we demonstrate that miR-199-5p overexpression attenuates Shiga toxin type 1 (Stx1)-mediated inhibition of protein biosynthesis. In summary, our work identifies the first noncoding RNA that influences RT and reduces the inhibition of protein biosynthesis caused by bacterial toxins.

Keywords: bacterial toxins; dynamin; miRNAs; retrograde transport.


Figures

FIG 1
FIG 1
miR-199a is encoded in DNM locus genomic locations and regulates the expression of genes associated with retrograde transport (RT). (A) Schematic representation of genomic locations of DNM2 gene and intronic mir-199a1. (B) Gene ontology analysis of the miR-199a/b target genes predicted using Panther software. A protein-protein interaction analysis scheme of selected predicted miR-199a-5p target genes using STRING 9.1 software and Navigator 2.2 is shown. RT-related protein-coding genes are highlighted in red. (C and D) Luciferase reporter activity (C) in COS7 cells transfected with control mimic (CM) or miR-199a-5p mimic and the indicated human 3′-UTR sequences containing or not containing (wild-type [WT]) the indicated point mutations (PM) in the miR-199a-5p-binding sites (D). DM, double mutation; MUT, mutant construct. (E) Quantitative real-time PCR analysis of Vps26A, Rab9B, Rab7A, and SNX6 mRNA expression in HeLa cells transfected with CM and miR-199a-5p mimic. (F) Western blot analysis of Vps26A, Rab9B, and Rab7A in HeLa cells transfected with CM or miR-199a-5p. Hsp90 was used as a loading control. (G) Quantitative real-time PCR analysis of Vps26A, Rab9B, Rab7A, and SNX6 expression in HeLa cells transfected with control inhibitor or miR-199a-5p inhibitor. (H) Western blot analysis of Vps26A, Rab9B, and Rab7A in HeLa cells transfected with control inhibitor (CI) or miR-199a-5p inhibitor Inh-199a-5p. (C) Data are expressed as percentages of 3′-UTR activity of miR-199a-5p versus that in CM-transfected cells and represent the mean values ± SEM of a representative experiment performed three times in triplicate. (E and G) Data are expressed as mean values ± SEM and are representative of ≥3 independent experiments performed in triplicate. *, P ≤ 0.05. (F and H) MW, molecular weight in thousands.
FIG 2
FIG 2
miR-199a-5p regulates Shiga toxin internalization in HeLa cells. (A and B) CM- and miR-199a-5p-transfected cells were incubated with Cy3-StxB (5 μg/ml) on ice for 48 h and then shifted to 37°C for 30 min (A, top, and B) and 60 min (A, bottom) Cells were fixed and labeled with anti-GM130 antibody (A), anti-EEA1 antibody (B), and DAPI (4′,6-diamidino-2-phenylindole) (A and B). Z projections of confocal stacks are shown. Note that miR-199a-5p-overexpressing cells accumulated StxB in peripheral membranes. Scale bar = 15 μm. Magnif, magnifications of areas in dotted boxes. Scale bar = 10 μm. (C) HeLa cells treated with Inh-199a-5p were incubated for 30 min and 60 min with Cy3-StxB as described in the legend to panels A and B. (D and E) Quantification of Manders' coefficients for colocalization of Cy3-StxB localized in the Golgi apparatus (GM130, at 60 min) or early endosomes (EEA1, at 30 min) in experiments whose results are shown in panels A and C or B, respectively. (F) Quantification of Golgi apparatus fragments in control mimic (CM)- and miR-199a-5p-transfected cells in experiments whose results are shown in panels A to C. (G) Western blot analysis of GM130, EEA1, and Vps26A in cells transfected with CM or miR-199a-5p mimics. MW, molecular weight in thousands. Right, quantification of the relative amounts of proteins. The mean values ± SEM from three independent experiments are shown. P values were calculated using the t test. *, P ≤ 0.05.
FIG 3
FIG 3
miR-199a-5p protects against Shiga toxin intoxication in HeLa cells. (A) HeLa cells were transfected for 48 h with control mimic (CM) and miR-199a-5p before the addition of Shiga toxin (StxB) for 1 h. Intoxication of HeLa cells is shown. Each point corresponds to the mean value ± SEM from a representative experiment out of two to three determinations. (B) Protection factors calculated over the indicated number of experiments. Mean values ± SEM are shown. P values were calculated using the t test. *, P ≤ 0.05.
FIG 4
FIG 4
Vps26A is necessary for Shiga toxin internalization and maintenance of Golgi apparatus structure in miR-199a-5p-overexpressing HeLa cells. (A and B) HeLa cells were cotransfected as indicated with control mimic (CM) (A) or miR-199a-5p (B) and GFP (GFP empty), Vps26A-GFP, or Rab9-YFP for 48 h. Live cells were incubated with Cy3-StxB (5 μg/ml) on ice and then shifted to 37°C for 60 min. After Cy3-StxB internalization, cells were fixed and labeled with anti-GM130 antibody and DAPI. Z projections of confocal stacks are shown. The arrow indicates an miR-199a-5p-overexpressing cell with increased accumulation of StxB in peripheral membranes, and white arrowheads show Vps26A-GFP cells that efficiently accumulated StxB in the Golgi apparatus area, as indicated by GM130 labeling. Yellow arrowheads show dispersed Golgi apparatus structures. Scale bar = 15 μm. Right, colocalization coefficients for Cy3-StxB and GM130 (A) and quantification of Golgi apparatus fragments (B) under the indicated conditions in three independent experiments. Data are expressed as mean values ± SEM. *, P ≤ 0.05; #, P > 0.05.
FIG 5
FIG 5
miR-199a-5p regulates the intracellular localization and glycosylation of TGN46. (A) Steady-state intracellular location of TGN46 in HeLa cells transfected with control mimic (CM) and miR-199a-5p for 48 h and costained with GM130. Scale bar = 25 μm. Magnif, magnification of areas in dashed boxes. Scale bar = 10 μm. Right, colocalization coefficients for GM130 and TGN46. Data are from three independent experiments and are expressed as mean values ± SEM. (B) Representative Western blot analysis of TGN46 in HeLa cells transfected with CM or miR-199a-5p mimic after 48 h. MW, molecular weight in thousands.
FIG 6
FIG 6
Vps26A overexpression leads to recovery from miR-199a-5p inhibition of TGN46 retrograde transport. (A) Immunofluorescence analysis showing HeLa cells cotransfected with control mimic (CM) and Vps26A-GFP (top left) or miR-199a-5p and Vps26A-GFP (bottom left) for 48 h. Cells were fixed and labeled with anti-TGN46 antibody, anti-GM130 antibody, and DAPI, and the steady-state localization of TGN46 and GM130 was observed. Z projections of confocal stacks are shown. Scale bar = 25 μm. Magnified images of areas in dashed boxes are shown to the right. Scale bar = 10 μm. (B) Colocalization coefficients for TGN46 and GM130 under the indicated conditions. (C) Representative Western blot analysis of TNG46, Vps26, Vps26-GFP, actin, GFP, GM130, and Hsp90 in HeLa cells transfected as indicated (CM and EGFP, miR-199a-5p and EGFP, CM and Vps26A-GFP, and miR-199a-5p and Vps26A-GFP). Actin and Hsp90 were used as loading controls. MW, molecular weight in thousands. Right, quantification of mature TGN46 (110 kDa). Data are expressed as mean percentages of the total amount of TGN46 ± SEM. *, P ≤ 0.05; #, P > 0.05.
FIG 7
FIG 7
miR-199a-5p controls M6PR expression. (A) Luciferase reporter activity in COS7 cells transfected with control mimic (CM) or miR-199a-5p mimic and M6PR 3′ UTR containing or not containing (WT, wild-type) the indicated point mutations (PM) in the miR-199a-5p-binding sites. Data are expressed as percentages of M6PR 3′-UTR activities in miR-199a-5p- versus CM-transfected cells. *, P ≤ 0.05. DM, double mutation. (B) Quantitative real-time PCR analysis of M6PR expression in HeLa cells transfected with control mimic (CM) and miR-199a-5p mimic after 48 h. (C) Representative Western blot analysis of M6PR expression in HeLa cells treated as described in the legend to panel B. (B and C) Data are expressed as mean values ± SEM and are representative of the results of ≥3 experiments in triplicate. *, P ≤ 0.05. (D) Immunofluorescence analysis of Cy3-StxB internalization in HeLa cells cotransfected with CM and M6PR-GFP or miR-199a-5p and M6PR-GFP for 48 h. Steady-state localization is shown in Z projections of confocal stacks. Scale bar = 20 μm.
FIG 8
FIG 8
miR-199a-5p regulates M6PR plasma membrane expression and M6PR intracellular transport. (A) Immunofluorescence analysis showing steady-state localization of endogenous M6PR and Vps26A after 48 h of transfection with CM and miR-199a-5p. Scale bar = 25 μm. Magnif, magnification of areas in dotted boxes. Scale bar = 5 μm. (B) Representative flow cytometry histograms of total M6PR staining (top) and extracellular M6PR (bottom). Right, quantification of geometric mean fluorescence. AU, arbitrary units. (C) Immunofluorescence analysis showing HeLa cells transfected with CM or miR-199a-5p as indicated and incubated with anti-M6PR antibody for 60 min at 4°C and then either fixed and stained with anti-mouse Alexa Fluor 488-conjugated M6PR antibody without Triton X-100 (Tx-100; top panels) or allowed to internalize antibody complexes for 60 min at 37°C, fixed with PFA, and stained with anti-mouse Alexa Fluor 488-conjugated antibody (bottom panels). The Tx-100 permeabilization step was included to visualize internal compartments. To visualize the F-actin fibers and nuclei, phalloidin red and DAPI were used, respectively. Scale bar = 25 μm.
FIG 9
FIG 9
miR-199a-5p regulates endolysosomal trafficking. (A) Confocal microscopy immunofluorescence images showing subcellular localization of CD63 subjected to LysoTracker internalization for 30 min at 37°C in HeLa cells transfected with CM or miR-199a-5p. Magnif, magnification of areas in dashed boxes. Scale bar = 15 μm. (B) Flow cytometry analysis of LysoTracker internalization at 37°C in HeLa cells treated as described in the legend to panel A. Data are expressed as the geometric mean values (Gmean) from three independent experiments. Data are expressed as geometric mean values (Gmean) ± SEM from three independent experiments. (C) Results of flow cytometry analysis of CM- or miR-199a-5p-transfected HeLa cells that were cultured in the presence of 200 μg/ml fluorescent DQ green BSA for 1 h at 37°C and then incubated at 37°C for 2 h. Data are expressed as fold change of Gmean ± SEM. (D) HeLa cells were transfected with CM and miR-199a-5p, and 24 h after transfection, cells were rinsed with PBS and incubated in serum-free culture medium for 24 h. The medium was collected and precipitated with trichloroacetic acid (TCA), and the resulting pellets were analyzed by 4-to-20% acrylamide gradient SDS-PAGE and immunoblotted with rabbit polyclonal antibody against cathepsin D (CatD). Blots were also probed with antibody to Hsp90 as a loading control. The positions of molecular weight markers (MW; in thousands) and of the precursor (p), intermediate (i), and mature (m) forms of cathepsin D are indicated. Bottom, quantification of the results of 3 independent experiments. (E) Western blot analysis of EGFR, p62, LC3B-I/LC3B-II, and Vps26A protein levels in CM- and miR-199a-5p-transfected cells. Bottom, quantification of the results. (F) EGFR degradation assay in HeLa cells transfected with CM or miR-199a-5p and stimulated with EGF for the indicated times. Right, quantification of the results. (D to F) Error bars indicate SEM. *, P ≤ 0.05. (G) Immunofluorescence analysis of LC3B in HeLa cells transfected with CM or miR-199a-5p. Scale bar = 15 μm.
FIG 10
FIG 10
Proposed model of regulation of retrograde transport by DNM/mir-199a-5p. Left, schematic model summarizing the effects on endolysosomal system of basal miR-199a-5p expression, in which normal flow of endocytic routes provides cargoes to different cell compartments to maintain cell homeostasis. Right, the effect of miR-199a-5p overexpression, which suppresses RT and endolysosomal trafficking, causing failure of proper organelle maintenance, including Golgi apparatus and lysosomes. EE, early endosome; LE, late endosome; LY, lysosome.

Similar articles

Cited by

References

    1. Wang S, Sun H, Tanowitz M, Liang XH, Crooke ST. 2017. Intra-endosomal trafficking mediated by lysobisphosphatidic acid contributes to intracellular release of phosphorothioate-modified antisense oligonucleotides. Nucleic Acids Res 45:5309–5322. doi:10.1093/nar/gkx231. - DOI - PMC - PubMed
    1. Johannes L, Wunder C. 2016. Retromer sets a trap for endosomal cargo sorting. Cell 167:1452–1454. doi:10.1016/j.cell.2016.11.026. - DOI - PubMed
    1. Short B. 2015. Sorting out endosome form and function. J Cell Biol 210:870. doi:10.1083/jcb.2106fta. - DOI - PMC - PubMed
    1. Bonifacino JS, Rojas R. 2006. Retrograde transport from endosomes to the trans-Golgi network. Nat Rev Mol Cell Biol 7:568–579. doi:10.1038/nrm1985. - DOI - PubMed
    1. Amessou M, Carrez D, Patin D, Sarr M, Grierson DS, Croisy A, Tedesco AC, Maillard P, Johannes L. 2008. Retrograde delivery of photosensitizer (TPPp-O-beta-GluOH)3 selectively potentiates its photodynamic activity. Bioconjug Chem 19:532–538. doi:10.1021/bc7003999. - DOI - PubMed

Publication types

MeSH terms

LinkOut - more resources