. 2018 Apr 3;115(14):E3296-E3304.
doi: 10.1073/pnas.1721578115. Epub 2018 Mar 19.

mTOR signaling in VIP neurons regulates circadian clock synchrony and olfaction

Affiliations

mTOR signaling in VIP neurons regulates circadian clock synchrony and olfaction

Dong Liu et al. Proc Natl Acad Sci U S A. .

Abstract

Mammalian/mechanistic target of rapamycin (mTOR) signaling controls cell growth, proliferation, and metabolism in dividing cells. Less is known regarding its function in postmitotic neurons in the adult brain. Here we created a conditional mTOR knockout mouse model to address this question. Using the Cre-LoxP system, the mTOR gene was specifically knocked out in cells expressing Vip (vasoactive intestinal peptide), which represent a major population of interneurons widely distributed in the neocortex, suprachiasmatic nucleus (SCN), olfactory bulb (OB), and other brain regions. Using a combination of biochemical, behavioral, and imaging approaches, we found that mice lacking mTOR in VIP neurons displayed erratic circadian behavior and weakened synchronization among cells in the SCN, the master circadian pacemaker in mammals. Furthermore, we have discovered a critical role for mTOR signaling in mediating olfaction. Odor stimulated mTOR activation in the OB, anterior olfactory nucleus, as well as piriform cortex. Odor-evoked c-Fos responses along the olfactory pathway were abolished in mice lacking mTOR in VIP neurons, which is consistent with reduced olfactory sensitivity in these animals. Together, these results demonstrate that mTOR is a key regulator of SCN circadian clock synchrony and olfaction.

Keywords: SCN; VIP; circadian clock; mTOR; olfaction.


Conflict of interest statement

The authors declare no conflict of interest.

Figures

Fig. 1.
Fig. 1.
mTOR is knocked down in VIP neurons in the SCN of Mtorflx/flx:Vip-Cre mice. (A) Confocal microscopic images of immunofluorescent labeling for p-S6 (red) and VIP (green) in the suprachiasmatic nucleus. For these experiments, the mice were entrained to a 12-h/12-h light/dark cycle and killed at ZT6. p-S6 and VIP expression was colocalized in the ventral SCN in Mtorflx/flx mice. Note that the number of cells coexpressing p-S6 and VIP (yellow) was decreased in the SCN of the Mtorflx/flx:Vip-Cre mice. Also note that intensities of p-S6 and VIP were both decreased in the ventral SCN. Framed regions are magnified and shown below. (Scale bars, 100 μm.) (B) Percentages of cells expressing p-S6, VIP, or both in the SCN. (C) Representative Western blots of forebrain lysates. (D) Quantitation of the blot intensities is shown. Values are presented as the mean ± SEM. Note that the level of prepro-VIP was markedly reduced in the Mtorflx/flx:Vip-Cre brain but VPAC2 level was not changed. mTOR and p-S6 levels were also significantly reduced. Four Mtorflx/flx and four Mtorflx/flx:Vip-Cre mice were used in the experiment. *P < 0.05 vs. Mtorflx/flx.
Fig. 2.
Fig. 2.
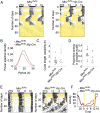
Altered circadian behavior in Mtorflx/flx:Vip-Cre mice. (A) Representative double-plotted actograms of mouse wheel-running activities from one Mtorflx/flx (Left) and one Mtorflx/flx:Vip-Cre (Right) mouse. The x axis (Top) indicates the ZT of the day. The y axis (Left) indicates the number of days during the experiment. For these experiments, mice were first entrained to 12-h/12-h light/dark cycles for 7 d and then released into constant darkness for 10 d. Next, animals were reentrained to 12-h/12-h LD for 10 d, and then the LD cycle was abruptly advanced by 8 h. Twenty days later, the LD cycle was delayed by 8 h. After 11 d in the delayed LD cycle, the mice were released into constant light for 38 d. Yellow areas indicate light periods. (B) Averaged Fourier periodograms in LL from all mice. Fourteen Mtorflx/flx and 14 Mtorflx/flx:Vip-Cre mice were used in the experiment. Note that the overall rhythmicity of the Mtorflx/flx:Vip-Cre mice was weaker compared with the Mtorflx/flx mice, as indicated by a lower mean power spectral density (normalized to show proportion power at each frequency). (C) Cycle-to-cycle variability in period in LL is shown as individual values. (D) Proportion energy in circadian scale (indicating how well-consolidated activity is as a circadian rhythm) in LL is shown as individual values. (E) Representative double-plotted actograms of wheel-running activities from an Mtorflx/flx (Left) and Mtorflx/flx:Vip-Cre (Right) mouse. For this experiment, the mice were entrained to a 12-h/12-h LD cycle for 10 d, exposed to a skeleton photoperiod (1-h/11-h/1-h/11-h LDLD) for 28 d, and then released into DD for 21 d. Five Mtorflx/flx and seven Mtorflx/flx:Vip-Cre mice were used in the experiment. Yellow areas indicate light periods. (F) Average activities (rev per 10 min) during the skeleton photoperiod from all of the mice.
Fig. 3.
Fig. 3.
mTOR inhibition desynchronizes SCN neurons. (A) Representative raster plots show the daily expression pattern of PER2::LUCIFERASE from 25 representative ROIs (indicators of rhythmic cells) in an SCN slice from an Mtorflx/flx (Left) or Mtorflx/flx:Vip-Cre (Right) mouse. Note that the cellular rhythms of Mtorflx/flx:Vip-Cre mice were more loosely synchronized compared with the Mtorflx/flx mice. (B) Representative raster plots show the daily expression pattern of PER2::LUCIFERASE from 25 representative ROIs in an SCN slice treated with DMSO (CTR) or the mTOR inhibitor PP242 (1 µM). Note that PP242 significantly disrupted synchronization of SCN cells. (C and D) Quantification of cellular synchronization within each slice using the synchronization index. (E) Percentages of rhythmic ROIs in DMSO (CTR) or PP242-treated SCN slices. Data in CE are presented as individual values as well as mean ± SEM. For C and D, four Mtorflx/flx SCN slices and six Mtorflx/flx:Vip-Cre slices were used in the experiment. For E, seven SCN slices were used for control and six slices were used for PP242 treatment.
Fig. 4.
Fig. 4.
mTOR signaling in the olfactory bulb. (A) Representative fluorescent microscopic images showing immunolabeling for VIP (green) and p-S6 (red) in the mouse OB. Framed regions are magnified and shown (Right) as a merged image. White arrows indicate cells expressing both p-S6 and VIP in the external plexiform layer. (Scale bars, 100 μm.) (B) Quantitation of p-S6 labeling intensity in the OB. Note that p-S6 level was markedly decreased in the VIP-expressing layer (EPL) but not in a non-VIP layer (mitral cell layer) in Mtorflx/flx:Vip-Cre mice. (C) Quantitation of p-S6 labeling intensity in the OB. For this experiment, mice were exposed to an odorant (essence oil) for 15 min at CT15 and killed 45 min after the end of odor exposure. See Materials and Methods for detailed methods of quantitation. Note that odor evoked significant p-S6 up-regulation in the OB of Mtorflx/flx mice but not in Mtorflx/flx:Vip-Cre mice. For B and C, data are presented as individual values as well as mean ± SEM. Three mice were included in each group and three brain sections were used from each animal.
Fig. 5.
Fig. 5.
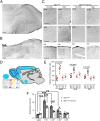
Olfactory responses are blunted in Mtorflx/flx:Vip-Cre mice. (A and B) Representative bright-field microscopic images of immunolabeling for c-Fos. Low-magnification images of the main olfactory bulb (A) and piriform cortex (B) from an odor-stimulated Mtorflx/flx mouse are shown. (Scale bars, 100 μm.) Curved dashed line indicates the border of the anterior olfactory nucleus. (C) High-magnification images of the MOB, anterior olfactory nucleus, and PIR from the framed regions in A and B. For this experiment, mice were exposed to an odorant for 15 min starting at CT15 and killed 45 min after the end of odor exposure. Note that odor evoked significant c-Fos expression in the MOB, AON, and PIR in Mtorflx/flx mice. c-Fos induction by odor in these regions was abolished in the Mtorflx/flx:Vip-Cre mice. (Scale bars, 100 μm.) (D) A schematic diagram of the olfactory pathway. Briefly, various odorants reach different olfactory receptors on the olfactory receptor neurons, which project axons to separate glomeruli in the OB and synapse on mitral and tufted (M/T) cells. Olfactory information from the OB is relayed via M/T cell axons directly to pyramidal cells in the PIR. The AON has reciprocal connections with both the OB and PIR. (E) Numbers of c-Fos–positive cells per mm2. See Materials and Methods for detailed methods of quantitation. Data are presented as individual values as well as mean ± SEM for each group. Three mice were included in each group and three brain sections were used from each animal. NO, no odor; O, odor. (F) Mouse exploratory time in the olfactory sensitivity test. Mice were exposed to one of four different dilutions of cinnamon extract on filter paper for a 3-min session. Total time spent exploring the filter paper was assessed. Note that the Mtorflx/flx:Vip-Cre mice exhibited decreased olfactory sensitivity compared with the Mtorflx/flx mice. *P < 0.05, **P < 0.01, ***P < 0.001.

Similar articles

Cited by

References

    1. Wullschleger S, Loewith R, Hall MN. TOR signaling in growth and metabolism. Cell. 2006;124:471–484. - PubMed
    1. Saxton RA, Sabatini DM. mTOR signaling in growth, metabolism, and disease. Cell. 2017;168:960–976. - PMC - PubMed
    1. Ferrari S, Bandi HR, Hofsteenge J, Bussian BM, Thomas G. Mitogen-activated 70K S6 kinase. Identification of in vitro 40 S ribosomal S6 phosphorylation sites. J Biol Chem. 1991;266:22770–22775. - PubMed
    1. Pende M, et al. S6K1(−/−)/S6K2(−/−) mice exhibit perinatal lethality and rapamycin-sensitive 5′-terminal oligopyrimidine mRNA translation and reveal a mitogen-activated protein kinase-dependent S6 kinase pathway. Mol Cell Biol. 2004;24:3112–3124. - PMC - PubMed
    1. Weng QP, et al. Regulation of the p70 S6 kinase by phosphorylation in vivo. Analysis using site-specific anti-phosphopeptide antibodies. J Biol Chem. 1998;273:16621–16629. - PubMed

Publication types

Substances