. 2018 Apr 3;115(14):E3286-E3295.
doi: 10.1073/pnas.1721226115. Epub 2018 Mar 19.

Sensorineural hearing loss degrades behavioral and physiological measures of human spatial selective auditory attention

Affiliations

Sensorineural hearing loss degrades behavioral and physiological measures of human spatial selective auditory attention

Lengshi Dai et al. Proc Natl Acad Sci U S A. .

Abstract

Listeners with sensorineural hearing loss often have trouble understanding speech amid other voices. While poor spatial hearing is often implicated, direct evidence is weak; moreover, studies suggest that reduced audibility and degraded spectrotemporal coding may explain such problems. We hypothesized that poor spatial acuity leads to difficulty deploying selective attention, which normally filters out distracting sounds. In listeners with normal hearing, selective attention causes changes in the neural responses evoked by competing sounds, which can be used to quantify the effectiveness of attentional control. Here, we used behavior and electroencephalography to explore whether control of selective auditory attention is degraded in hearing-impaired (HI) listeners. Normal-hearing (NH) and HI listeners identified a simple melody presented simultaneously with two competing melodies, each simulated from different lateral angles. We quantified performance and attentional modulation of cortical responses evoked by these competing streams. Compared with NH listeners, HI listeners had poorer sensitivity to spatial cues, performed more poorly on the selective attention task, and showed less robust attentional modulation of cortical responses. Moreover, across NH and HI individuals, these measures were correlated. While both groups showed cortical suppression of distracting streams, this modulation was weaker in HI listeners, especially when attending to a target at midline, surrounded by competing streams. These findings suggest that hearing loss interferes with the ability to filter out sound sources based on location, contributing to communication difficulties in social situations. These findings also have implications for technologies aiming to use neural signals to guide hearing aid processing.

Keywords: binaural hearing; electroencephalography; hearing impairment.


Conflict of interest statement

The authors declare no conflict of interest.

Figures
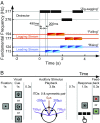
Fig. 1.
Fig. 1.
Outline of the stimuli and experimental procedures. (A) Each trial presented three isochronous streams, each making up a melody of H and L notes. The onsets of the notes in each stream were staggered in time to allow EEG responses to be isolated in time. The Distractor Stream always began first, made up of complex tones with fundamental frequencies of 275 Hz and 317 Hz (composed of the first three harmonics at equal amplitude). The Leading Stream (five notes) began next, and consisted of complex tones of 113 Hz and 124 Hz. The Lagging Stream (four notes) started last and consisted of complex tones of 177 Hz and 194 Hz. Leading and Lagging Stream notes each contained the first 33 harmonics of their fundamental, at equal amplitude. Each melody either was rising, falling, or zig-zagging. (B) Each trial began with a fixation dot, followed by a visual cue, followed by the auditory stream mixture. The visual cue indicated the direction to attend in the upcoming auditory mixture (center, left, or right). The three auditory streams were then presented from three different lateral angles, simulated using only ITDs: center, and symmetrically on the left and right. Left and right streams either both had small or both had large ITDs, depending on the trial. Listeners were cued to identify the melodic contour of the target stream at the end of each trial, and were provided feedback after they responded.
Fig. 2.
Fig. 2.
HI listeners performed worse in a spatial selective auditory attention task than NH listeners. (A) Percent correct scores on the main attention task for both NH (left: red and blue bars) and HI (right: light-blue and orange bars), with across-subject SDs (note that, in this figure and throughout, intersubject differences are large, but consistent across conditions, leading to large error bars despite consistent effects of condition). Overall, NH listeners outperformed HI listeners. Within both groups, performance was better when sources were separated by a large ITD (filled bars) than a small ITD (open bars). For NH (but not HI) listeners, performance was better for the higher-pitched Lagging Stream (red bars) than the Leading Stream (blue bars). (B) The SLA, or difference in percent correct performance for the same spatial configuration when the target is on the side compared with when it is at midline, plotted as a function of the average performance for this spatial configuration across all target locations. Individual listener results for each main condition are shown by individual data points. Expected middle quartiles of the distribution, based on a second-order polynomial curve fit, are shown in gray. When near chance or near perfect performance, there is little effect of target location, but the SLA is generally positive for midlevel performance. Thus, individual subject ability in a given spatial configuration determines whether one sees evidence that performance for a target at midline, surrounded by distractors, is worse than performance when the target is to the side.
Fig. 3.
Fig. 3.
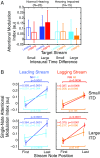
NH listeners show weaker and less consistent modulation of neural responses with the focus of attention. (A) The AMI, or normalized change in the ERP magnitude due to shifts in attentional focus, is plotted using the same layout as in Fig. 2. Error bars show across-subject SDs. Overall, the AMI is greater in NH than HI listeners, as confirmed by a multiway ANOVA that finds hearing status to be a significant factor influencing AMI (see Attentional Modulation of Cortical Responses is Weak in HI Listeners). (B) NH, but not HI, listeners show a significant buildup of attention over the course of a trial. The AMI, or normalized change in the ERP magnitude due to shifts in attentional focus, is plotted for the first and last notes for both the Leading Stream (Left) and the Lagging Stream (Right), with SDs across subjects. Results for small ITDs (Top) and large ITDs (Bottom). (Insets) The Spearman’s rho rank correlation between the AMI strength and the note position, from first to last. Whereas there is robust evidence that attentional modulation increases from note to note for NH listeners based both on differences in the AMI from first to last notes and from rank correlations (blue and red), there is little evidence of such effects in the HI listeners (light blue and orange).
Fig. 4.
Fig. 4.
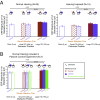
The first note of the Distractor Stream is not modulated by spatial focus of attention for either NH or HI listeners. (A) The ERP magnitudes evoked by the first note of the Distractor in the main attention experiment are plotted for different spatial configurations, both for NH (Left) and HI (Right) subjects, with across-subject SDs. Because results were left−right symmetric, spatial configurations are combined for mirror-symmetric results. Each set of bars corresponds to a different Distractor Stream ITD (zero ITD, small ITD, large ITD, from left to right). Within each set of bars, results are broken down by the direction of attentional focus, denoted by the color wedge (maroon for central, purple for lateral). For both NH and HI listeners, the ERP for the large ITD Distractor has a greater magnitude than for the zero or small ITD. (B) ERP magnitudes for a subset of the NH listeners who completed a passive-listening control experiment, in a layout like that in A. The passive-listening data are shown in green, alongside the results from the main experiment for the same subset of subjects (included in A). The differences in ERP size seen in A are present in the passive-listening results, and thus can be attributed to differences in the Distractor ITD, rather than top-down attention.
Fig. 5.
Fig. 5.
NH listeners are equally good at suppressing later Distractor notes, independent of the spatial configuration, but HI listeners suppress Distractor notes only weakly when trying to focus attention on a midline target (with the Distractor Stream to one side). The average ERP magnitude evoked by later notes of the Distractor are plotted for NH (Top) and HI (Bottom) subjects, with across-subject SDs. Each set of bars corresponds to a different Distractor Stream ITD (zero ITD, small ITD, large ITD, from left to right). Within each set of bars, results are broken down by the direction of attentional focus, denoted by the bar color (maroon for central, purple for lateral) and labeled according to target ITD. HI listeners had larger ERPs, overall, for small ITD and large ITD Distractors (middle and right columns). In addition, in these configurations, HI listeners had significantly larger Distractor ERPs when the target was at midline compared with when the target was to one side. These results show that HI listeners tend to be worse at suppressing task-irrelevant Distractors than NH listeners, especially in the most challenging listening condition, when the target is at midline and surrounded by competing streams.
Fig. 6.
Fig. 6.
For both NH and HI listeners, an individual’s performance on the selective attention task correlates with the strength of their attentional modulation, showing that listeners who perform well on the attention task show stronger modulation of neural responses based on attentional focus. Each of the four panels shows a scatterplot of individual subjects’ performance as a function of their AMI for a given condition. Plotted results when attending to (Left) the Leading Stream and (Right) the Lagging Stream. Results for (Top) the small ITD configurations and (Bottom) the large ITD configurations. Within each panel, results are shown for both NH (primary colors) and HI (secondary colors) listeners. Regression lines of the appropriate color show the relationship between AMI and performance for the corresponding listener group in that condition. It is noteworthy that the worst HI listeners are near chance levels on the task, and show no significant attentional modulation; however, even though the worst NH listeners may show no significant attentional modulation, they nonetheless perform well above chance on the attention task.
Fig. 7.
Fig. 7.
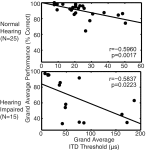
For both NH and HI listeners, an individual’s overall performance level on the selective attention task is negatively correlated with their average ITD threshold. Scatterplots for NH listeners (Top) and HI listeners (Bottom), showing overall percent correct as a function of ITD threshold. Best-fit regression lines are shown as lines in each panel. Note that the x axes cover a much larger range for the HI listeners than for the NH listeners. For both groups, overall performance is correlated significantly with performance.

References

    1. Colburn HS. Binaural interaction and localization with various hearing impairments. Scand Audiol Suppl. 1982;15:27–45. - PubMed
    1. Mackersie CL, Prida TL, Stiles D. The role of sequential stream segregation and frequency selectivity in the perception of simultaneous sentences by listeners with sensorineural hearing loss. J Speech Lang Hear Res. 2001;44:19–28. - PubMed
    1. Marrone N, Mason CR, Kidd G., Jr The effects of hearing loss and age on the benefit of spatial separation between multiple talkers in reverberant rooms. J Acoust Soc Am. 2008;124:3064–3075. - PMC - PubMed
    1. Best V, Marrone N, Mason CR, Kidd G, Jr, Shinn-Cunningham BG. Effects of sensorineural hearing loss on visually guided attention in a multitalker environment. J Assoc Res Otolaryngol. 2009;10:142–149. - PMC - PubMed
    1. Strelcyk O, Dau T. Relations between frequency selectivity, temporal fine-structure processing, and speech reception in impaired hearing. J Acoust Soc Am. 2009;125:3328–3345. - PubMed

Publication types

LinkOut - more resources