. 2018 Mar 19;9(1):1126.
doi: 10.1038/s41467-018-03512-5.

Glycogen synthase kinase 3 controls migration of the neural crest lineage in mouse and Xenopus

Affiliations

Glycogen synthase kinase 3 controls migration of the neural crest lineage in mouse and Xenopus

Sandra G Gonzalez Malagon et al. Nat Commun. .

Abstract

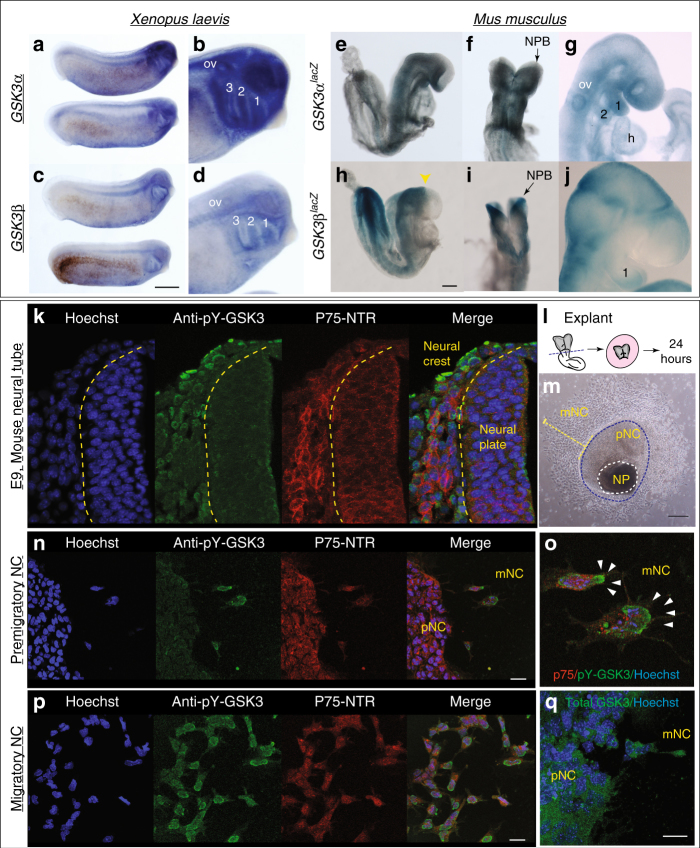
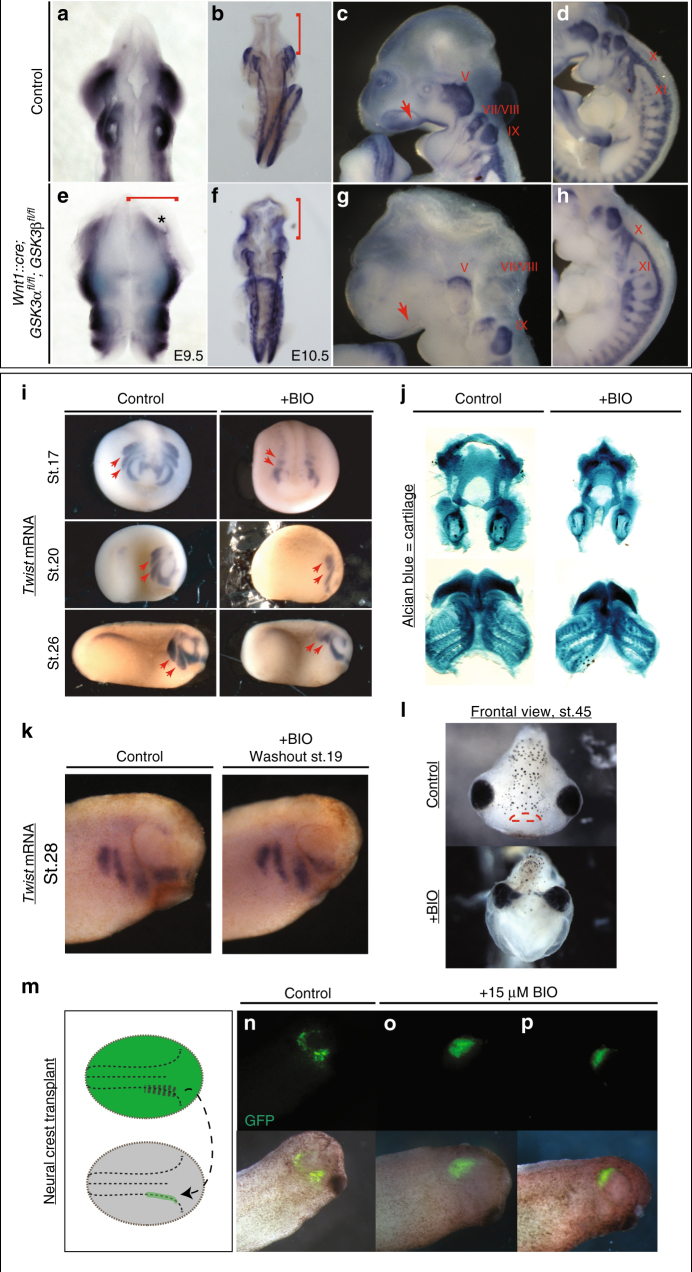
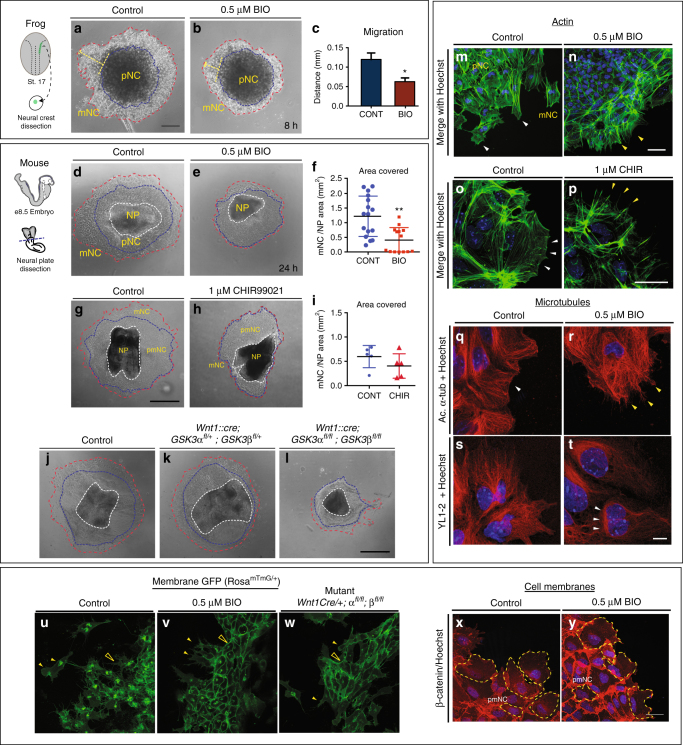
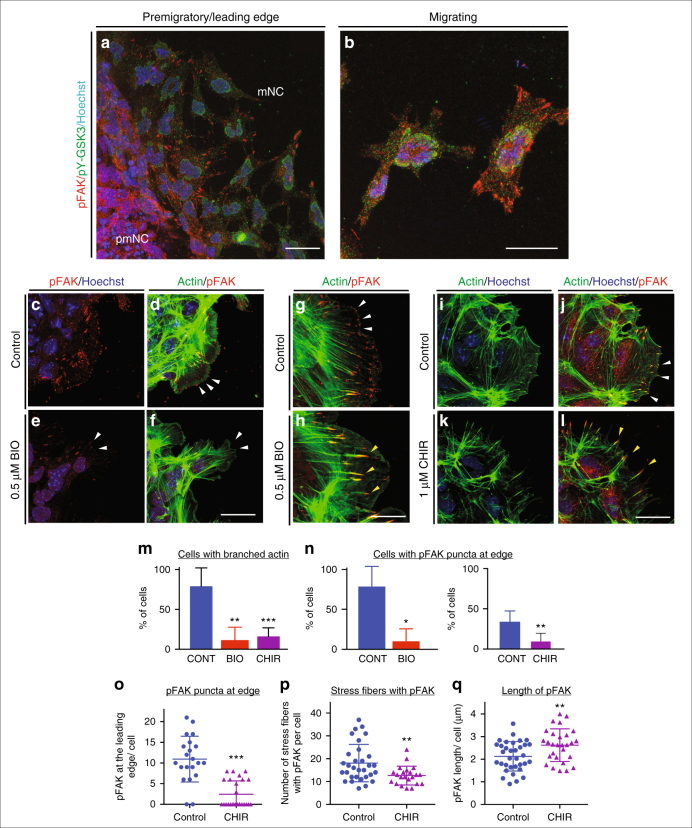
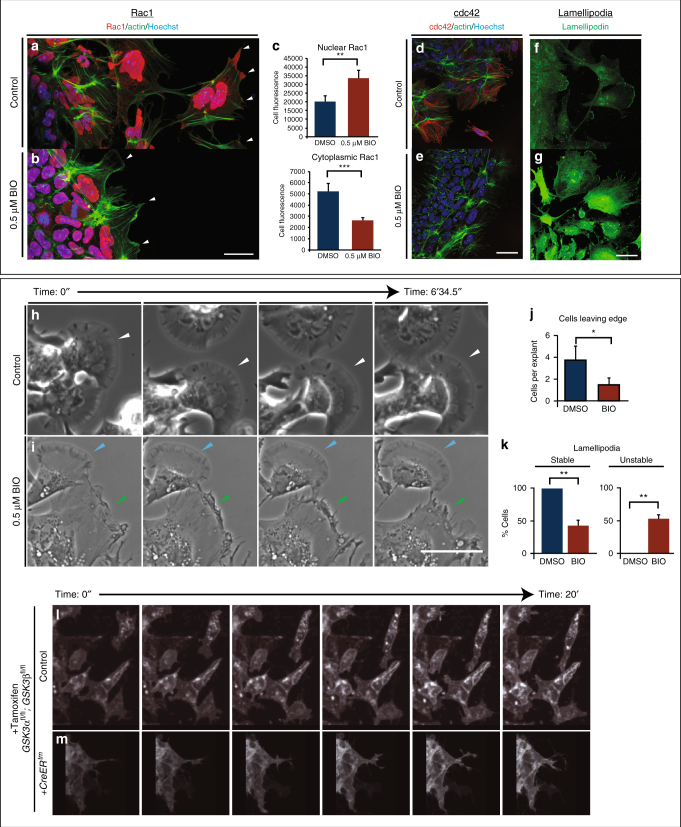
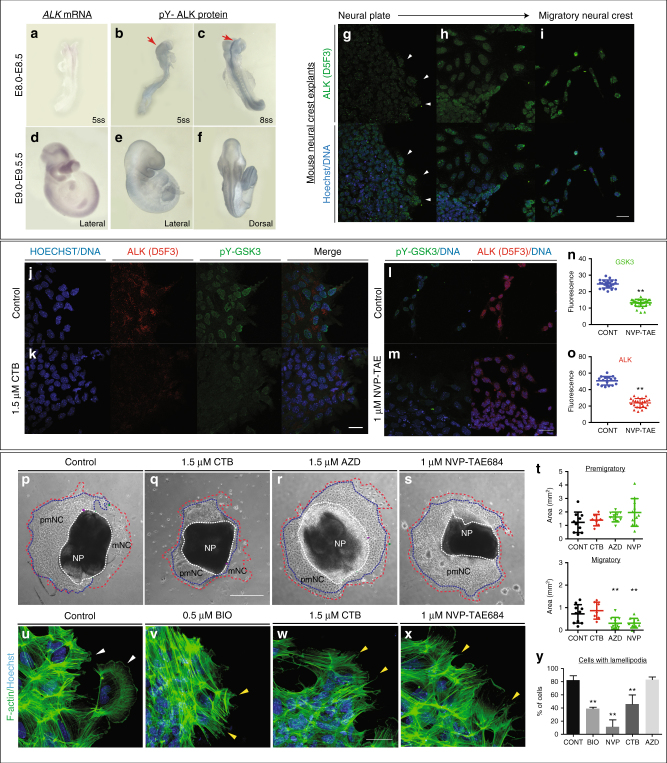
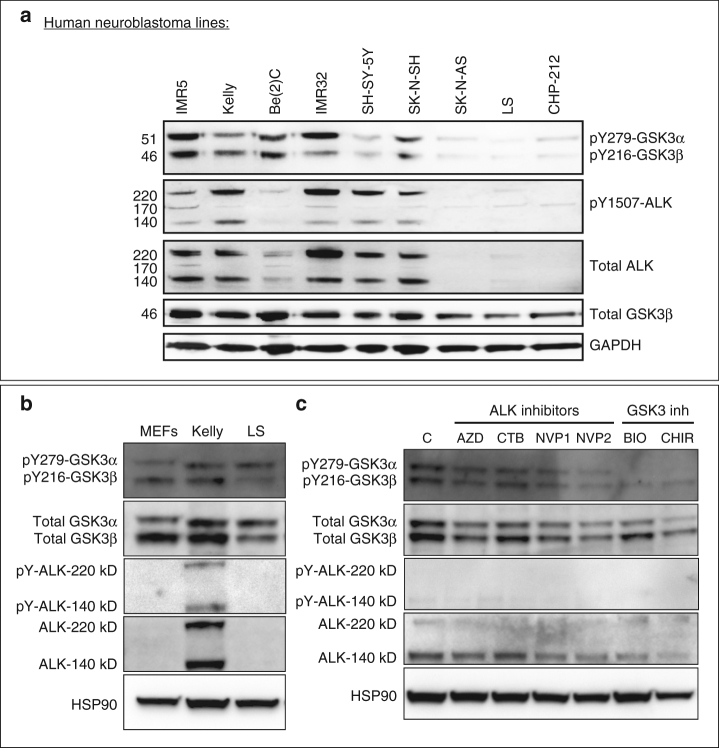
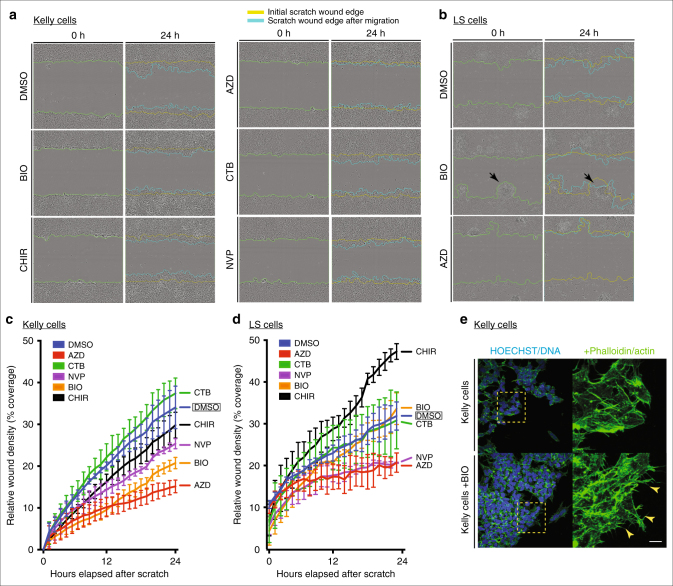
Neural crest migration is critical to its physiological function. Mechanisms controlling mammalian neural crest migration are comparatively unknown, due to difficulties accessing this cell population in vivo. Here we report requirements of glycogen synthase kinase 3 (GSK3) in regulating the neural crest in Xenopus and mouse models. We demonstrate that GSK3 is tyrosine phosphorylated (pY) in mouse neural crest cells and that loss of GSK3 leads to increased pFAK and misregulation of Rac1 and lamellipodin, key regulators of cell migration. Genetic reduction of GSK3 results in failure of migration. We find that pY-GSK3 phosphorylation depends on anaplastic lymphoma kinase (ALK), a protein associated with neuroblastoma. Consistent with this, neuroblastoma cells with increased ALK activity express high levels of pY-GSK3, and blockade of GSK3 or ALK can affect migration of these cells. Altogether, this work identifies a role for GSK3 in cell migration during neural crest development and cancer.


Conflict of interest statement

The authors declare no competing interests.

Figures

Fig. 1
Fig. 1
GSK3 genes are expressed during neural crest migration in the frog Xenopus laevis and mouse Mus musculus. a, b mRNA in situ hybridization for Gsk3α in X. laevis at stage (st) 25 (a) show expression in the pharyngeal pouches, brain, spinal cord and eye vesicle (b). c, d In situ hybridization for Gsk3β in X. laevis at st 25 (c). GSK3β is expressed in the pharyngeal pouches and the spinal cord as well as regions of the brain (d, scale bar = 0.5 mm). eg GSK3αlacZ is expressed in mice during neural crest migration stages. e, f In an e8.5 embryo GSK3αlacZ is expressed in the cephalic mesenchyme, in the neuroepithelium and in the cephalic neural fold. g By e9.5–10, GSK3αlacZ is expressed in the first and second branchial arches (1 and 2) and the frontonasal prominence. hj GSK3βlacZ is expressed in mice when neural crest is actively migrating. h, i In e8.5 embryos GSK3βlacZ is mainly expressed in the neuroectoderm, restricted to the prospective hindbrain and some areas in the mesenchyme, scale bar = 200 µm. j At e9.5, GSK3βlacZ is mainly expressed in BA1 and cranial ganglia and in the presumptive trigeminal ganglion. kp GSK3α/β are phosphorylated at tyrosines Y216/279 during cranial neural crest cell migration. k Transverse cranial section of e9 mouse showing immunoflourescent staining for Hoechst/DNA (blue), pY-GSK3 (green) and p75NTR (neural crest, red). l Schematic of e8.5 mouse embryo depicting cranial neural crest (CNC) dissection. m Bright-field image of mouse neural crest explant. Two types of cells surround the NP: premigratory neural crest (pNC) cells that are epithelial and migratory neural crest (mNC) scale bar, 250 μm. n Cells migrating away from the pNC begin to express pY-GSK3. pNC to the left. All neural crest express p75NTR (red). Note in merge that perinuclear expression of pY-GSK3 is invariably oriented in direction of migration (o, white arrowheads). p mNC cells express pYGSK3 (green) and p75-NTR (red). n, p scale bars = 25 µM. q Expression of total GSK3 is ubiquitous in pNC and mNC cells. Scale bar = 25 µM. All are representative images from at least three independent experiments
Fig. 2
Fig. 2
GSK3 is required for neural crest migration in vivo. ah mRNA in situ hybridization of Sox10, which marks migratory neural crest. a, e e9.5 mouse embryos (n = 3). bd, fh e10.5 mouse embryos (n = 3). a, b, e, f Dorsal views. c, d, g, h Lateral views of e10.5 control embryos. a, b In control embryos, Sox10 expression is absent in the brain (b, red bracket) but it is highly expressed along the embryo axis. e, f Neural crest-specific deletion of GSK3. Dorsal view of e10.5 mutant mouse in which Sox10 expression has accumulated in the brain (f, red bracket). c, d At e10.5, Sox10 marks cranial neural crest, which has migrated into the facial prominences (c, red arrow) and the cranial ganglia, including the trigeminal ganglia (V) and facial and acoustic nerves (VII/VIII), glossopharyngeal nerve (IX), vagus nerve (X) and the spinal accessory nerve (XI) (d). g, h e10.5 mutant mouse lost Sox10 expression, especially in the facial prominences (g, red arrow) and showed remarkably reduced expression in cranial ganglia and nerves X, XI. The dorsal root ganglia seem to be unaffected. i Twist expression marks migratory neural crest. BIO treatment from st12.5 results in a loss of twist expression at st17 (frontal views, st17). BIO treatment from st12.5 to st19 shows loss of twist expression at st20 and st26 (lateral views). The posterior streams are selectively impaired, red arrows (n ≥ 35). j BIO treatment resulted in a reduction of Alcian blue-stained facial cartilages, which are derived from neural crest (n = 12). k Twist expression shows that cell migration is regained by stage 28, following washout from the treatment with BIO from st12.5 to st19 (n = 3). l Frontal view of a tadpole at stage 45, previously treated with BIO (st12.5–st19). Note narrowing of the head structures and loss of the mouth (marked with red lines in control). mp GFP-labelled neural crest was grafted into a non-labelled embryo at stage 17 and grown to st28. GFP-labelled cells in control animals have migrated (n), while those treated with 15 µM BIO have not migrated (o, p) (n = 3)
Fig. 3
Fig. 3
GSK3 activity is required for neural crest cell migration. a, b Neural crest cells from st 17 Xenopus embryos (n = 9). a Control explants after 8 h in culture. b Upon GSK3 inhibition, neural crest cells spread significantly less than the controls. c Quantification of the distance migrated *p < 0.05. (d, g, j) Control mouse explants. e, h Explants treated with 0.5 µm BIO or 1 µM CHIR99021, respectively. Note the decrease in area covered by migratory neural crest (f, refers to d, e; i refers to g, h). Each dot represents one explant (**p < 0.001, unpaired t-test) jl Mouse explants from control (j), Wnt1::cre; GSK3afl/+; GSK3bfl/+ (k) and Wnt1::cre; GSK3afl/fl; GSK3bfl/fl complete mutants (l). Note the decrease in area covered in l (red dotted line). mp Filamentous actin (green) in neural crest explants. m, o Explants treated with DMSO (control) show accumulation of F-actin in lamellipodia in the leading edge (white arrowheads). Explants treated with n 0.5 µm BIO and p 1 μM CHIR lack lamellipodia and only show stress fibres at the cell edge (yellow arrowheads). qt Microtubules are labelled with acetylated α-tubulin or YL1-2. Controls show smooth lamellipodial edge (q) but BIO-treated cells show spiky protrusions (r). YL1-2 tubulin in control cells is distributed all throughout the cell (s); in BIO-treated cells (t), it is found in a perinuclear zone, at the rear of the nucleus. u Cranial neural crest explants from control e8.5 embryos carrying membrane GFP in the neural crest lineage. Migrating cells show an elongated morphology and have a dynamic cell–cell contact (see Supplementary Movies 1, 3, 6). Membrane GFP is unstable and intracellular. v In the BIO treatment, cells remain in contact with adjacent cells and multiple protrusions (yellow arrows). w Mutant cells carrying a neural crest-specific deletion of GSK3 (Wnt1Cre/+; GSK3afl/fl; GSK3bfl/fl) lose motility and maintain stable cell–cell contacts and membrane GFP. x, y β-Catenin staining in neural crest explants. β-Catenin is stable in BIO-treated cells (y). al Scale bar = 100 µm. my Scale bar = 25 µM. All are representative images from at least three independent experiments, except from j to l and w in which only one of each genotype was obtained
Fig. 4
Fig. 4
GSK3 allows FAK localization to establish lamellipodial protrusions at the leading edge in migrating neural crest cells. a, b Immunofluorescence for pFAK-Y397 (pFAK, red) and pY-GSK3 (green). a In control explants, pFAK is found at the leading edge of the delaminating cells and in migrating cells. b In migratory neural crest cells, pYGSK3 and pFAK are mutually exclusive. c, d pFAK is found in puncta at the leading edge of the cell co-localizing with lamellipodia. e, f Upon GSK3 inhibition, the cells lose pFAK at the leading edge. g, h pFAK accumulates at the tips of actin-rich fibres. Note the increase in length of pFAK associated with actin upon treatment with BIO (h). i, j Similarly, treatment with 1 µM CHIR elicits the same response (white and yellow arrowheads). al Scale bar = 25 µM. m, n Percentage bar charts representing a significant decrease in cells with branched actin (m) or showing pFAK puncta at the leading edge (n) when GSK3 is inhibited with either BIO or CHIR; **p ≤ 0.001 and ***p ≤ 0.0001, two-tailed unpaired t-test. oq Dot plots representing the number of pFAK puncta at the edge (o), the number of stress fibres containing pFAK (p) and the length of of pFAK (q) in control and CHIR-treated cells; each dot represents one cell. **p ≤ 0.001 and ***p ≤ 0.0001, two-tailed unpaired t-test
Fig. 5
Fig. 5
GSK3 is required to establish polarity and to form lamellipodia in migrating neural crest cells. a, b GSK3 inhibition increases nuclear RAC1 and reduces cytoplasmic RAC1 in neural crest cells. a In control explants, RAC1 (red) is high in the nucleus while in the cytoplasm it is enriched at cell protrusions (arrowheads). Actin was labelled with phalloidin (green). b In BIO-treated explants, nuclear RAC1 is high but cytoplasmic staining is lost (white arrowheads). c Relative levels of Rac1 fluorescence in the nucleus or the cytoplasm (n = 9) **p ≤ 0.001 and ***p ≤ 0.0001, two-tailed unpaired t-test. de GSK3 inhibition reduces the expression of cdc42 in neural crest cells. d Cdc42 is cytoplasmic and perinuclear in neural crest cells. e BIO-treated explants lose cdc42 staining. fg In controls, anti-lamellipodin (green) stains the ruffled edge of migrating cells. g In contrast, BIO-treated cells show increased total lamellipodin throughout the cell, losing specific localization at the cell edge. Scale bar, 20 μm. h, i Bright-field still images from controls (h) or BIO-treated samples (i) (n = 3 explants with ≥10 cells per explant). Control images show cells form fan-shaped stable lamellipodia and ready to migrate away from the cluster (h, white arrowheads). In treated cells, despite some cells form stable lamellipodia as found in controls (i, light blue arrowheads), cells predominantly formed an irregular protrusion that tend to retract (i, green arrowheads). Scale bar, 500 μm (see corresponding Supplementary Movies 6, 7). j Graph showing the number of cells delaminating from the premigratory neural crest cell clusters in 2 h. *p ≤ 0.05 and **p ≤ 0.001, two-tailed unpaired t-test. k Percentage of delaminating cells that show stable (persistent) lamellipodia or unstable (short-lived) lamellipodia. l, m Still images of time-lapse showing control mouse neural crest cells (l, supplementary movies 3,5) and pCAAG::creERtm ;GSK3αfl/fl ; GSK3βfl/fl; Rosamtmg/+ deleted cells (m, supplementary movie 4, 5). Upon tamoxifen-induced knockout of GSK3, the neural crest cells are unable to migrate and the cell edge does not form lamellipodia
Fig. 6
Fig. 6
Inhibition of ALK leads to decreased levels of pY-GSK3 in mouse neural crest. af ALK is expressed in the neural crest. (a, d) mRNA in situ hybridization for Alk in e8.5 and e9.5 mouse embryos. b, c, e, f Antibody staining for activated ALK protein shows expression at the neural plate border (red arrows) and in the branchial arches. g Staining for total ALK (green). g Very little total ALK is present in the neural plate with some present at the edge of the premigratory neural crest (white arrowheads). h Migratory neural crest cells express higher levels of ALK. i In fully migratory NC cells, ALK appears to be nuclear. Underneath each panel, ALK merged with Hoechst. j Co-immunostaining of pY-GSK3 (green) and ALK (red) show that ALK is expressed in all cells that express pY-GSK3. k Treatment with the ALK inhibitor crizotinib (CTB) for 24 h reduces the levels of pY-GSK3. l, m, n, o Quantitation of loss of pY-GSK3 and ALK fluorescence using the alternative inhibitor NVP-TAE also results in a loss of mean fluorescence intensity. ps Bright-field images of neural crest explants treated with vehicle control or three different ALK inhibitors: 1.5 µM CTB, 1.5 µM AZD-3463, or 1 µM NVP-TAE-684. All three treatments showed a loss of migratory neural crest (red dotted lines) (n = 3 explants with ≥10 cells per explant, scale bar = 500 µm). t Area quantification of the premigratory neural crest (pNC, area depicted by blue dotted lines covered in ps) and the migratory neural crest population (mNC, red dotted lines). A significant reduction in mNC was seen in AZD and NVP treated explants. uy Phalloidin staining shows F-actin structure in explants. Hoechst marks nuclei. Note the loss of lamellipodial structures upon ALK inhibition (w, x) is comparable to BIO treatment (v) (scale bar = 25 µm). y Percentage of cells with lamellipodial formations at the leading edge upon treatment with GSK3 inhibitor BIO or with ALK inhibitors (n = 10–20 cells per explant). Bars, mean ± SD. One-way ANOVA and unpaired t-test *P < 0.05, **P < 0.01
Fig. 7
Fig. 7
Neuroblastoma lines with high levels of active ALK also have high levels of pY-GSK3. a Western blotting of neuroblastoma lines reveals levels of pY-GSK3 correlates with levels of ALK-pY1507 (IMR5, Kelly, Be(2)C, IMR32, SH-SY-5Y, SK-N-SH). Cell lines with low or no ALK-pY1507 (SK-N-AS, LS, CHP-212) have correspondingly low levels of pY-GSK3. b Western blotting showing that only Kelly cells have high levels of ALK when compared to mouse embryonic fibroblasts (MEFs) and LS neuroblastoma cells. c Western blotting analysis reveals that, in Kelly cell line, ALK inhibition with NVP-TAE, results in gradual loss pYGSK-3α and pYGSK-3β, are significantly reduced after 24 h treatment with NVP-TAE, GSK3 inhibition, using BIO or CHIR, leads to a reduced expression of pY-GSK3, more predominantly is pY-GSK3α isoform. Some loss of ALK is also seen in NVP treatments. Treatments used were 1.5 µM crizotinib, 1.5 µM AZD-3463, 1 µM NVP-TAE-684 (NVP1), 2 µM NVP-TAE-684 (NVP2), 0.5 μM BIO and 1.0 μM CHIR99021
Fig. 8
Fig. 8
GSK3 and ALK inhibition affect migration in neuroblastoma cell lines. a, c Cell migration assay for Kelly neuroblastoma cell line. a Representative bright-field still images at start (t = 0 h) and end (t = 24 h) time points of the migration assay in Kelly cells under various GSK3 (0.5 μM BIO, 1.0 μM CHIR99021) and ALK inhibition treatments (1.5 μM CTB, 1.5 μM AZD-3463 and 1.0 μM NVP-TAE684). c Line graph representing the percentage of wound coverage over time. Notice that upon NVP-TAE684 (NVP) and BIO treatments cells do not close the wound as quickly as the control or unaffected CTB samples. AZD treatment showed the lowest percentage of wound coverage. b, d Cell migration assay for LS neuroblastoma cell line. b Representative bright-field still images at start (t = 0 h) and end time (t = 24 h) points of the migration assay in LS cells under GSK3 inhibition (0.5 μM BIO) and ALK inhibition treatment (1.5 μM AZD-3463). Note that upon BIO treatment LS cells tend to aggregate and expand into the wound (black arrows). d Line graph representing the percentage of wound coverage in LS cells. There is a tendency to increase migration upon GSK3 inhibition (BIO and CHIR). The lower wound coverage upon ALK inhibition treatment correlates with reduced population of cells at the end of the assay suggesting a compromise in cell viability under these conditions. e Representative images of actin staining (phalloidin, green) showing Kelly cells treated with BIO compared to controls. Notice the irregular spiky protrusions of cells where GSK3 is inhibited (yellow arrowheads). Scale bar, 25 μm

References

    1. Carmona-Fontaine C, et al. Contact inhibition of locomotion in vivo controls neural crest directional migration. Nature. 2008;456:957–961. doi: 10.1038/nature07441. - DOI - PMC - PubMed
    1. Buitrago-Delgado E, Nordin K, Rao A, Geary L, LaBonne C. NEURODEVELOPMENT. Shared regulatory programs suggest retention of blastula-stage potential neural crest cells. Science. 2015;348:1332–1335. doi: 10.1126/science.aaa3655. - DOI - PMC - PubMed
    1. Simoes-Costa M, Bronner ME. Reprogramming of avian neural crest axial identity and cell fate. Science. 2016;352:1570–1573. doi: 10.1126/science.aaf2729. - DOI - PMC - PubMed
    1. Jiang M, Stanke J, Lahti JM. The connections between neural crest development and neuroblastoma. Curr. Top. Dev. Biol. 2011;94:77–127. doi: 10.1016/B978-0-12-380916-2.00004-8. - DOI - PMC - PubMed
    1. Olsen RR, et al. MYCN induces neuroblastoma in primary neural crest cells. Oncogene. 2017;36:5075–5082. doi: 10.1038/onc.2017.128. - DOI - PMC - PubMed

Publication types

MeSH terms

LinkOut - more resources