

The role of gel-phase domains in electroporation of vesicles
- PMID: 29555940
- PMCID: PMC5859178
- DOI: 10.1038/s41598-018-23097-9
The role of gel-phase domains in electroporation of vesicles
Abstract
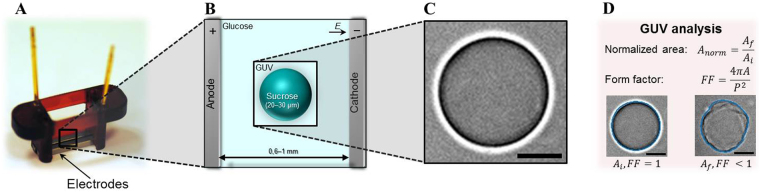
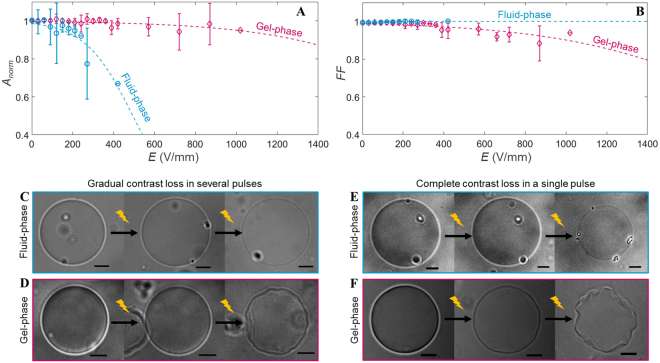
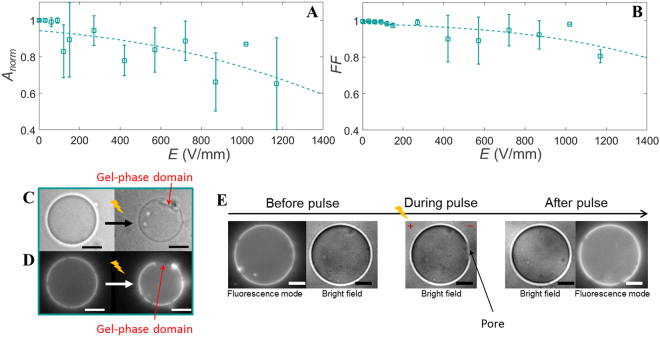
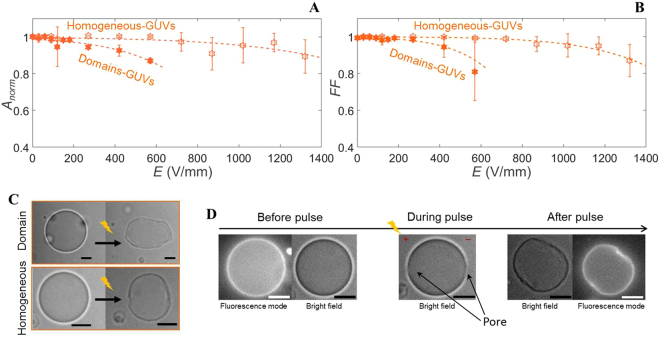
Transient permeabilisation of the cell membrane is a critical step to introduce drugs or DNA into living cells, yet challenging for both biological research and therapeutic applications. To achieve this, electroporation (or electropermeabilisation) has become a widely used method due to its simplicity to deliver almost any biomolecule to any cell type. Although this method demonstrates promise in the field of drug/gene delivery, the underlying physical mechanisms of the response of the heterogeneous cell membrane to strong electric pulses is still unknown. In this study, we have investigated the role of gel-phase lipids in the electroporation of binary giant unilamellar vesicles (GUVs), composed from DPPC (gel-phase) and DPhPC (fluid-phase) lipids (molar ratio 8:2 and 2:8). We have observed that the exposure to electric pulses leads to expel of fluid-phase lipids and concomitant decrease in GUV size, whereas the gel-phase domains become buckled. Based on experiments on pure fluid-phase and gel-phase GUVs, we have found that fluid-phase lipids can be expelled by electrical forces and the highly viscous gel-phase lipids cannot. Moreover, our analyses suggest that pore formation occurs primarily in fluid-phase domains and that the pore size is similar in all GUVs containing fluid-phase lipids, irrespective of the gel-phase percentage.
Conflict of interest statement
The authors declare no competing interests.
Figures
Similar articles
-
Effects of electrically-induced constant tension on giant unilamellar vesicles using irreversible electroporation.Eur Biophys J. 2019 Dec;48(8):731-741. doi: 10.1007/s00249-019-01398-9. Epub 2019 Sep 24. Eur Biophys J. 2019. PMID: 31552440
-
Two photon fluorescence microscopy of coexisting lipid domains in giant unilamellar vesicles of binary phospholipid mixtures.Biophys J. 2000 Jan;78(1):290-305. doi: 10.1016/S0006-3495(00)76592-1. Biophys J. 2000. PMID: 10620293 Free PMC article.
-
Effects of membrane potentials on the electroporation of giant unilamellar vesicles.PLoS One. 2023 Sep 12;18(9):e0291496. doi: 10.1371/journal.pone.0291496. eCollection 2023. PLoS One. 2023. PMID: 37699026 Free PMC article.
-
Giant unilamellar vesicles - a perfect tool to visualize phase separation and lipid rafts in model systems.Acta Biochim Pol. 2009;56(1):33-9. Epub 2009 Mar 17. Acta Biochim Pol. 2009. PMID: 19287805 Review.
-
Lipid vesicles in pulsed electric fields: Fundamental principles of the membrane response and its biomedical applications.Adv Colloid Interface Sci. 2017 Nov;249:248-271. doi: 10.1016/j.cis.2017.04.016. Epub 2017 Apr 28. Adv Colloid Interface Sci. 2017. PMID: 28499600 Review.
Cited by
-
Assessing membrane material properties from the response of giant unilamellar vesicles to electric fields.Adv Phys X. 2023;8(1):2125342. doi: 10.1080/23746149.2022.2125342. Epub 2022 Oct 6. Adv Phys X. 2023. PMID: 36211231 Free PMC article.
-
Identification of electroporation sites in the complex lipid organization of the plasma membrane.Elife. 2022 Feb 23;11:e74773. doi: 10.7554/eLife.74773. Elife. 2022. PMID: 35195069 Free PMC article.
-
Effects of electrically-induced constant tension on giant unilamellar vesicles using irreversible electroporation.Eur Biophys J. 2019 Dec;48(8):731-741. doi: 10.1007/s00249-019-01398-9. Epub 2019 Sep 24. Eur Biophys J. 2019. PMID: 31552440
-
Recent developments in the kinetics of ruptures of giant vesicles under constant tension.RSC Adv. 2021 Sep 2;11(47):29598-29619. doi: 10.1039/d1ra04647k. eCollection 2021 Sep 1. RSC Adv. 2021. PMID: 35479542 Free PMC article. Review.
-
Response of an actin network in vesicles under electric pulses.Sci Rep. 2019 May 31;9(1):8151. doi: 10.1038/s41598-019-44613-5. Sci Rep. 2019. PMID: 31148577 Free PMC article.
References
-
- Pakhomov, A. G., Miklavcic, D. &Markov, M. S. Advanced electroporation techniques in biology and medicine (CRC Press 2010).
Publication types
LinkOut - more resources
Full Text Sources
Other Literature Sources
