. 2018 Mar 19;8(1):4823.
doi: 10.1038/s41598-018-23248-y.

Ricci-flow based conformal mapping of the proximal femur to identify exercise loading effects

Affiliations

Ricci-flow based conformal mapping of the proximal femur to identify exercise loading effects

Nathaniel Narra et al. Sci Rep. .

Abstract

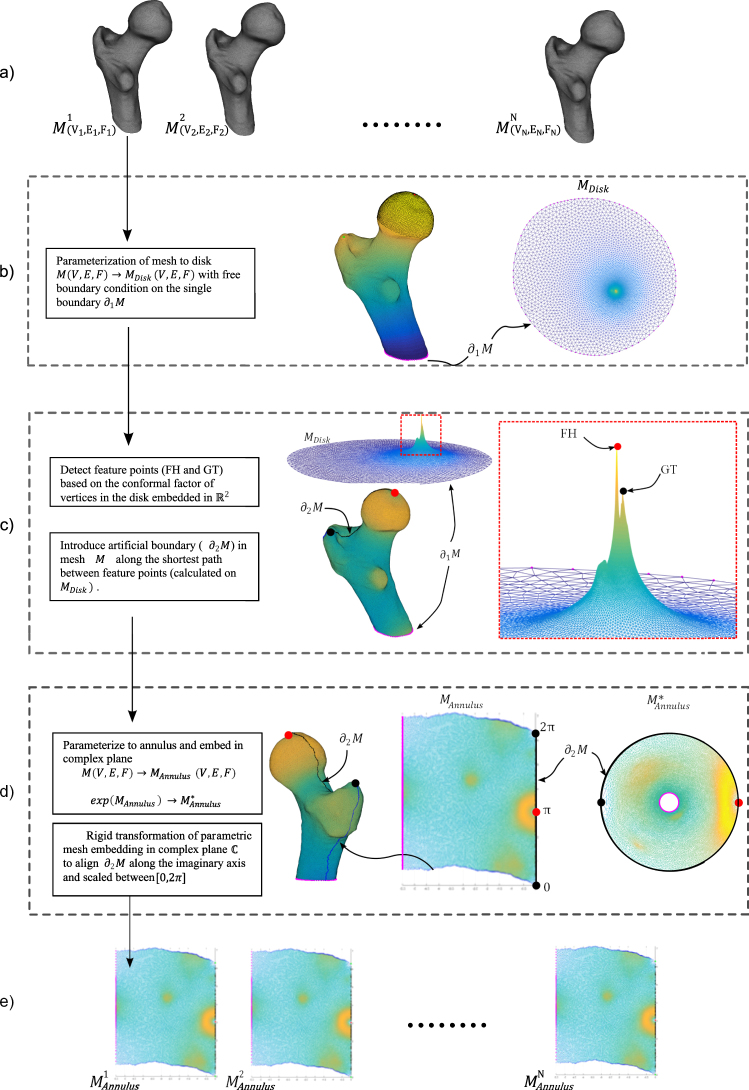
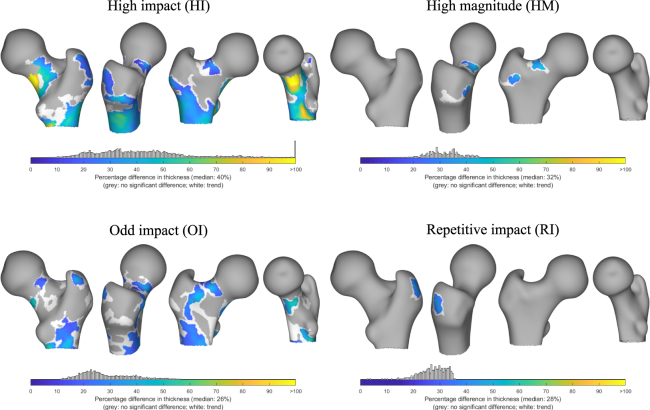
The causal relationship between habitual loading and adaptive response in bone morphology is commonly explored by analysing the spatial distribution of mechanically relevant features. In this study, 3D distribution of features in the proximal femur of 91 female athletes (5 exercise loading groups representing habitual loading) is contrasted with 20 controls. A femur specific Ricci-flow based conformal mapping procedure was developed for establishing correspondence among the periosteal surfaces. The procedure leverages the invariance of the conformal mapping method to isometric shape differences to align surfaces in the 2D parametric domain, to produce dense correspondences across an isotopological set of surfaces. This is implemented through a multi-parametrisation approach to detect surface features and to overcome the issue of inconsistency in the anatomical extent present in the data. Subsequently, the group-wise distribution of two mechanically relevant features was studied - cortical thickness and surface principal strains (simulation results of a sideways fall). Statistical inferences over the surfaces were made by contrasting the athlete groups with the controls through statistical parametric mapping. With the aid of group-wise and composite-group maps, proximal femur regions affected by specific loading groups were identified with a high degree of spatial localisation.


Conflict of interest statement

The authors declare no competing interests.

Figures

Figure 1
Figure 1
An illustrated description of the parametrising procedure developed for (a) proximal femur triangular surface meshes MN(V, E, F); where V = set of nodes; E = set of edges; F = set of faces (N = 111, in this study). (b) In the first parametrisation step, the surface is conformally mapped to its topological equivalent: disk. The single boundary (∂1M) at the distal end of the proximal femur (shaft) is mapped to the edge of the disk under a free boundary condition, where the metric on the boundary nodes is left unchanged (colour map: conformal factor). (c) The parametrised disk along with the conformal factor at the nodes as a height map. The femoral head (FH) and greater trochanter (GT) features are detected as the peaks (inset). The straight line between these features is used to introduce a second boundary (∂2M) by slitting the mesh along the line. (d) In the first parametrisation step, the surface is conformally mapped to its topological equivalent: annulus. The map is embedded in the complex plane by introducing a cut graph between the GT node and ∂1M. The embedded meshes are then transformed such that the ∂2M boundary lies on the imaginary axis scaled within [0, 2π]. An exponential map consequently results in the annulus. (e) Parametrised meshes in the a common coordinate frame. The boundary edges and feature points are colour coded consistently across all images.
Figure 2
Figure 2
Assessment of the ability of the procedure to establish correspondence through expert annotations. 5 features were annotated by 3 experts on the surfaces of 30 subjects. The subjects were chosen randomly from the dataset of 111. The sites annotated were: superiormost point of femoral head (sFH), fovea capitis centre (FC), tip of greater trochanter (GT), trochanteric fossa centre (TF) and tip of lesser trochanter process(LT). (a) Clustering of features in the parametric plane: each surface was parametrised and the position of the annotated node plotted in the parametric plane. The sites are plotted in colour (sFH - red; FC - balck; GT - green; TF - cyan; LT - blue) and each annotator is indicated by a different marker (‘x’, ‘o’ and ‘.’). It should be noted that the boundary introduced along the geodesic between the two algorithmically detected features lies along imaginary axis (femoral head feature at π & greater trochanter feature at [0, 2π]). Thus, the GT and sFH annotations are reflected about this symmetry. (b) Box-plots of the distance between annotations and the associated feature, detected algorithmically, for each annotator (3 experts: each in blue, red and black). (c) A visual illustration of the distributions of the annotations (of one expert) and the detected features for 30 samples. Expert annotations are coloured in darker shades and detected features are coloured in lighter shades. The rendered surface of the femur is only for representation to convey a sense of location over the surface.
Figure 3
Figure 3
The correspondence procedure illustrated on 3 sample femur shapes from the dataset. (a) The three shapes chosen, were selected as they show clearly the differences in femoral neck lengths, shaft lengths and relative positions between the main feature processes - femoral head (FH), greater trochanter (GT) & lesser trochanter (LT). (b) The parametric meshes embedded in complex domain illustrate the positions of the FH (black circle) and LT (red circle). The consistent boundary of the mesh is aligned along the imaginary axis. (c) The canonical template mesh is matched to each of the parametrisations. The relative positions of the main features (LT and FH regions) in the common coordinate frame are illustrated in colour (red, blue and green for each of the 3 samples femurs). This misalignment is corrected locally on the template mesh through radial basis functions. (d) the resulting elastic registration of template mesh to each femoral instance produces an isotopological set of surfaces. The distribution of the cortical thickness values at the nodes are displayed as colour maps for illustrative purposes.
Figure 4
Figure 4
Regions of significant difference in cortical thickness (adjusted for weight, femur size and shape) illustrated on the surface of an average femur as colour patches. Colour maps in these patches represent mean percentage difference in cortical thickness between each exercise loading group and the control group (% higher than control). Their distribution within the patches is plotted as node counts above the colour bar. A relaxed multiple-comparison correction threshold (p < 0.025) for defining supra-threshold clusters (in white) was used purely to illustrate the trend in the distribution of these clusters; no formal inferences were made or discussed. The RNI group did not show any significant difference from controls, due to which it was omitted from this illustration.
Figure 5
Figure 5
Regions of significant difference in maximum and minimum principal strains at the surface nodes (adjusted for individual impact force and shape) illustrated on the surface of an average femur as colour patches. Colour maps in these patches represent mean percentage difference in the principal strains between each exercise loading group and the control group (% lower than control). Their distribution within the patches is plotted as node counts above the colour bar. A relaxed multi-comparison correction threshold (p < 0.025) for defining supra-threshold clusters (in white) was used purely to illustrate the trend in the distribution of these clusters; no formal inferences were made or discussed. The RNI group did not show any significant difference from controls, due to which it was omitted from this illustration.
Figure 6
Figure 6
The significant clusters from the loading groups are combined into a single map. The regions are colour coded according to the specific or combination of loading groups responsible (n/s: no significance). The combination regions are where multiple loading groups (as indicated) show significant differences from controls. Compiled from the results for (a) cortical thickness (b) maximum principal strain (c) minimum principal strain.

Similar articles

Cited by

References

    1. Nikander R, et al. Targeted exercises against hip fragility. Osteoporosis International. 2009;20:1321–1328. doi: 10.1007/s00198-008-0785-x. - DOI - PubMed
    1. Narra N, Nikander R, Viik J, Hyttinen J, Sievänen H. Femoral neck cross-sectional geometry and exercise loading. Clinical Physiology and Functional Imaging. 2013;33:258–266. doi: 10.1111/cpf.12022. - DOI - PubMed
    1. Kannus P, et al. Effect of starting age of physical activity on bone mass in the dominant arm of tennis and squash players. Annals of Internal Medicine. 1995;123:27–31. doi: 10.7326/0003-4819-123-1-199507010-00003. - DOI - PubMed
    1. Boskey AL, Coleman R. Aging and bone. Journal of Dental Research. 2010;89:1333–1348. doi: 10.1177/0022034510377791. - DOI - PMC - PubMed
    1. Ruff C, Holt B, Trinkaus E. Who’s afraid of the big bad wolff?: “wolff’s law” and bone functional adaptation. American Journal of Physical Anthropology. 2006;129:484–498. doi: 10.1002/ajpa.20371. - DOI - PubMed

Publication types