. 2018 May;21(5):696-706.
doi: 10.1038/s41593-018-0121-5. Epub 2018 Mar 19.

Myelin remodeling through experience-dependent oligodendrogenesis in the adult somatosensory cortex

Affiliations

Myelin remodeling through experience-dependent oligodendrogenesis in the adult somatosensory cortex

Ethan G Hughes et al. Nat Neurosci. 2018 May.

Abstract

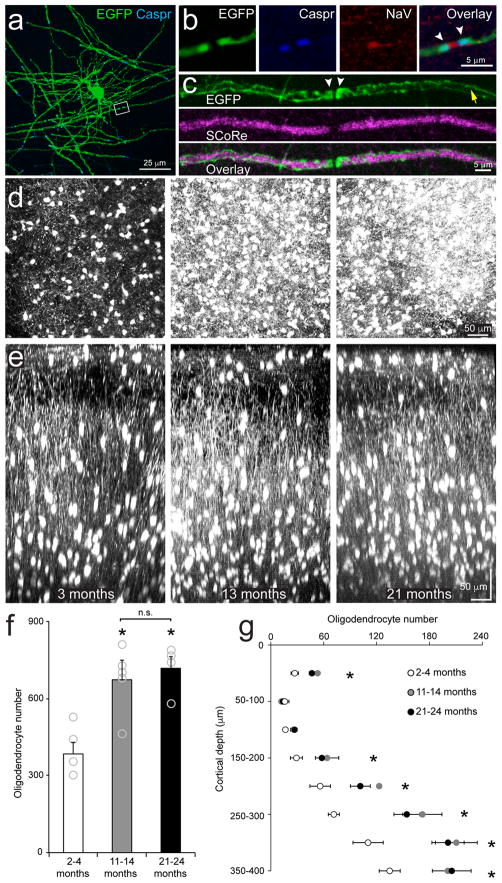
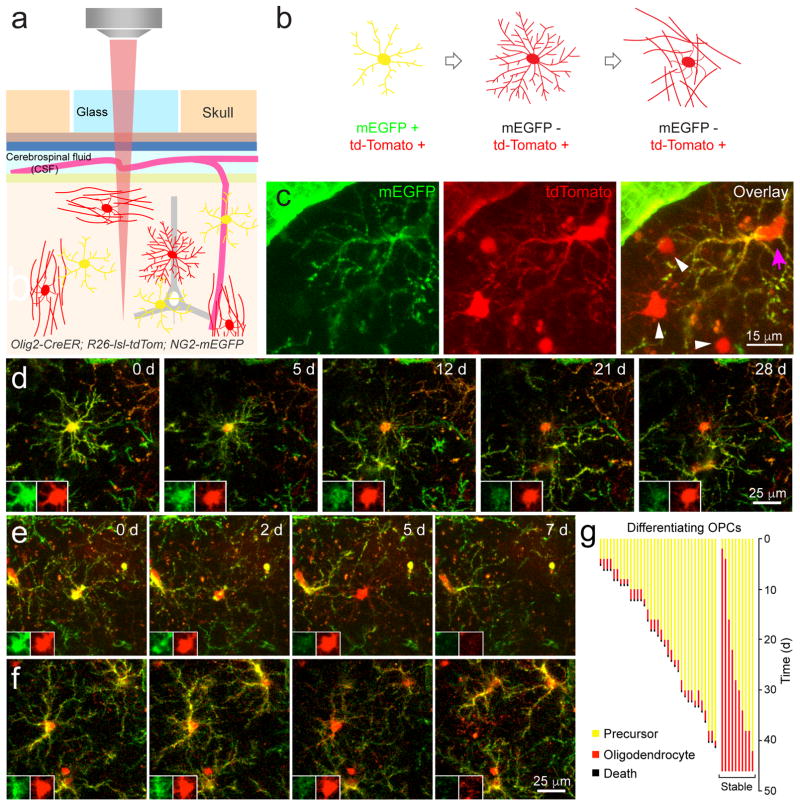
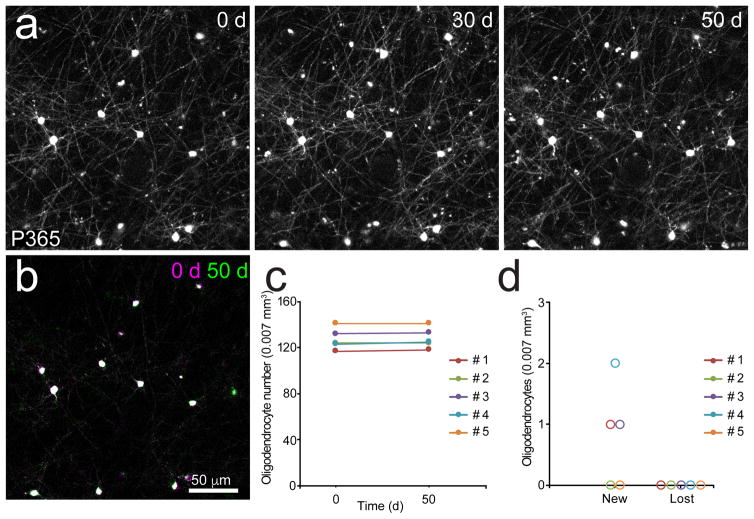
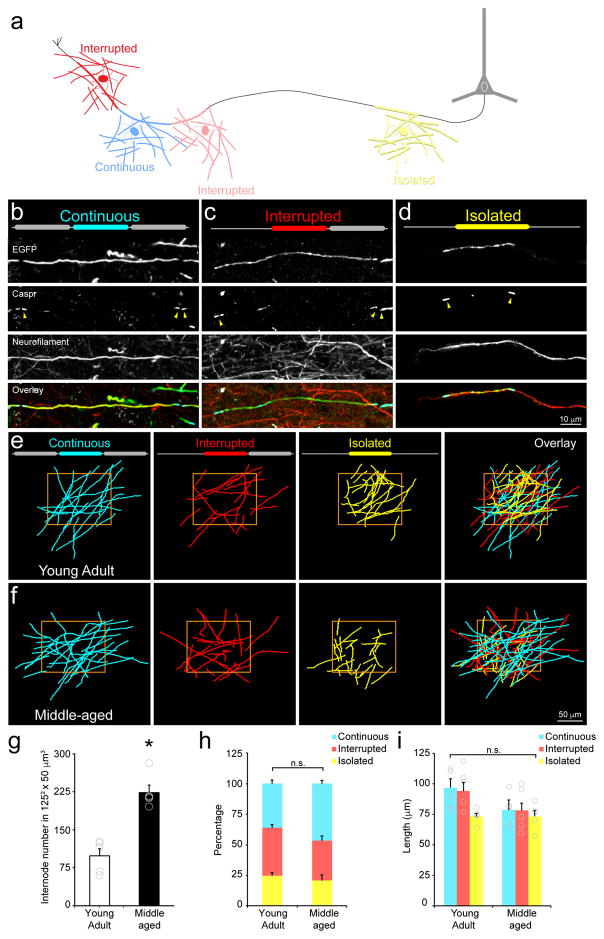
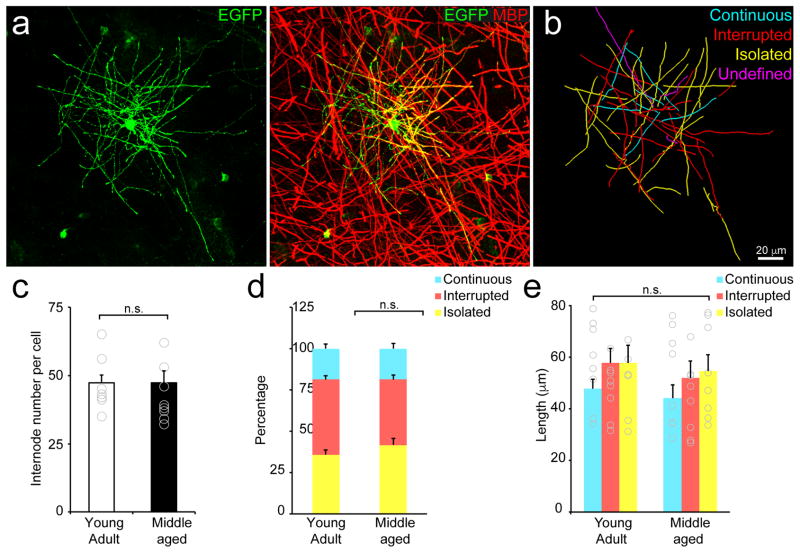
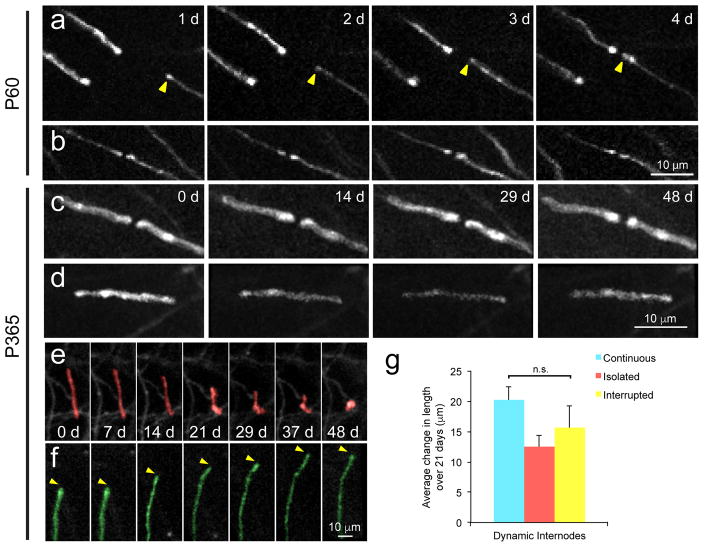
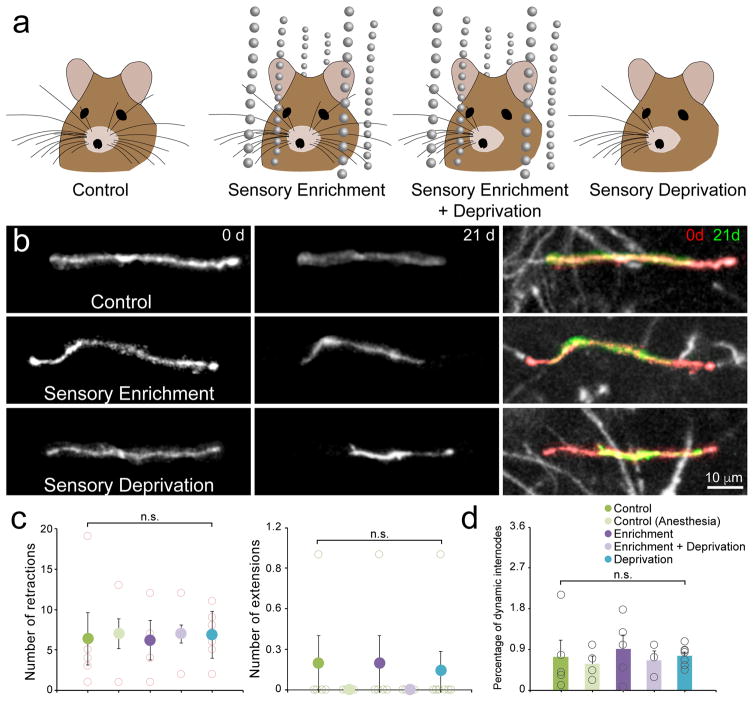
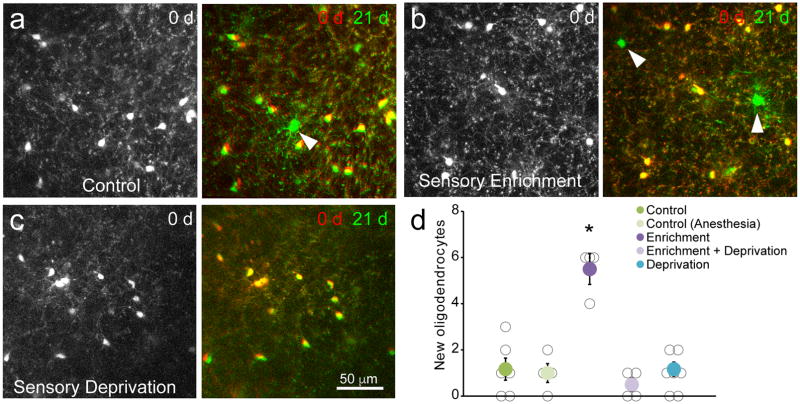
Oligodendrocyte generation in the adult CNS provides a means to adapt the properties of circuits to changes in life experience. However, little is known about the dynamics of oligodendrocytes and the extent of myelin remodeling in the mature brain. Using longitudinal in vivo two-photon imaging of oligodendrocytes and their progenitors in the mouse cerebral cortex, we show that myelination is an inefficient and extended process, with half of the final complement of oligodendrocytes generated after 4 months of age. Oligodendrocytes that successfully integrated formed new sheaths on unmyelinated and sparsely myelinated axons, and they were extremely stable, gradually changing the pattern of myelination. Sensory enrichment robustly increased oligodendrocyte integration, but did not change the length of existing sheaths. This experience-dependent enhancement of myelination in the mature cortex may accelerate information transfer in these circuits and strengthen the ability of axons to sustain activity by providing additional metabolic support.


Conflict of interest statement

Competing interests: The authors declare no competing financial interests.

Figures

Figure 1
Figure 1. Oligodendrocyte density in upper cortical layers increases during adulthood
a, Maximum projection of an example individual Mobp-EGFP oligodendrocyte from a horizontal section (0–50 μm from the pial surface, n = 5 mice) immunolabeled with EGFP and Caspr. b, High magnification area from a. Putative EGFP+ paranodes (white arrowheads) are immunolabeled with paranodal protein, Caspr, and are adjacent clustered voltage-gated sodium channels (NaV) indicating this is a node of Ranvier. c, Maximum projection of a putative EGFP+ myelin sheath in a horizontal section (0–50 μm from the pial surface) immunolabeled with EGFP and imaged with SCoRe. Note the accumulation of EGFP within paranodes (white arrowheads) which lack SCoRe signal. EGFP is also present in cytoplasmic channels (yellow arrow) along the sheath which has strong SCoRe signal indicative of compact myelin. d, Maximal Z projection of 400 μm of somatosensory cortex (P90, left; P395, middle; P630, left; Mobp-EGFP mouse, (n = 5 mice); chronic cranial window preparation; depth = 0 – 400 μm). e, Maximal Y projection of 200 μm of somatosensory cortex (P90, left; P395, middle; P630, left; Mobp-EGFP mice; chronic cranial window preparation). Note high density of oligodendrocytes in Layer I. f, Quantification of oligodendrocyte density in layers I–IV (0–400 μm) of somatosensory cortex (2–4 months, n = 5 mice; 11–14 months, n = 6 mice; 21–24 months, n = 4 mice; one-way ANOVA with Tukey post hoc test, 2–4 months vs. 11–14 months, p = 0.0001, q(13) = 9.14; 2–4 months vs. 21–24 months, p = 0.0002, q(13) = 8.49; 11–14 months vs. 21–24 months, p = 0.99, q(13) = 0.12; n.s. = not significant, * = p < 0.0005). g, Quantification of total oligodendrocyte number in layers I–IV of somatosensory cortex (2–4 months, n = 5 mice; 11–14 months, n = 6 mice; 21–24 months, n = 4 mice; p<0.05, one-way ANOVA with Tukey post hoc test, for details see Supplementary Methods Checklist, * = p < 0.05). f,g, Data are presented as mean ± SEM.
Figure 2
Figure 2. Inefficient integration of newly generated oligodendrocytes in the mature cortex
a, In vivo two photon microscopy through chronic cranial windows in Olig2-CreER; R26-lsl-tdTomato; NG2-mEGFP triple transgenic mice. b, Membrane-anchored EGFP is expressed by OPCs, and all stages of the oligodendrocyte lineage (progenitors, pre-myelinating cells, and mature oligodendrocytes) express tdTomato following administration of tamoxifen. When OPCs differentiate the NG2 promoter is down-regulated and EGFP is no longer expressed, while tdTomato is preserved. c, Maximal projection of mEGFP and tdTomato expression in a triple transgenic mouse (P150; depth= 10–19 μm; 100 mg/kg tamoxifen injected for five days at P30; n = 5 mice). OPCs (magenta arrow) express both fluorophores but mature oligodendrocytes only express tdTomato (white arrowheads). Note pericyte expression of mEGFP. d, Maximal intensity projection images of a differentiating OPC that becomes a stably integrated oligodendrocyte (P240; depth = 111–120 μm). Images were acquired every 2–3 days for 28 days and relative date of collection is shown in days (d) on each panel. Inset panels show the cell soma at higher magnification for each fluorescent channel. e,f, Maximal intensity projection images of differentiating OPCs located 234–252 μm (e) and 27–61 μm (f) below the pial surface (P240). Images were acquired every 2–3 days for one week. Note the fragmentation of the cell in the 7d time point in f. g, Quantification of maturation of differentiating OPCs over 1.5 months in P240–426 mice. (n = 3 mice, two imaging volumes/animal; mature oligodendrocytes = 10/45).
Figure 3
Figure 3. Oligodendrocytes are highly stable in the adult cortex
a, Maximal intensity projection images of oligodendrocytes in the somatosensory cortex of a Mobp-EGFP mouse (P365; depth= 45–50 μm). Images were acquired weekly for 50 days. b, Montage of 0 (magenta) and 50 (green) day time points. Oligodendrocyte cell body position remains unchanged. c, Quantification of oligodendrocyte number over 50 days in >P365 mice. (n = 5 mice; cells = 641). d, Quantification of new or lost oligodendrocytes over 50 days in >P365 mice (n = 5 mice).
Figure 4
Figure 4. Discontinuous myelination persists in the adult brain
a, Schematic of myelin sheath categorization by the presence or absence of a neighboring sheaths. b, Maximum projection of a Continuous myelin sheath. Note doublets of Caspr immunolabeling at both ends of the sheath (yellow arrowheads). c, Maximum projection of a Interrupted myelin sheath. Note a doublet of Caspr immunolabeling at one end of the sheath (yellow arrowheads) and the axon extends beyond the Caspr singlet. d, Maximum projection of an Isolated myelin sheath. Note only singlets of Caspr immunolabeling at the ends of the sheath (yellow arrowheads) and that the axon extends beyond ends of the sheath. e, Projection of traces of EGFP+ myelin internodes within a 1252 × 50 μm3 area in the somatosensory cortex of a Mobp-EGFP mouse (P90; depth = 0–50 μm; n = 5 mice). The position of neighboring internodes on the same axon was used to characterize internodes as Continuous, Interrupted, or Isolated (configuration illustrated by diagram at top of each panel). f, Projection of traces of EGFP+ myelin internodes within 125 μm2 area in the somatosensory cortex of a Mobp-EGFP mouse (P365; depth= 0–50 μm). g–i, Quantification of internode number within a 1252 × 50 μm3 area (g, Young Adult: n = 5 mice; Middle-aged: n = 5 mice, p>0.0005, t(8) = −6.02, two-tailed Student’s t-test; * = p < 0.0005) and proportion (h, Young Adult: n = 5 mice; Middle-aged: n = 5 mice, Continuous, p = 0.17, t(8) = −1.52, Interrupted, p = 0.08, t(8) = 1.98, Isolated, p = 0.53, t(8) = 0.65, two-tailed Student’s t-test) and length of each internode class (i, Young Adult: n = 5 mice; Middle-aged: n = 5 mice, Continuous, p = 0.13, t(8) = −1.68, Interrupted, p = 0.12, t(8) = −1.72, Isolated, p = 0.97, t(8) = −0.04, two-tailed Student’s t-test) for oligodendrocytes within layer I of somatosensory cortex n.s.= not significant. g–i, Data are presented as mean ± SEM.
Figure 5
Figure 5. Individual oligodendrocytes generate both Continuous and Isolated internodes
a, Maximum projection an oligodendrocyte (labeled with AAV9-MBP-EGFP) (Left) immunostained with an antibody against MBP (Right). (P90; depth= 50–100 μm). b, Traces of EGFP+ myelin internodes of the oligodendrocyte shown in (a). Each internode was classified as Continuous, Interrupted, Isolated, or undefined (projects out of tissue section). Quantification of internode number (c, Young Adult: n = 5 mice, 8 cells; Middle-aged: n = 5 mice, 8 cells, p = 0.62, t(14) = 0.51, two-tailed Student’s t-test) and proportion (d, Young Adult: n = 5 mice, 8 cells; Middle-aged: n = 5 mice, 8 cells, Continuous, p = 0.99, t(14) = −0.005, Interrupted, p = 0.11, t(14) = 1.70, Isolated, p = 0.27, t(14) = −1.15, two-tailed Student’s t-test) and length of each internode class (e, Young Adult: n = 5 mice, 8 cells; Middle-aged: n = 5 mice, 8 cells, Continuous, p = 0.59, t(14) = 0.55, Interrupted, p = 0.52, t(14) = 0.65, Isolated, p = 0.73, t(14) = 0.36, two-tailed Student’s t-test, n.s. = not significant) for individual oligodendrocytes within layer I of cortex. c-e, Data are presented as mean ± SEM.
Figure 6
Figure 6. Infrequent remodeling of myelin internodes in the somatosensory cortex
a, In vivo time lapse images of oligodendrocyte processes in Mobp-EGFP mice (n = 5 mice). An extending process of a newly generated oligodendrocyte (yellow arrowhead) that forms a new node of Ranvier. b, An existing node exhibits little change in structure over four days (P60; depth= 24–27 μm; thinned-skull preparation, n = 5 mice).) c,d, Maximal intensity projection image of Continuous internodes (P365; depth= 39–43 μm) (c) and an isolated internode (P365; depth= 31–35 μm) (d) that remain unchanged over 48 days. e, Maximal intensity projection images illustrating retraction of an internode (red; P365; depth= 63–67 μm). f, Maximal intensity projection image illustrating extension of an internode (green; P365; depth= 63–67 μm). No newly generated or dying oligodendrocytes were found within 250 μm of these internodes. g, Quantification of the average change in length of dynamic internodes over three weeks in P365 mice. (n= 20 mice, p = 0.62, F(3, 35) = 0.49, one-way ANOVA, n.s.= not significant; mean ± SEM).
Figure 7
Figure 7. Sensory enrichment does not influence myelin remodeling in middle-aged animals
a, Illustration of different configurations to test role of sensory enrichment on myelin dynamics. Mice are housed in cages with or without sensory enrichment (hanging beads), or with or without left-sided whiskers for 21 days. b, Maximal intensity projection images of internodes imaged in the right somatosensory barrel cortex (top, P365; depth= 150–159 μm; middle, P365; depth= 183–192 μm; bottom, P365; depth= 210–232 μm) that decrease in length over 21 days. Red areas in Overlay highlight extent of retraction. c, Quantification of internode retraction (left) and extension (right) over 21 days in P365 mice in a 425 μm2 × 100 μm area. Individual mouse values: open circles; Mean value: filled circles. (Control, n = 6 mice; Control (Anesthesia), n = 4 mice; Enrichment, n = 5; Enrichment + Deprivation, n = 3 mice; Deprivation, n = 7 mice; retractions p = 0.99, F(4,19) = 0.03, extensions p = 0.86, F(4,19) = 0.32, One-way ANOVA). d, Quantification of percentage of total internodes that were dynamic over 21 days in P365 mice in a 425 μm2 × 100 μm area. Individual mouse values: open circles; Mean value: filled circles. (Control, n = 6 mice; Control (Anesthesia), n = 4 mice; Enrichment, n = 5; Enrichment + Deprivation, n = 3 mice; Deprivation, n = 7 mice; p = 0.91, F(4,19) = 0.25, One-way ANOVA; n.s. = not significant). c–d, Data are presented as mean ± SEM.
Figure 8
Figure 8. Sensory enrichment increases oligodendrogenesis in middle-aged animals
a–c, In vivo imaging of oligodendrocytes in the somatosensory cortex of Mobp-EGFP mice (P365; depth= 300–312 μm) showing the density of oligodendrocytes in one imaging field on day 0 (Left) and an overlay of the same field on day 0 and day 21 (Right). Control mouse in standard housing (a), mouse housed with sensory enrichment (b), and mouse in standard housing without whiskers (c). New oligodendrocytes are marked with white arrowheads. d, Quantification of oligodendrocyte addition over three weeks in P365 mice in a 425 μm2 × 400 μm area. (Control, n = 6 mice; Control (Anesthesia), n=4 mice; Enrichment, n = 4; Enrichment + Deprivation, n = 4 mice; Deprivation, n = 7 mice; * = p < 0.001, One-way ANOVA with Tukey’s posthoc test; mean ± SEM).

Comment in

References

    1. Nave KA. Myelination and support of axonal integrity by glia. Nature. 2010;468:244–252. - PubMed
    1. Yakovlev P, Lecours A. The myelogenetic cycles of regional maturation of the brain. In: Minkowski A, editor. Regional development of the brain in early life. Vol. 1967 Oxford: Blackwell Scientific Publications; 1967.
    1. Baumann N, Pham-Dinh D. Biology of Oligodendrocyte and Myelin in the Mammalian Central Nervous System. Physiol Rev. 2001;81:871–927. - PubMed
    1. Fünfschilling U, et al. Glycolytic oligodendrocytes maintain myelin and long-term axonal integrity. Nature. 2012;485:517–521. - PMC - PubMed
    1. Lee Y, et al. Oligodendroglia metabolically support axons and contribute to neurodegeneration. Nature. 2012;487:443–448. - PMC - PubMed

Publication types