. 2018 Apr;21(4):552-563.
doi: 10.1038/s41593-018-0113-5. Epub 2018 Mar 19.

TDP-43 gains function due to perturbed autoregulation in a Tardbp knock-in mouse model of ALS-FTD

Affiliations

TDP-43 gains function due to perturbed autoregulation in a Tardbp knock-in mouse model of ALS-FTD

Matthew A White et al. Nat Neurosci. 2018 Apr.

Erratum in

Abstract

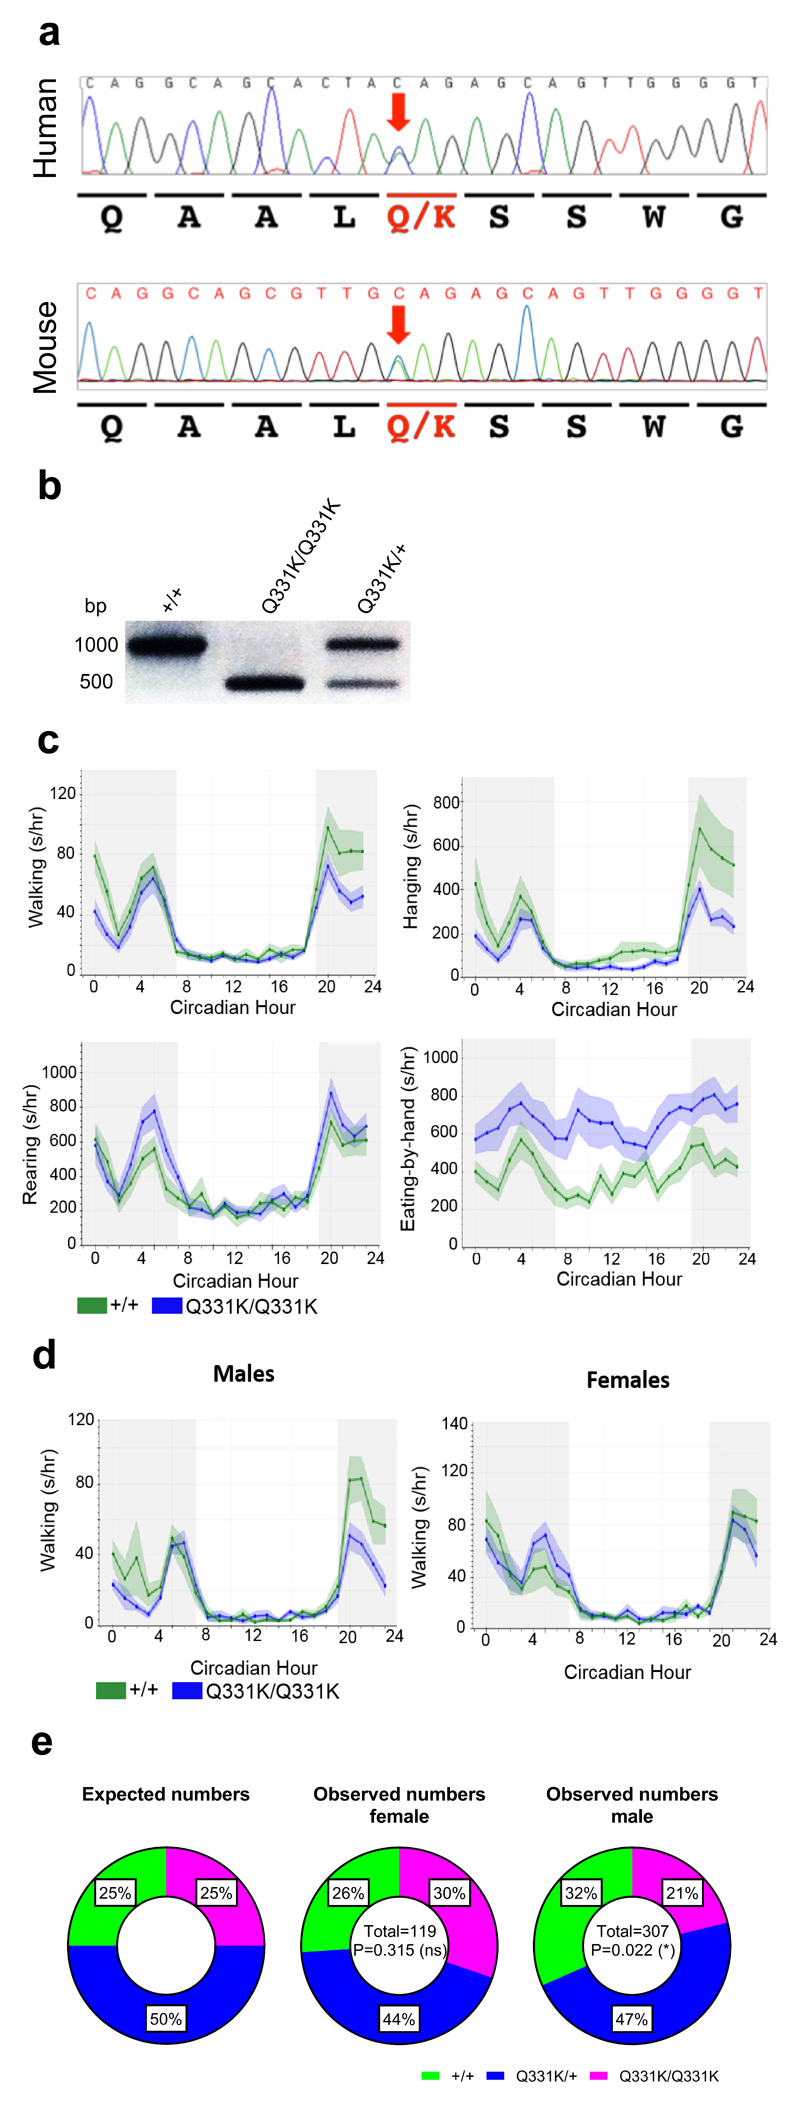
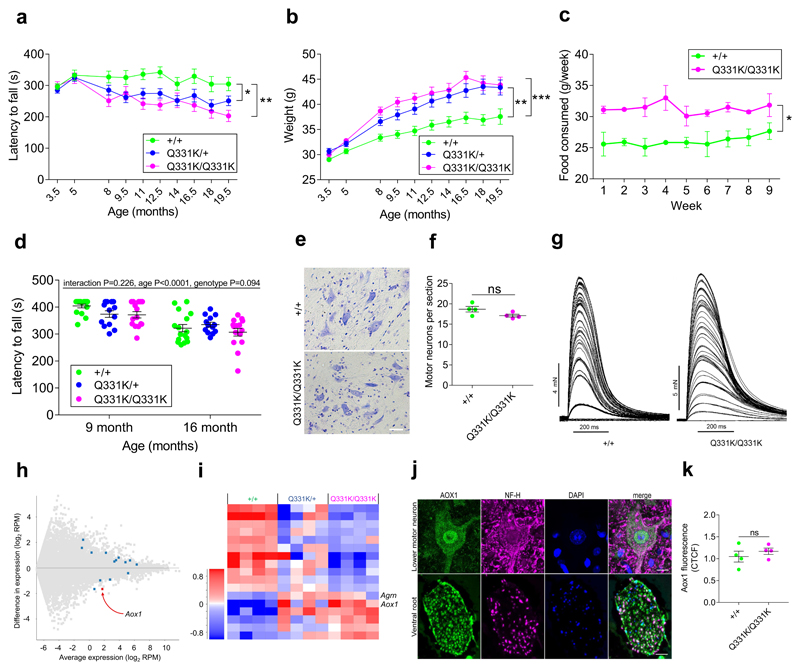
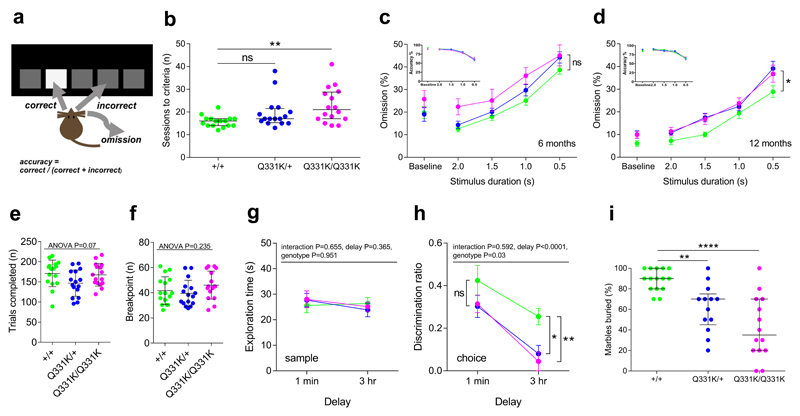
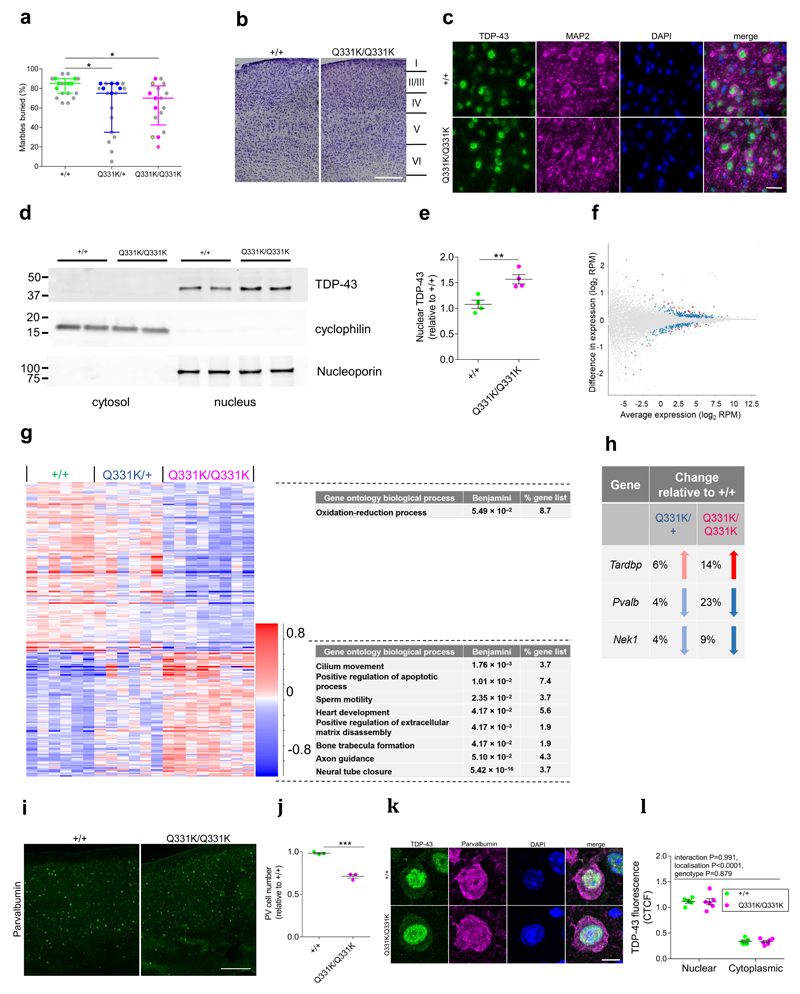
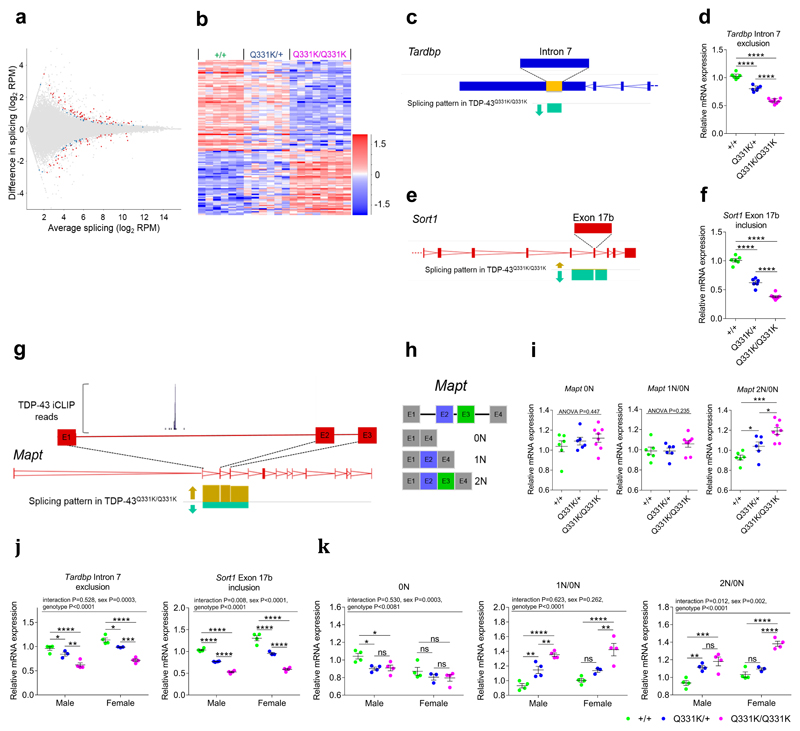
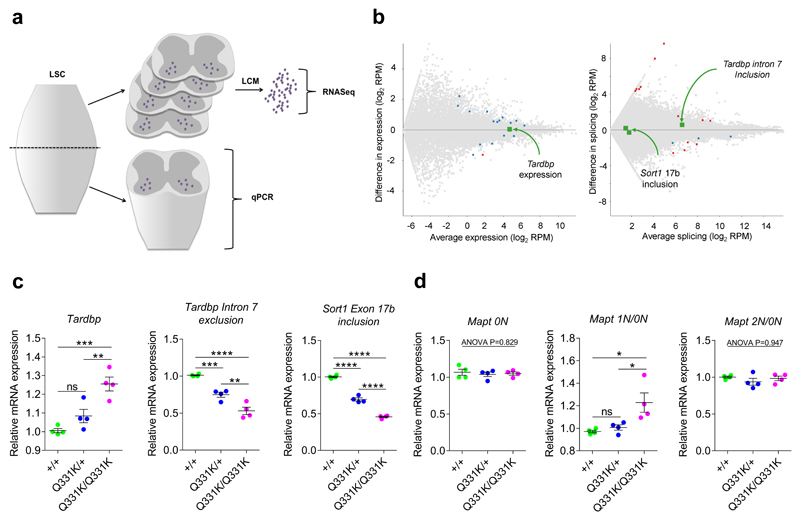
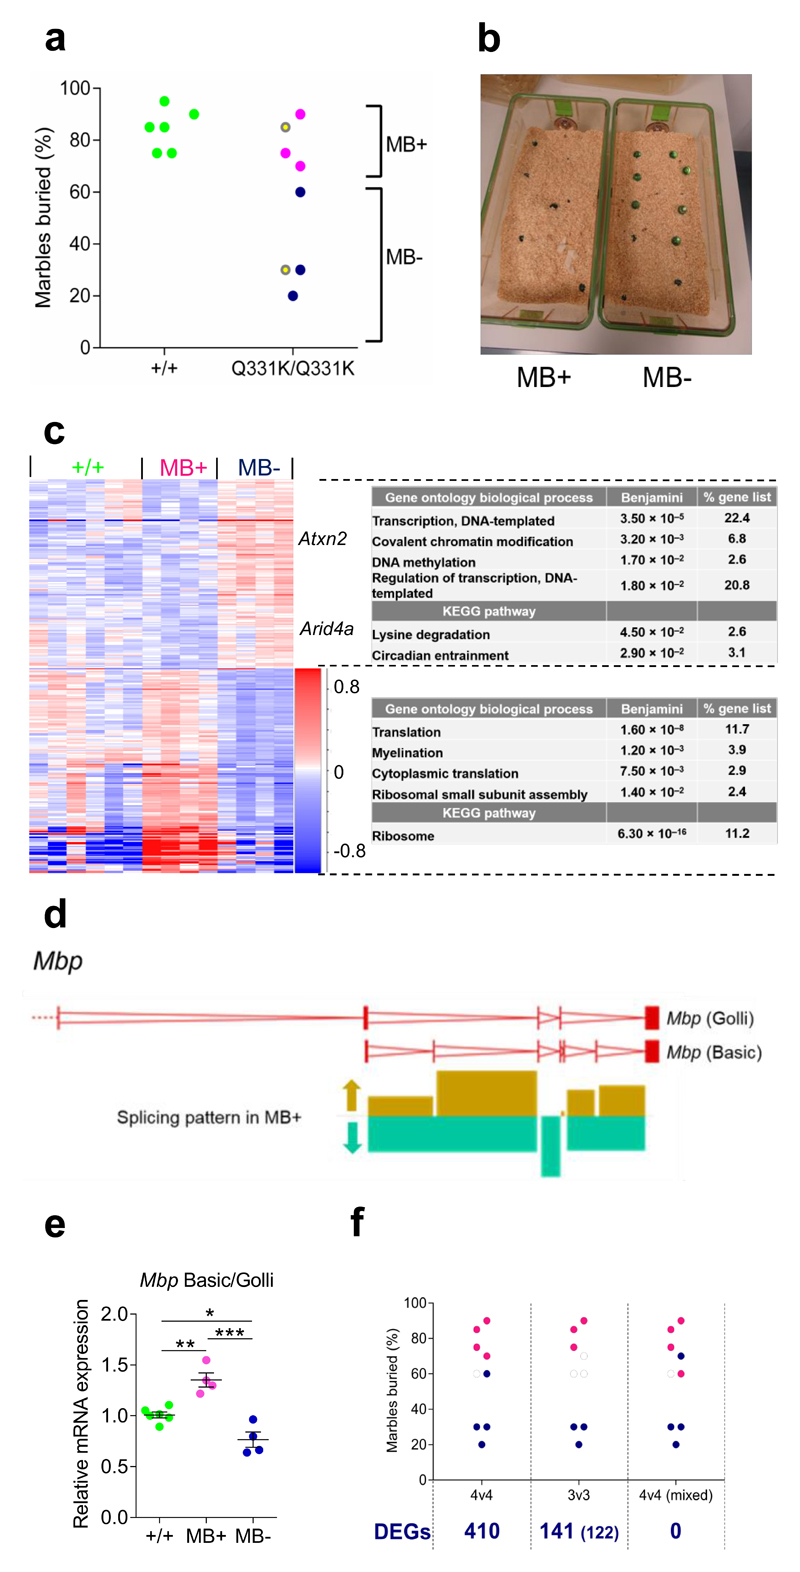
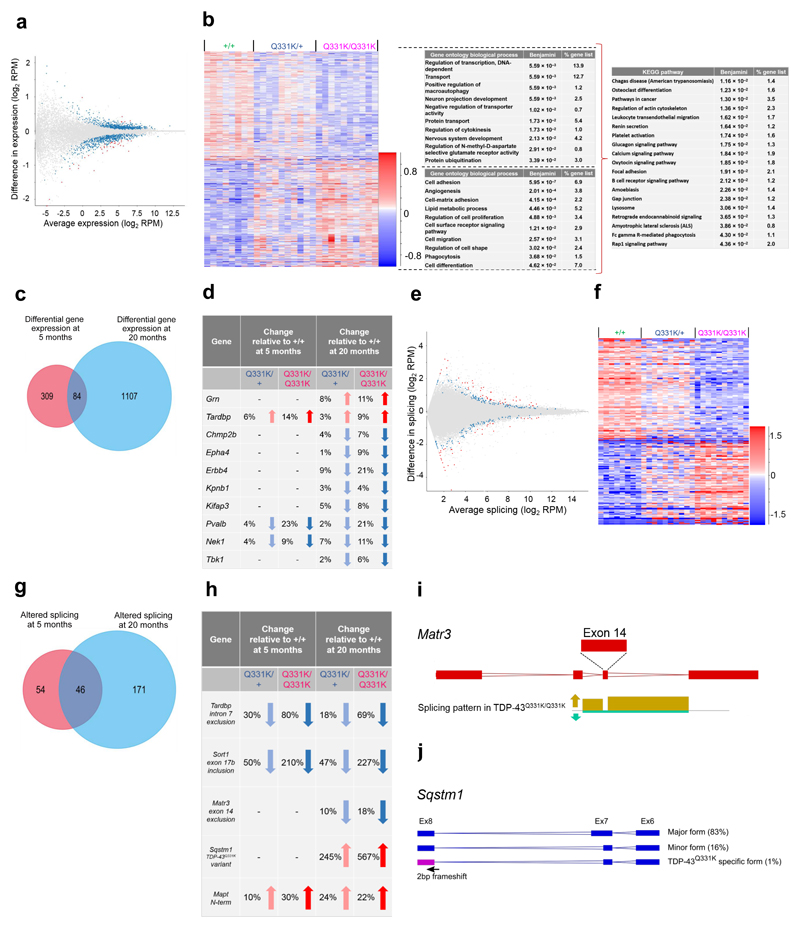
Amyotrophic lateral sclerosis-frontotemporal dementia (ALS-FTD) constitutes a devastating disease spectrum characterized by 43-kDa TAR DNA-binding protein (TDP-43) pathology. Understanding how TDP-43 contributes to neurodegeneration will help direct therapeutic efforts. Here we have created a TDP-43 knock-in mouse with a human-equivalent mutation in the endogenous mouse Tardbp gene. TDP-43Q331K mice demonstrate cognitive dysfunction and a paucity of parvalbumin interneurons. Critically, TDP-43 autoregulation is perturbed, leading to a gain of TDP-43 function and altered splicing of Mapt, another pivotal dementia-associated gene. Furthermore, a new approach to stratify transcriptomic data by phenotype in differentially affected mutant mice revealed 471 changes linked with improved behavior. These changes included downregulation of two known modifiers of neurodegeneration, Atxn2 and Arid4a, and upregulation of myelination and translation genes. With one base change in murine Tardbp, this study identifies TDP-43 misregulation as a pathogenic mechanism that may underpin ALS-FTD and exploits phenotypic heterogeneity to yield candidate suppressors of neurodegenerative disease.


Conflict of interest statement

Competing Financial Interests

The authors declare no competing financial interests

Figures

Figure 1
Figure 1. CRISPR mutagenesis, ACBM characterisation and breeding ratios of TDP-43Q331K mice
(a) Chromatograms from the patient originally identified with the Q331K mutation and CRISPR/CAS9 knock-in founder mouse #52. Bases are given above the chromatograms and amino acids coded are given below. The mutation is highlighted with the red arrow. (b) SapI restriction enzyme digestion of 1000 bp PCR products across the mutation site from representative genotyping of wild-type, TDP-43Q331K/Q331K, and TDP-43Q331K/+ mice. (c) Automated continuous behavioural monitoring (ACBM) of 4-month-old mice (n = 10 mice per genotype; 5 males and 5 females). Significantly altered behaviours are displayed: walking: interaction P<0.0001; hanging: interaction P=0.002; rearing: interaction P=0.038; eating-by-hand: genotype P=0.008; repeated measures two-way ANOVA. (d) Walking behaviour as assessed by ACBM in 7.5-month-old male and female mice (n = 5 mice per genotype). Walking male: interaction P<0.0001; walking female: interaction P=0.334; repeated measures two-way ANOVA. (e) Ratios of mice genotyped at 10 days (all of which were successfully weaned) broken down by gender. Female (χ2=2.311, d.f.=2, P=0.315), Male (χ2=7.612, d.f.=2, P=0.022); Chi square test. Error bars represent mean ± s.e.m.
Figure 2
Figure 2. Motor impairment, hyperphagia and spinal motor neuronal transcriptomic changes in mutant mice
(a) Rotarod and (b) weights of Cohort 1 mice (n = 14 wild-type, 13 TDP-43Q331K/+ and 13 TDP-43Q331K/Q331K mice). (a) Pairwise comparisons: wild-type vs. TDP-43Q331K/+: P=0.014 (*); wild-type vs. TDP-43Q331K/Q331K: P=0.0024 (**). (b) Pairwise comparisons: wild-type vs. TDP-43Q331K/+: P=0.002 (**); wild-type vs. TDP-43Q331K/Q331K: P=0.0002 (***). (c) Weekly food consumption over 9 weeks (n = 2 cages per genotype). Comparison: Genotype: P=0.047(*). (d) Rotarod of weight-matched Cohort 2 mice (n = 16 wild-type, 13 TDP-43Q331K/+ and 15 TDP-43Q331K/Q331K mice). For (a-d) repeated measures two-way ANOVA followed by Holm-Sidak post-hoc test for pairwise comparisons. (e) Nissl-stained lumbar motor neurons of 5-month-old mice. Representative images shown. Scale bar, 40μm. (f) Quantification of lumbar motor neurons (n = 4 mice per genotype). Comparison: P=0.089 (ns); unpaired t test. (g) Examples of isometric twitch force recordings during graded nerve stimulation of FDB muscles from representative wild-type and TDP-43Q331K/Q331K mice. Each increment corresponds to recruitment of motor units of successively higher electrical threshold (n = 5 mice per genotype). (h) MA plot and (i) hierarchical clustering of significantly differentially expressed genes (DEGs) in laser-captured motor neurons. In (h) blue dots indicate significant changes, red dots indicate intensity hits. In (i) Genes Aox1 and Agrin are labelled. Comparison: DESeq2 wild-type v TDP-43Q331K/Q331K (j) Immunohistochemistry for AOX1. Representative images from a 5-month-old wild-type mouse shown. Scale bars, 10μm motor neuron, 100μm ventral root. (k) AOX1 immunofluorescence in lumbar motor neurons. Comparison: P=0.433 (ns); unpaired t test. For (h-k) n = 4 mice per genotype. All error bars denote mean ± s.e.m.
Figure 3
Figure 3. Cognitive testing indicates executive dysfunction, memory impairment and phenotypic heterogeneity in mutant mice
(a) Schematic for the 5-choice serial reaction time task (5-CSRTT). (b) Sessions required to reach performance criteria for 5-CSRTT (n = 16 per genotype). Pairwise comparisons: wild-type vs. TDP-43Q331K/+: P=0.083 (ns); wild-type vs. TDP-43Q331K/Q331K: P=0.004 (**). (c) 5-CSRTT at 6 months of age (n = 15 wild-type, 16 TDP-43Q331K/+, 15 TDP-43Q331K/Q331K mice). Baseline session genotype effects: accuracy: P=0.109; omission: P=0.283). Stimulus duration (SD) probe test genotype effects: accuracy: P=0.833; omission: P=0.077 (ns); SD effect: accuracy and omission: P<0.001; Mixed-effects model. (d) 5-CSRTT at 12 months of age (n = 15 wild-type, 16 TDP-43Q331K/+, 16 TDP-43Q331K/Q331K mice). Baseline session genotype effects: accuracy: P=0.487; omission: P=0.120. SD probe test genotype effects: accuracy: P=0.880; omission: P=0.044 (*); SD effect: accuracy: P<0.0001; omission: P<0.0001; genotype by SD interaction: accuracy: P=0.081; omission: P=0.271; Mixed-effects model. (e) Mean trials completed on an unrestricted fixed-ratio schedule (n = 16 per genotype). (f) Mean breakpoint on a progressive-ratio schedule (response increment per trial = 4; n = 16 per genotype). (g) Novel object recognition sample and (h) choice phases (n = 8 wild-type, 9 TDP-43Q331K/+, 8 TDP-43Q331K/Q331K mice). For (h) 1 min delay pairwise comparisons: wild-type vs. TDP-43Q331K/+: P=0.158 (ns); wild-type vs. TDP-43Q331K/Q331K: P=0.158 (ns); 3 hour delay pairwise comparisons: wild-type vs. TDP-43Q331K/+: P=0.014 (*); wild-type vs. TDP-43Q331K/Q331K: P=0.009 (**). For (b,e,f) one-way ANOVA and (g,h) two-way ANOVA, all followed by Holm-Sidak post-hoc tests for pairwise comparisons. (i) Marbles buried in Cohort 1 at 18 months of age (n = 15 wild-type, 13 TDP-43Q331K/+, 14 TDP-43Q331K/Q331K mice). Pairwise comparisons: wild-type vs. TDP-43Q331K/+: P=0.009 (**); wild-type vs. TDP-43Q331K/Q331K: P<0.0001 (****); Kruskal-Wallis followed by Dunn’s test for pairwise comparisons. Error bars denote s.e.m. for (c) to (h) and median and interquartile range for (b) and (i).
Figure 4
Figure 4. Perturbed TDP-43 autoregulation and loss of parvalbumin interneurons in mutant mice
(a) Marbles buried by 5-month-old mice. Coloured dots indicate animals used for RNASeq analysis. Yellow dots indicate TDP-43Q331K/Q331K littermates (n = 19 wild-type, 19 TDP-43Q331K/+, 17 TDP-43Q331K/Q331K mice). Pairwise comparisons: wild-type vs. TDP-43Q331K/+: P=0.028 (*); wild-type vs. TDP-43Q331K/Q331K: P=0.013 (*); Kruskal-Wallis followed by Dunn’s test for pairwise comparisons. Error bars represent median and interquartile range. (b) Representative Nissl staining of frontal cortex (layers indicated) (n = 5 wild-type, 6 TDP-43Q331K/Q331K mice). Scale bar, 500μm. (c) Immunohistochemistry for TDP-43 in pyramidal neurons of motor cortex layer V. Representative images shown (n = 4 mice per genotype). Scale bar, 20μm. (d) Immunoblot of fractionated frontal cortical tissue from 5-month-old mice (two biological replicates shown, uncropped in Supplementary Fig. 5). (e) Immunoblot band intensity quantification (n = 4 mice per genotype). Comparison: P=0.007 (**); unpaired t test. Error bars denote s.e.m. (f) MA plot and (g) hierarchical clustering of DEGs (n = 6 wild-type, 6 TDP-43Q331K/+, 8 TDP-43Q331K/Q331K mice) in frontal cortex. For (f) blue dots indicate significant changes, red dots indicate intensity hits. Comparison: DESeq2 wild-type v TDP-43Q331K/Q331K. For (g) gene ontology (GO) biological process and KEGG pathway enriched terms are displayed. (h) Expression changes for parvalbumin and ALS-FTD linked genes identified by RNASeq. (i) Immunohistochemistry for parvalbumin in cortices of 5-month-old mice. Representative images shown. Scale bar, 250μm. (j) Quantification of parvalbumin-positive neurons (n = 3 mice per genotype). Comparison: P=0.0003 (***); unpaired t test. Error bars denote s.e.m. (k) Immunohistochemistry for TDP-43 in parvalbumin-positive cells. Representative images shown. Scale bar, 5μm. (l) TDP-43 expression in parvalbumin-positive cells (n=5 mice per genotype). Comparison by two-way ANOVA. Error bars denote s.e.m.
Figure 5
Figure 5. Splicing analysis indicates TDP-43 misregulation, a gain of TDP-43 function and altered Mapt exon 2/3 splicing
(a) MA plot and (b) hierarchical clustering of frontal cortical alternative splice events (n = 6 wild-type, 6 TDP-43Q331K/+, 8 TDP-43Q331K/Q331K mice). Comparison: DESeq2 wild-type v TDP-43Q331K/Q331K. (c) Schematic of altered splicing in the 3’UTR of Tardbp. Arrow indicates reduced exclusion of intron 7 of the Tardbp transcript in TDP-43Q331K/Q331K relative to wild-type mice. (d) Quantitative PCR (qPCR) of splicing changes in Tardbp intron 7 (n = 6 wild-type, 6 TDP-43Q331K/+, 8 TDP-43Q331K/Q331K mice). (e) Schematic of exon 17b inclusion/exclusion in Sort1. Arrows indicate reduced inclusion of exon 17b in TDP-43Q331K/Q331K relative to wild-type mice. (f) qPCR of splicing changes in Sort1 exon 17b (n = 6 wild-type, 6 TDP-43Q331K/+, 8 TDP-43Q331K/Q331K mice). (g) Schematic of altered splicing of exons 2 and 3 of Mapt. Arrows indicate increased inclusion of exons 2 and 3 in the Mapt transcripts of TDP-43Q331K/Q331K relative to wild-type mice. The expanded view of exon 1 to exon 2 includes a site of TDP-43 binding as detected by iCLIP (iCount pipeline; TDP-43_CLIP_E18-brain). (h) Schematic of N-terminal Mapt splice variants (0N, 1N and 2N). (i) qPCR of splicing changes in Mapt exons 2 and 3 (n = 6 wild-type, 6 TDP-43Q331K/+, 8 TDP-43Q331K/Q331K mice). 2N/0N pairwise comparisons: wild-type vs. TDP-43Q331K/+: P=0.047 (*); wild-type vs. TDP-43Q331K/Q331K: P=0.0001 (***); TDP-43Q331K/+ vs. TDP-43Q331K/Q331K: P=0.013 (*). (j-k) qPCR of hippocampal splicing changes (n = 4 wild-type, 3 TDP-43Q331K/+, 4 TDP-43Q331K/Q331K mice per gender). Pairwise comparisons: Tardbp intron 7 exclusion, male: wild-type vs. TDP-43Q331K/+: P=0.043 (*); TDP-43Q331K/+ vs. TDP-43Q331K/Q331K: P=0.002 (**); female: wild-type vs. TDP-43Q331K/+: P=0.013 (*); TDP-43Q331K/+ vs. TDP-43Q331K/Q331K: P=0.0002 (***); Mapt: 0N, male: wild-type vs. TDP-43Q331K/+: P=0.023 (*); wild-type vs. TDP-43Q331K/Q331K: P=0.023 (*); TDP-43Q331K/+ vs. TDP-43Q331K/Q331K: P=0.877 (ns); female: wild-type vs. TDP-43Q331K/+: P=0.365 (ns); wild-type vs. TDP-43Q331K/Q331K: P=0.324 (ns); TDP-43Q331K/+ vs. TDP-43Q331K/Q331K: P=0.858 (ns); 1N/0N, male: wild-type vs. TDP-43Q331K/+: P=0.008 (**); TDP-43Q331K/+ vs. TDP-43Q331K/Q331K: P=0.008 (**); female: wild-type vs. TDP-43Q331K/+: P=0.077 (ns); TDP-43Q331K/+ vs. TDP-43Q331K/Q331K: P=0.002 (**); 2N/0N, male: wild-type vs. TDP-43Q331K/+: P=0.002 (**); wild-type vs. TDP-43Q331K/Q331K: P=0.0001 (***); TDP-43Q331K/+ vs. TDP-43Q331K/Q331K: P=0.151 (ns); female: wild-type vs. TDP-43Q331K/+: P=0.202 (ns). For (d,f,i-k) P<0.0001 (****). For (d,f,i) one-way and (j,k) two-way ANOVA, all followed by Holm-Sidak post-hoc tests for pairwise comparisons. Error bars denote s.e.m.
Figure 6
Figure 6. TDP-43 misregulation occurs in spinal cords of mutant mice, but not in motor neurons
(a) Schematic detailing lumbar spinal cord (LSC) processing for transcriptomic analysis (LCM, laser capture microdissection). (b) MA plots of lumbar motor neuronal differentially expressed and spliced genes (n = 4 mice per genotype). Comparison: DESeq2 wild-type v TDP-43Q331K/Q331K. Blue and red dots indicate significant changes. Green dots highlight Tardbp expression, Tardbp intron 7 exclusion and Sort1 exon 17b inclusion, which are not significant changes. (c-d) Quantitative PCR of homogenised lumbar spinal cord (n = 4 wild-type, 4 TDP-43Q331K/+, 4 TDP-43Q331K/Q331K mice). Comparisons as follows: (c) Tardbp expression: wild-type vs. TDP-43Q331K/+: P=0.103 (ns); wild-type vs. TDP-43Q331K/Q331K: P=0.0008 (***); TDP-43Q331K/+ vs. TDP-43Q331K/Q331K: P=0.007 (**). Tardbp intron 7 exclusion: wild-type vs. TDP-43Q331K/+: P=0.001 (***); wild-type vs. TDP-43Q331K/Q331K: P>0.0001 (****); TDP-43Q331K/+ vs. TDP-43Q331K/Q331K: P=0.002 (**). Sort1 exon 17b inclusion: P<0.0001 (****). (d) 0N Mapt. 1N Mapt: wild-type vs. TDP-43Q331K/+: P=0.640 (ns); wild-type vs. TDP-43Q331K/Q331K: P=0.02 (*); TDP-43Q331K/+ vs. TDP-43Q331K/Q331K: P=0.03 (*). 2N Mapt. (c-d) Comparisons by one-way ANOVA followed by Holm-Sidak post-hoc tests. Error bars denote s.e.m.
Figure 7
Figure 7. Phenotypic stratification of transcriptomic data from mutant mice allows the identification of putative disease modifiers
(a) Marble-burying in 5-month-old mice prior to sacrifice. MB+ mice bury at or above the median number of marbles for the group, and MB- mice bury fewer. Yellow dots indicate TDP-43Q331K/Q331K littermates. (b) Marble burying activity of TDP-43Q331K/Q331K littermates as described in (a). (c) Hierarchical clustering of DEGs in frontal cortices comparing MB+ and MB- TDP-43Q331K/Q331K mice. Genes Atxn2 and Arid4a are highlighted (n = 6 wild-type, 4 MB+ TDP-43Q331K/Q331K and 4 MB- TDP-43Q331K/Q331K mice). Comparison: DESeq2 MB+ v MB-. Gene ontology (GO) biological processes and KEGG pathway enriched terms are displayed. (d) Graphical representation of altered splicing of Mbp. Arrows indicate the altered pattern of splicing in MB+ relative to MB- TDP-43Q331K/Q331K mice. (e) qPCR of the ratio of Mbp Basic to Mbp Golli (n = 6 wild-type, 4 TDP-43Q331K/+, 4 TDP-43Q331K/Q331K mice). Pairwise comparisons: wild-type vs. MB+: P=0.005 (**); wild-type vs. MB-: P=0.024 (*); MB+ vs. MB-: P=0.0003 (***); one-way ANOVA followed by Holm-Sidak post-hoc tests. Error bars denote s.e.m. (f) Representative marble burying analyses: 4:4, original analysis; 3:3, comparing the three best MB+ and three worst MB- mice; 4v4 mixed, one MB- mouse swapped with one MB+ mouse. Number of DEGs identified by DESeq2 comparison of MB+ v MB- mice for each comparison is given below. For 3:3, hits common to the 4:4 stratification are shown in brackets.
Figure 8
Figure 8. TDP-43Q331K mice demonstrate age-related deterioration in cortical transcriptomes with altered expression of multiple ALS-linked genes
(a) MA plot and (b) hierarchical clustering of DEGs in frontal cortices at 20 months of age (n = 8 wild-type, 10 TDP-43Q331K/+, 10 TDP-43Q331K/Q331K mice). For (a) blue dots indicate significant changes, red dots indicate intensity hits. Comparison: DESeq2 wild-type v TDP-43Q331K/Q331K. For (b) gene ontology (GO) biological processes and KEGG pathway enriched terms are displayed. (c) Venn diagram highlighting DEGs between wild-type v TDP-43Q331K/Q331K mice that were common to analyses in 5 and 20-month-old mice. Known ALS-FTD linked genes within this common subset are highlighted in (d). (e) MA plot and (f) hierarchical clustering of frontal cortical alternative splice events at 20 months of age (n = 8 wild-type, 10 TDP-43Q331K/+, 10 TDP-43Q331K/Q331K mice). Blue dots indicate significant changes, red dots indicate intensity hits. Comparison: DESeq2 wild-type v TDP-43Q331K/Q331K. For (a,b,e,f) n = 8 wild-type, 10 TDP-43Q331K/+, 10 TDP-43Q331K/Q331K mice. (g) Venn diagram highlighting alternative splice events between wild-type v TDP-43Q331K/Q331K mice that are common to analyses in 5 and 20-month-old mice. Known ALS-FTD linked genes within this common subset are highlighted in (h). (i) Schematic of Matr3 exon 14 inclusion/exclusion. Arrows indicate increased inclusion of exon 14 in TDP-43Q331K/Q331K relative to wild type mice. (j) Schematic of Sqstm1 transcript splice variants. Percentages given indicate the relative amount of each variant in TDP-43Q331K/Q331K mice. The TDP-43Q331K-specific variant is undetectable in wild-type mice.

References

    1. Burrell JR, et al. The frontotemporal dementia-motor neuron disease continuum. Lancet. 2016;388:919–931. doi: 10.1016/S0140-6736(16)00737-6. - DOI - PubMed
    1. Neumann M, et al. Ubiquitinated TDP-43 in frontotemporal lobar degeneration and amyotrophic lateral sclerosis. Science. 2006;314:130–133. - PubMed
    1. Arai T, et al. TDP-43 is a component of ubiquitin-positive tau-negative inclusions in fronto temporal lobar degeneration and amyotrophic lateral sclerosis. Biochemical and biophysical research communications. 2006;351:602–611. - PubMed
    1. Sreedharan J, et al. TDP-43 mutations in familial and sporadic amyotrophic lateral sclerosis. Science. 2008;319:1668–1672. - PMC - PubMed
    1. Benajiba L, et al. TARDBP mutations in motoneuron disease with frontotemporal lobar degeneration. Ann Neurol. 2009;65:470–473. doi: 10.1002/ana.21612. - DOI - PubMed

Publication types

MeSH terms

Supplementary concepts