Comment
. 2018 May;21(5):683-695.
doi: 10.1038/s41593-018-0120-6. Epub 2018 Mar 19.

Lifelong cortical myelin plasticity and age-related degeneration in the live mammalian brain

Affiliations
Comment

Lifelong cortical myelin plasticity and age-related degeneration in the live mammalian brain

Robert A Hill et al. Nat Neurosci. 2018 May.

Abstract

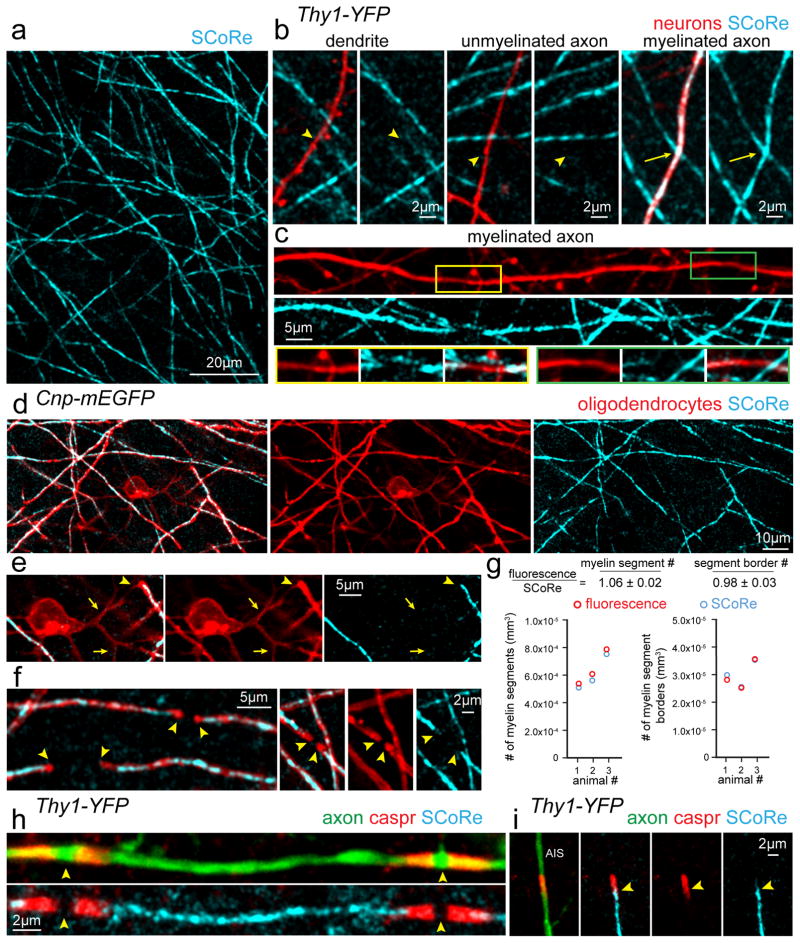
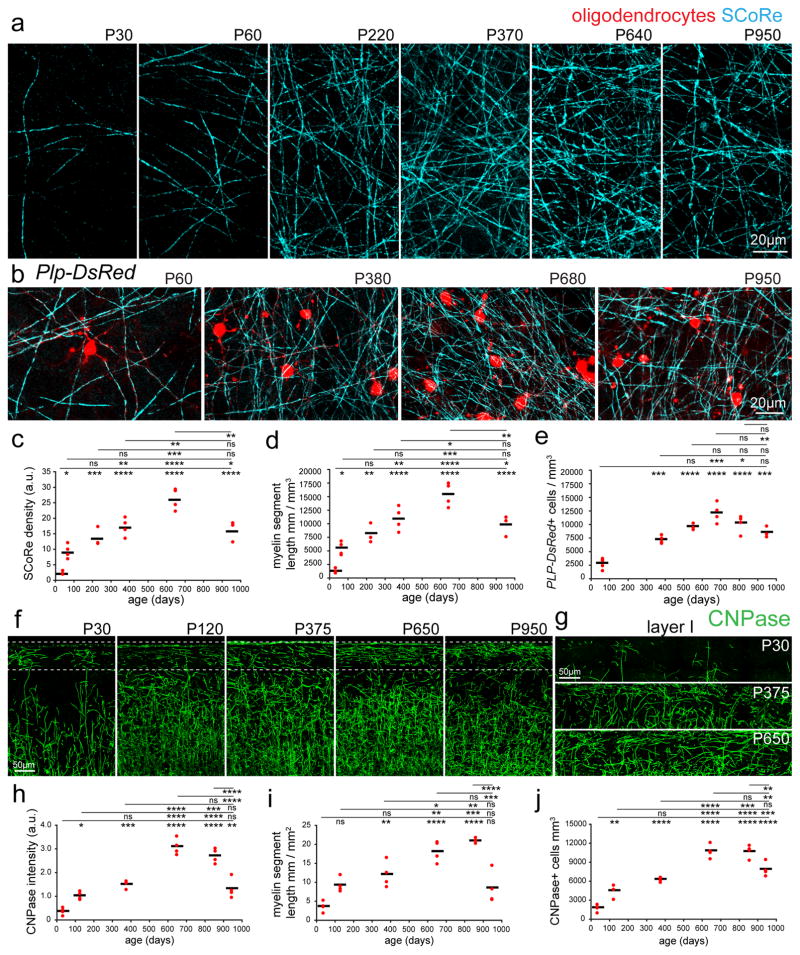
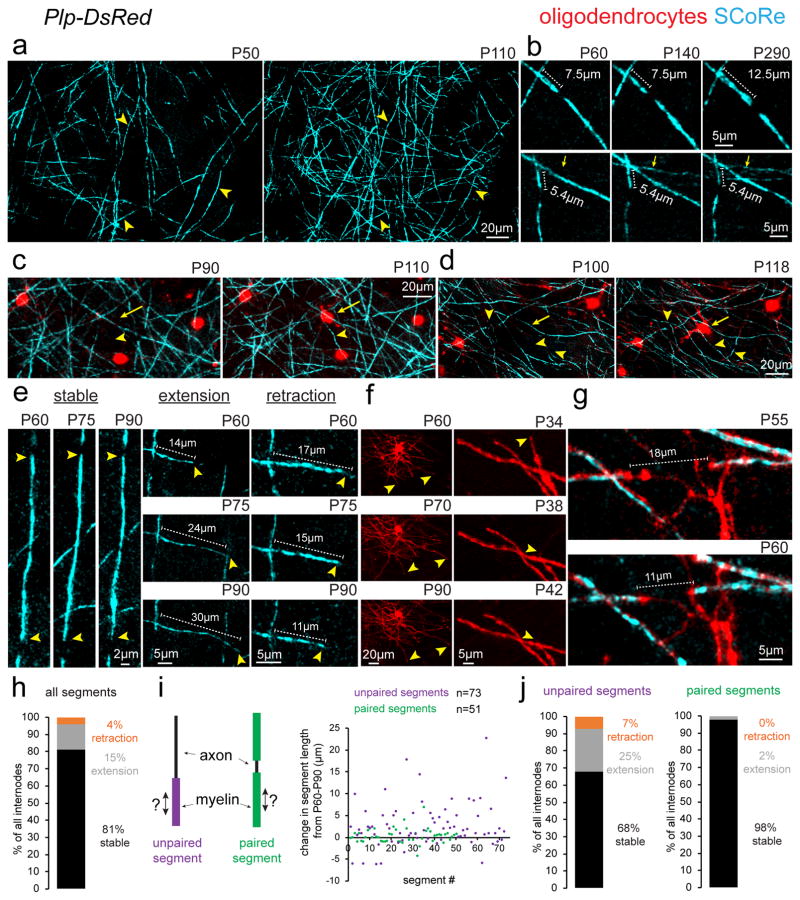
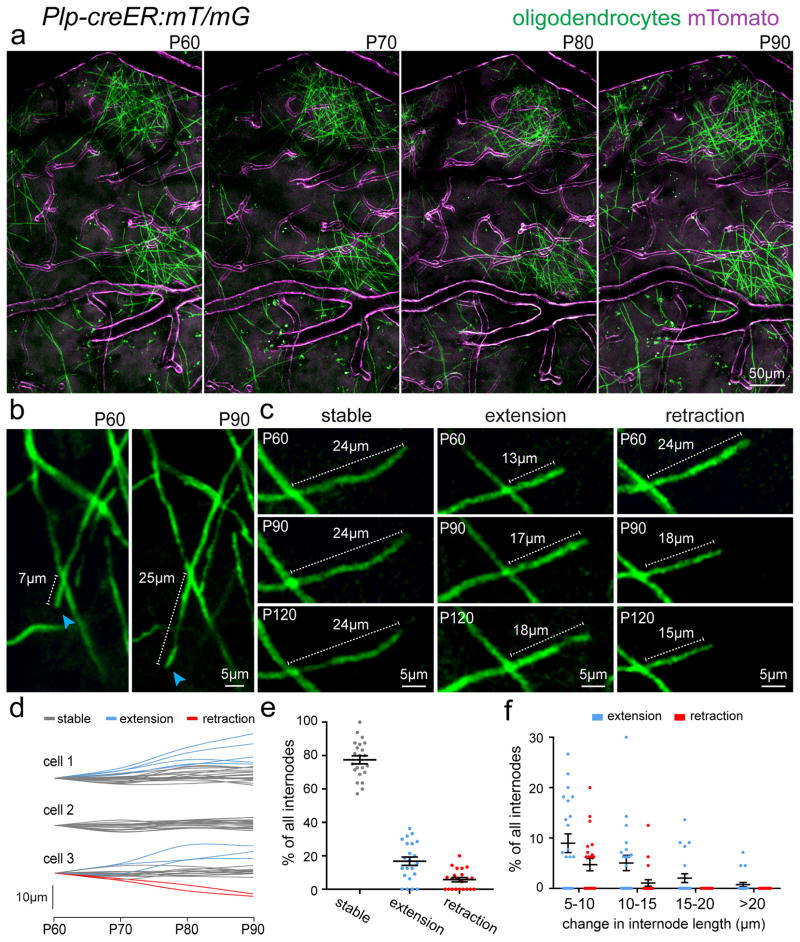
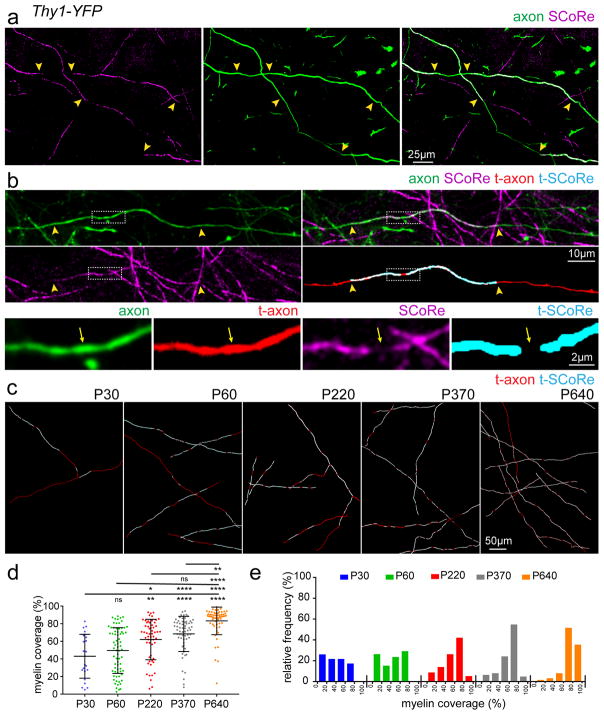
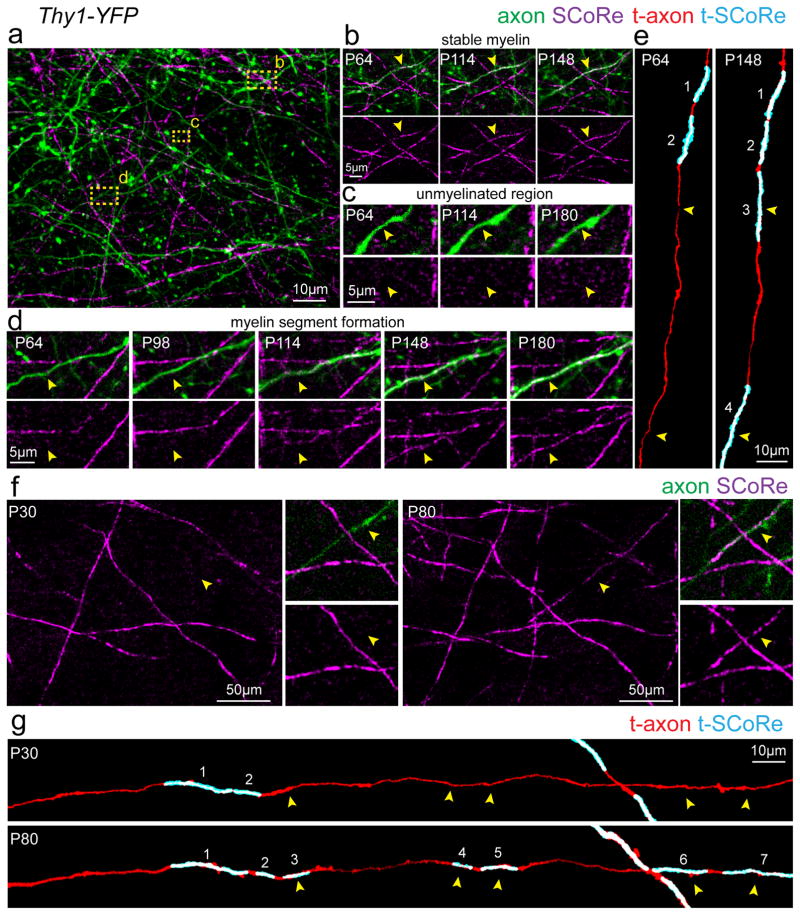
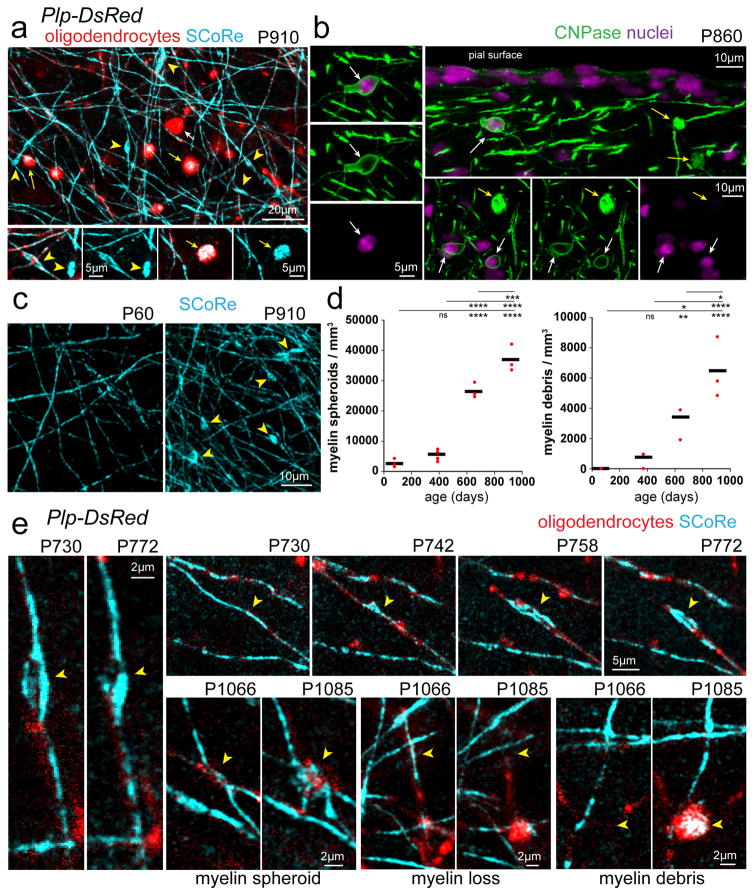
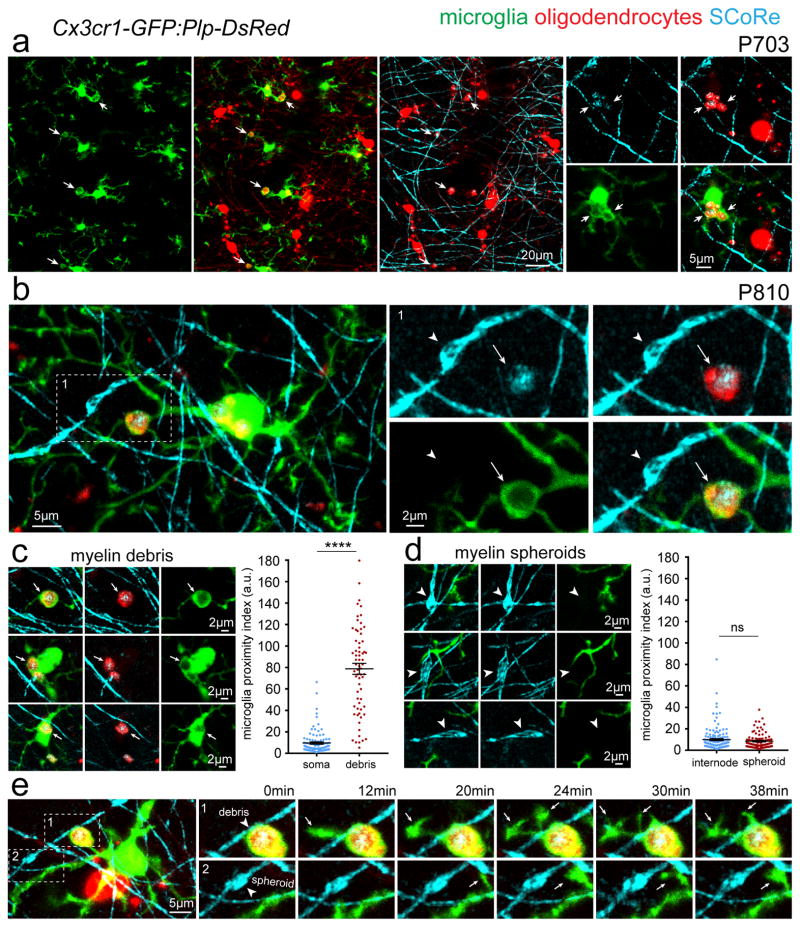
Axonal myelin increases neural processing speed and efficiency. It is unknown whether patterns of myelin distribution are fixed or whether myelinating oligodendrocytes are continually generated in adulthood and maintain the capacity for structural remodeling. Using high-resolution, intravital label-free and fluorescence optical imaging in mouse cortex, we demonstrate lifelong oligodendrocyte generation occurring in parallel with structural plasticity of individual myelin internodes. Continuous internode formation occurred on both partially myelinated and unmyelinated axons, and the total myelin coverage along individual axons progressed up to two years of age. After peak myelination, gradual oligodendrocyte death and myelin degeneration in aging were associated with pronounced internode loss and myelin debris accumulation within microglia. Thus, cortical myelin remodeling is protracted throughout life, potentially playing critical roles in neuronal network homeostasis. The gradual loss of internodes and myelin degeneration in aging could contribute significantly to brain pathogenesis.


Conflict of interest statement

COMPETING INTERESTS

The authors declare no competing financial interests.

Figures

Figure 1
Figure 1. Spectral confocal reflection (SCoRe) microscopy for label-free myelin imaging
(a) In vivo image using SCoRe microscopy, captured from layer I of the mouse somatosensory cortex showing single myelin internodes. (b) In vivo images captured from a transgenic mouse with sparse YFP fluorescent protein labeling in a subset of neurons (Thy1-YFP) showing non-reflective fluorescently labeled dendrites and unmyelinated axons (arrowheads) and a myelinated reflective axon (arrows). (c) In vivo image showing unmyelinated gaps (insets) along a regularly myelinated axon further showing the specificity of the SCoRe imaging technique. (d) In vivo image captured from a transgenic mouse with membrane tethered EGFP expressed specifically in myelinating oligodendrocytes (Cnp-mEGFP) showing complete overlap between fluorescently labeled myelinating internodes and SCoRe. (e) In vivo image showing a single oligodendrocyte cell body with proximal, non-myelinating, processes extending from the soma (arrows) and then forming a myelin sheath revealed by the co-localization of the fluorescent and SCoRe signal (arrowheads). (f) The borders of single internodes (arrowheads) are indicated demonstrating the specificity and overlap between oligodendrocyte specific mEGFP and SCoRe. (g) Quantification of myelin segments (left) and myelin segment borders (right) detected using either CNP-mEGFP fluorescence (red) or SCoRe (cyan) signals demonstrating similar detection of both myelin segments and the borders of single internodes using either the fluorescent label or SCoRe. (159 SCoRe segments, 169 mEGFP segments, 856 SCoRe segment borders, 842 mEGFP segment borders, from n=3 mice) See Supplementary Figure 2 for further example quantification. (h) Image of fixed immunolabeled cortical tissue showing a single internode with localization of the paranodal protein Caspr bordering two nodes of Ranvier (arrowheads) and the SCoRe signal arising only from the myelin internode. (i) The precise start of SCoRe signal at the edge of the axon initial segment (AIS) adjacent to the Caspr labeling (arrowheads) again showing the precise specificity of the SCoRe signal for myelin. Each image is representative of at least three locations in at least three animals.
Figure 2
Figure 2. Lifelong changes in cortical myelin and oligodendrocyte density
(a) SCoRe images captured in vivo at the postnatal day indicated show marked age-dependent changes in myelin density in layer I of the somatosensory cortex. (b) In vivo images captured from transgenic mice with DsRed fluorescent protein expressed specifically in mature oligodendrocytes (Plp-DsRed), demonstrate age-dependent changes in oligodendrocyte density corresponding to the changes observed in SCoRe signal. (c) Average SCoRe reflection density obtained from imaging large regions of interest in vivo at the indicated ages show significant increases in reflective signals until 640 days, followed by a marked decline as the mice age, statistical test: one-way ANOVA with Tukey correction for multiple comparisons. n=3–4 mice per age. (d) A measurement of myelination length per volume unit derived from SCoRe images at the indicated ages shows a gradual increase in the total myelin segment length per area until 640 days, followed by a decline in aging, statistical test: one-way ANOVA with Tukey correction for multiple comparisons, n=3–4 mice per age. (e) Oligodendrocyte imaging (Plp-DsRed+ cells) at the indicated ages show significant increases in oligodendrocyte density until 640 days followed by a decrease as the mice age, statistical test: one-way ANOVA with Tukey correction for multiple comparisons, n=3–6 mice per age. (f–g) Images of oligodendrocyte specific CNPase staining captured from the somatosensory cortex showing age-dependent changes in layer I of the cortex (boxed regions). (h) CNPase staining density at the indicated ages showing significant increases in fluorescence signal until P650, followed by a marked decline in aging, statistical test: one-way ANOVA with Tukey correction for multiple comparisons. n=4 mice per age, each red dot indicates one mouse. (i) CNPase process length per volume at the indicated ages showing significant increases in the total myelin segment length until 650 days, statistical test: one-way ANOVA with Tukey correction for multiple comparisons, n=4 mice per age. (j) CNPase+ oligodendrocyte density at the indicated ages showing significant increases in oligodendrocyte density until 650 days, with a significant decline in aging, statistical test: one-way ANOVA with Tukey correction for multiple comparisons, n=4 mice per age, in all graphs each red dot indicates one mouse and the horizontal line indicates the mean. NS = not significant, * = P<0.05, ** = P<0.01, ***P<0.001, ****P<0.0001, lines indicate mean. Descriptive statistics can be found in Supplementary Table 1. Each image is representative of at least three locations in at least three animals.
Figure 3
Figure 3. Protracted addition of new internodes and long-term myelin sheath plasticity
(a) Time lapse in vivo SCoRe microscopy at the postnatal day indicated shows the appearance of numerous newly reflective internodes. Arrowheads indicate the location of the same axons at different time points. (b) Repeated in vivo imaging of changes in compact myelin over 230 days showing the addition of new myelinating internodes (arrows) and the stability or plasticity of presumptive nodes of Ranvier as myelin internode length changes. (c–d) Longitudinal time-lapse in vivo imaging shows the emergence of new oligodendrocytes (arrows) correlating with the formation of new SCoRe-positive internodes (arrowheads). (e) Time-lapse images showing the three types of observed behaviors for internode length dynamics (stable, extension, or retraction). Arrowheads indicate the ends of myelin segments with lengths of single segments indicated (dotted lines). (f) In vivo time-lapse images of oligodendrocytes in Plp-DsRed mice showing changes in internode length (arrowheads) at the postnatal age indicated. (g) In vivo time-lapse images of adjacent internodes (arrowheads) getting closer over time. (h) Breakdown of all SCoRe labeled myelin segment plasticity behavior between P60 to P90 (n=124 myelin segments from 3 mice). (i) Diagram showing the definition of a paired or unpaired myelin segment and the total change in length of all segments imaged between P60–P90, each dot represents one myelin segment. (j) Breakdown of myelin segment plasticity behavior separated into paired or unpaired subgroups demonstrating that the vast majority of segment length change over time occurs by unpaired myelin segments. Each image is representative of at least three locations in at least three animals.
Figure 4
Figure 4. Evidence of myelin plasticity through internode remodeling
(a) In vivo two-photon fluorescence images of single oligodendrocytes imaged over 30 days in a transgenic mouse line (Plp-creER:mT/mG) with membrane tethered GFP (mGFP) expressed specifically in mature oligodendrocytes and membrane tethered Tomato (mTomato) expressed predominantly in cerebral blood vessels. (b) In vivo time-lapse images showing extension of a single internode (blue arrowheads) with stability of all other internodes in the field of view. (c) In vivo time-lapse images showing the three observed behaviors for internode length changes over time. (d) Measurements of changes in single internode length for individual oligodendrocytes as indicated. Single cells exhibited heterogeneous internode plasticity over the 30 days of imaging with single internodes remaining stable (gray lines), extending (blue lines), or retracting (red lines). (e–f) Distribution of the single internode behavior in all cells. The vast majority of internodes showed no change (>5μm) in length however a proportion displayed long-term extension or retraction over the imaging period ranging from 5–20μm changes over 30 days of imaging as indicated, data represent 22 individual oligodendrocytes, 330 internodes, from 3 mice. Dots indicate single oligodendrocytes and error bars are mean +/− s.e.m., each image is representative of at least three locations in at least three animals.
Figure 5
Figure 5. Lifelong changes in myelin coverage along single cortical axons
(a) In vivo image captured from the cortex of a P30 Thy1-YFP transgenic mouse showing two partially myelinated axons designated by the discontinuous SCoRe signal arising from regions of the axon not covered by a myelin segment (yellow arrowheads). (b) In vivo images showing a single axon that was imaged with SCoRe and traced to determine the distribution of myelin along the axon. High magnification insets showing the precise location and distribution of compact myelin (t-SCoRe = traced SCoRe, t-Axon = traced axon) along the single axon. Arrows indicate the end of the myelinating internodes and arrowheads indicate a node of Ranvier. (c) Representative traced axons from mice at the ages indicated showing age-dependent increase in myelin coverage along single axons. (d) Grouped data showing the percent myelin coverage of single axons imaged at the designated age, statistical test: one-way ANOVA with Tukey correction for multiple comparisons. (e) Relative frequencies of single axon myelin coverage at the designated ages showing a protracted shift in total axon coverage with age. Sample size (n) for quantification for (d–e): P30=23 axons from 4 mice, P60=72 axons from 4 mice, P220=57 axons from 3 mice, P370=62 axons from 4 mice, and P640=62 axons from 4 mice. Dots indicate single axons. NS = not significant, * = P<0.05, ** = P<0.01, ***P<0.001, ****P<0.0001 error bars are mean +/− s.e.m., descriptive statistics can be found in Supplementary Table 1. Each image is representative of at least three locations in at least three animals.
Figure 6
Figure 6. Continuous myelin deposition along partially myelinated axons
(a) In vivo SCoRe and fluorescence image captured from the cortex of a P64 Thy1-YFP transgenic mouse showing the patchy myelin distribution along a single axon designating the regions highlighted in panels (b–d). (b) Repeated imaging of the region designated in panel (a) showing stable myelination (arrowheads) on this portion of the imaged axon over 84 days of imaging. (c) Repeated imaging of the region designated in panel (a) showing a region along the same axon that remains unmyelinated (arrowheads) over the 116 days of imaging. (d) Repeated imaging of the region designated in panel (a) showing a region along the same axon that becomes myelinated (arrowheads) during the 116 days of imaging. (e) Semi-automatic axonal myelin distribution reconstructions of the axon depicted in (a–d) showing the addition of new myelin segments (arrowheads). Numbers indicate the same myelin segment. (f) In vivo SCoRe and fluorescence time-lapse images showing the formation of a new myelin segment along a single Thy1-YFP fluorescently labeled axon (arrowheads). (g) Semi-automatic axonal myelin distribution reconstruction of the axon designated in (f) showing the formation of several myelin segments along the traced axon (arrowheads) with other regions remaining unmyelinated over the 50 days of imaging. Numbers indicate the same myelin segment. Each image is representative of at least three locations in at least three animals.
Figure 7
Figure 7. Oligodendrocyte and myelin degeneration in advanced aging
(a) In vivo images captured from the cortex of a 910-day old mouse with mature oligodendrocytes labeled with DsRed (Plp-DsRed). Examples of myelin pathology detected in aged mice revealed by SCoRe label free imaging and DsRed fluorescence in or derived from oligodendrocytes. Myelin spheroids (yellow arrowheads) can be detected using SCoRe and are only found in aged mice. Myelin debris (yellow arrows) can also be detected using SCoRe and the vast majority were found to have accumulation of DsRed fluorescent protein in the Plp-DsRed transgenic mice suggesting a myelin origin. Myelin debris (yellow arrows) and oligodendrocyte cell bodies (white arrows) can be distinguished due to the lack of SCoRe signals in addition to the proximal processes extending from the cell soma. (b) Images captured from tissue sections immunostained for oligodendrocyte specific CNPase showing the distinction between myelin debris (yellow arrows) and oligodendrocyte cell bodies (white arrows) confirmed via nuclear dye labeling. (c–d) Age-dependent increase in the presence of myelin spheroids (yellow arrowheads) and myelin accumulations, statistical tests: one-way ANOVA with Tukey correction for multiple comparisons n=3–4 mice per age. NS = not significant, * = P<0.05, ** = P<0.01, ***P<0.001, ****P<0.0001. Each dot indicates one mouse and horizontal lines indicate the mean (e) In vivo time lapse images showing the dynamics of age-related myelin pathology (yellow arrowheads) with some myelin spheroids remaining stable, formation of myelin spheroids, single fiber loss, and myelin debris accumulations. Descriptive statistics can be found in Supplementary Table 1. Each image is representative of at least three locations in at least three animals.
Figure 8
Figure 8. Myelin debris accumulate in microglia in advanced aging
(a) In vivo combined SCoRe and fluorescence images from aged (P703) dual reporter transgenic mice with GFP-labeled microglia and DsRed-labeled oligodendrocytes (Cx3cr1-GFP:Plp-DsRed) arrows indicate myelin debris accumulations within microglia (b) In vivo image showing accumulation of reflective and DsRed labeled myelin debris within a single microglial process (arrow) but not microglial contact to the immediately adjacent myelin spheroid (arrowhead). (c) Examples images of myelin debris accumulations in GFP labeled microglia (arrows) and quantification of microglia-GFP fluorescence intensity (microglia proximity index) surrounding myelin debris which was not found around intact oligodendrocyte soma (**** P < 0.0001 n = 67 myelin debris structures and 102 oligodendrocyte soma from 3 mice aged P810, unpaired two-tailed student’s t-test) each dot indicates one debris or one oligodendrocyte soma and error bars are mean +/− s.e.m. (d) Example images of myelin spheroids (arrowheads) with no microglia process polarization, association, or engulfment with quantification showing no difference in microglia-GFP fluorescence intensity (microglia proximity index) surrounding myelin spheroids or normal appearing myelin internodes (NS = not significant P = 0.2482, n = 103 myelin spheroids and 136 internodes from 3 mice, unpaired two-tailed student’s t-test) each dot indicates one spheroid or internode and error bars are mean +/− s.e.m. (e) In vivo time-lapse images of the boxed regions showing dynamic microglia surveillance with filopodia (arrows) extending from a single process filled with myelin debris (arrowhead in top image sequence) and no directed microglia surveillance of an adjacent myelin spheroid (arrowhead in bottom image sequence). Descriptive statistics can be found in Supplementary Table 1. Each image is representative of at least three locations in at least three animals.

Comment on

Similar articles

Cited by

References

    1. Salzer JL, Zalc B. Myelination. Curr Biol. 2016;26:R971–R975. - PubMed
    1. Nave KA. Myelination and support of axonal integrity by glia. Nature. 2010;468:244–252. - PubMed
    1. Waxman SG. Axon-glia interactions: building a smart nerve fiber. Curr Biol. 1997;7:R406–10. - PubMed
    1. Hutchinson NA, Koles ZJ, Smith RS. Conduction velocity in myelinated nerve fibres of Xenopus laevis. J Physiol (Lond) 1970;208:279–289. - PMC - PubMed
    1. Hess A, Young JZ. Correlation of internodal length and fibre diameter in the central nervous system. Nature. 1949;164:490–491. - PubMed