. 2018 Mar 5:9:417.
doi: 10.3389/fimmu.2018.00417. eCollection 2018.

The Long Pentraxin 3 Plays a Role in Bone Turnover and Repair

Affiliations

The Long Pentraxin 3 Plays a Role in Bone Turnover and Repair

Danka Grčević et al. Front Immunol. .

Abstract

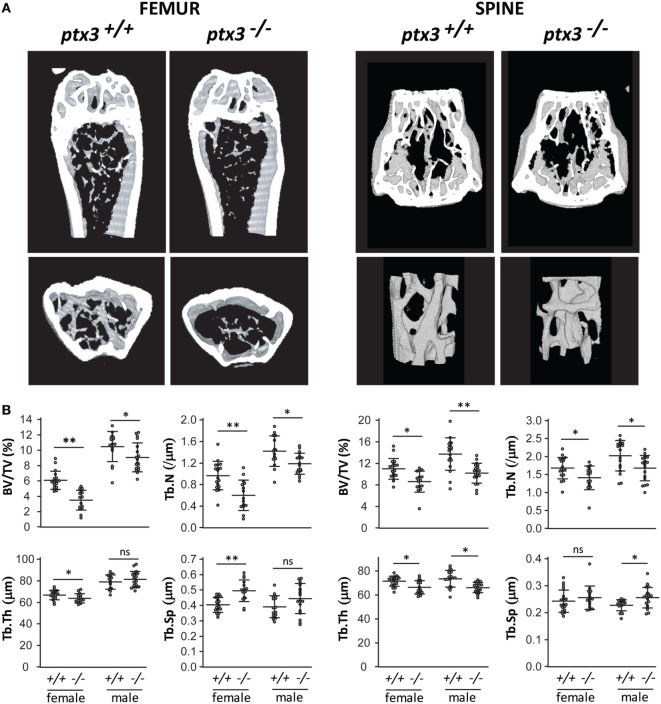
Pentraxin 3 (PTX3) is an inflammatory mediator acting as a fluid-phase pattern recognition molecule and playing an essential role in innate immunity and matrix remodeling. Inflammatory mediators also contribute to skeletal homeostasis, operating at multiple levels in physiological and pathological conditions. This study was designed to investigate the role of PTX3 in physiological skeletal remodeling and bone healing. Micro-computed tomography (μCT) and bone histomorphometry of distal femur showed that PTX3 gene-targeted female and male mice (ptx3-/- ) had lower trabecular bone volume than their wild-type (ptx3+/+ ) littermates (BV/TV by μCT: 3.50 ± 1.31 vs 6.09 ± 1.17 for females, p < 0.0001; BV/TV 9.06 ± 1.89 vs 10.47 ± 1.97 for males, p = 0.0435). In addition, μCT revealed lower trabecular bone volume in second lumbar vertebra of ptx3-/- mice. PTX3 was increasingly expressed during osteoblast maturation in vitro and was able to reverse the negative effect of fibroblast growth factor 2 (FGF2) on osteoblast differentiation. This effect was specific for the N-terminal domain of PTX3 that contains the FGF2-binding site. By using the closed transversal tibial fracture model, we found that ptx3-/- female mice formed significantly less mineralized callus during the anabolic phase following fracture injury compared to ptx3+/+ mice (BV/TV 17.05 ± 4.59 vs 20.47 ± 3.32, p = 0.0195). Non-hematopoietic periosteal cells highly upregulated PTX3 expression during the initial phase of fracture healing, particularly CD51+ and αSma+ osteoprogenitor subsets, and callus tissue exhibited concomitant expression of PTX3 and FGF2 around the fracture site. Thus, PTX3 supports maintenance of the bone mass possibly by inhibiting FGF2 and its negative impact on bone formation. Moreover, PTX3 enables timely occurring sequence of callus mineralization after bone fracture injury. These results indicate that PTX3 plays an important role in bone homeostasis and in proper matrix mineralization during fracture repair, a reflection of the function of this molecule in tissue homeostasis and repair.

Keywords: bone healing; bone turnover; fibroblast growth factor 2; inflammation; osteoblast; osteoclast; pentraxin 3.


Figures

Figure 1
Figure 1
Bone phenotype of the axial and appendicular skeleton in young adult ptx3+/+ and ptx3−/− mice. Female and male ptx3+/+ and ptx3−/− mice (10–12 weeks of age) were sacrificed, and the second lumbar vertebrae and distal femora were analyzed for trabecular bone parameters by micro-computed tomography (μCT). (A) Representative images of three-dimensional reconstruction of selected areas of the distal femur (left panel) and second lumbar vertebra (right panel). (B) Quantitative μCT analysis of trabecular bone volume (BV/TV, bone volume/total volume), trabecular number (Tb.N), trabecular thickness (Tb.Th), and trabecular separation (Tb.Sp) in the distal femoral metaphysis (left panel) and second lumbar vertebra (right panel). Cumulative data from three independent sets of experiments are shown (n = 18–20 mice per group). Dots represent individual mice, and horizontal lines and error bars are mean ± SD; statistically significant difference between corresponding ptx3+/+and ptx3−/− groups is marked on plots (*p < 0.05, **p < 0.001; unpaired Student’s t-test); ns, not significant.
Figure 2
Figure 2
In vitro osteoclastogenic and osteoblastogenic potential of ptx3+/+ and ptx3−/− mice. Bone marrow (BM) and spleen (SPL) cells were extracted from ptx3+/+ and ptx3−/− female and male mice (10–12 weeks of age) and plated in osteoclastogenic cultures (in the presence of RANKL and M-CSF), or BM and bone-associated cells (BACs) were plated in osteoblastogenic cultures [in the presence of ascorbic acid (AA) and β-GP]. Cells from two to three mice were pooled; four wells for osteoclasts and three wells for osteoblasts were done for each gender/genotype; three independent sets of experiments were performed. (A) Representative microphotographs of osteoclasts differentiated in vitro from the BM of ptx3+/+ and ptx3−/− mice, cytochemically stained for tartrate-resistant acid phosphatase (TRAP) activity (left panel). TRAP+ cells with three or more nuclei in cultures of BM and spleen from ptx3+/+ and ptx3−/− female and male mice were counted, and results are expressed as number of TRAP+ cells/well (right panel). (B) Representative microphotographs of osteoblasts differentiated in vitro from BM of ptx3+/+ and ptx3−/− mice, cytochemically stained for alkaline phosphatase (ALP) activity (left panel). ALP+ surface area in cultures of BM and BACs from ptx3+/+ and ptx3−/− female and male mice were measured, and results are expressed as percentage of ALP+ surface/well (right panel). Data from all performed experiments are shown (n = 12 wells per group for osteoclasts; n = 9 wells per group for osteoblasts). Each dot represents values from one culture well; horizontal lines and error bars are mean ± SD; no statistically significant difference between corresponding ptx3+/+and ptx3−/− groups was observed (unpaired Student’s t-test).
Figure 3
Figure 3
In vivo osteoclast and osteoblast activity in ptx3+/+ and ptx3−/− mice. Sections of distal femoral metaphysis from ptx3+/+ and ptx3−/− female and male mice (10–12 weeks of age) were histochemically stained for tartrate-resistant acid phosphatase (TRAP) activity. Goldner–Masson trichrome (GT) staining was used to visualize mineralized matrix (green) in serial sections of cortical and trabecular (TRB) compartments (size bar: 100 µm). Calcein (CALC) interlabel distance in distal femoral metaphysis from ptx3+/+ and ptx3−/− female and male mice were measured to estimate the rate of bone formation. (A) Representative microphotographs of active TRAP+ osteoclasts (OCL) adjacent to edosteal (END) and TRB bone surfaces (indicated by arrowheads) in ptx3+/+ mice (not shown for ptx3−/− mice). Quantification of END and TRB TRAP+ osteoclasts per bone perimeter (N.Oc./B.Pm) in ptx3+/+ and ptx3−/− female and male mice (n = 6–8 mice per group) is reported below. (B) Representative microphotographs of distal femoral metaphyseal sections from mice injected with calcein; interlabel distance visualized by fluorescent microscopy (indicated by arrowheads). Histomorphometric evaluation of endosteal bone formation rate (BFR) relative to bone surface area (BFR/BS) and TRB BFR relative to bone volume (BFR/BV) in ptx3+/+ and ptx3−/− female and male mice (n = 6–8 mice per group) is reported below. Dots represent individual mice, and horizontal lines and error bars are mean ± SD; statistically significant difference between corresponding ptx3+/+and ptx3−/− groups is marked on plots (*p < 0.05; unpaired Student’s t-test).
Figure 4
Figure 4
Evaluation of fracture callus tissue at 3 weeks postfracture in ptx3+/+ and ptx3−/− female mice. Stabilized closed transversal mid-tibial fracture model was applied in female ptx3+/+(n = 16) and ptx3−/− (n = 18) mice on B6 background (14–16 weeks of age). Assessment of callus tissue at 3 weeks postfracture was performed by micro-computed tomography (μCT) analysis, qPCR, and histology. (A) Representative microphotographs of three-dimensional reconstruction of tibial fractured areas and callus tissue sections of ptx3+/+ and ptx3−/− mice assessed by μCT. (B) Quantitative μCT analysis of mineralized callus bone volume (BV/TV, bone volume/total volume) of ptx3+/+ and ptx3−/− mice. Dots represent individual mice, and horizontal lines and error bars are mean ± SD (upper panel). qPCR assessment of bone-specific α2-chain of type I collagen (Col1) expression in ptx3+/+ and ptx3−/− mice. Values (n = 5 per group) are presented as mean ± SD (lower panel). Statistically significant difference between corresponding ptx3+/+and ptx3−/− groups is marked on plots (*p < 0.05; unpaired Student’s t-test). (C) Sections of mid-tibial callus area (indicated by arrow on μCT microphotograph) from ptx3+/+ and ptx3−/− female mice were stained immunohistochemically with an anti-PTX3 antibody. Goldner–Masson trichrome (GT) staining was used to visualize mineralized matrix (green) in callus compartment (size bar: 100 µm). In the selected area, PTX3+ cuboidal osteoblasts present during the anabolic stage of fracture healing are indicated by arrowheads.
Figure 5
Figure 5
Pentraxin 3 (PTX3) expression within the fractured areas at early postfracture days in ptx3+/+ female mice. A stabilized closed transversal mid-tibial fracture model was applied in female ptx3+/+ (n = 18) mice (14–16 weeks of age). Callus tissue was assessed at 2 (FRd2) and 6 (FRd6) days postfracture (indicated by arrow on micro-computed tomography). (A) Sections of mid-tibial unfractured bone (UNFR) and fracture area (FRd2 and FRd6) from ptx3+/+ female mice were stained immunohistochemically with an anti-PTX3 antibody. Numbers indicate median percentage of immunopositive area (immunopositive pixels/total pixels) with interquartile range analyzed by ImageJ software (n = 4 slides per group); statistically significant difference was observed for FRd6 compared to other groups (*p < 0.05; Kruskal–Wallis with Mann–Whitney post hoc test). Control (ctrl) stain was performed using the secondary antibody only. Goldner–Masson trichrome (GT) staining was used to visualize fractured site in mineralized bone cortex (green) (size bar: 100 µm). Selected areas are presented in higher magnification to better visualize PTX+ cells (indicated by arrowheads). (B) Representative microphotographs of the fractured areas with intensive endochondral ossification at day 6 postfracture. In the selected area, numerous hypertrophic PTX3+ chondrocytes are present during fracture healing.
Figure 6
Figure 6
Callus composition at early postfracture days in ptx3+/+ female mice. Stabilized closed transversal mid-tibial fracture model was applied in female ptx3+/+ mice (14–16 weeks of age). Assessment of callus tissue at 2 (FRd2) and 6 (FRd6) days postfracture was performed by flow cytometry and qPCR. Flow cytometric analysis and cell sorting of hematopoietic (CD45+Ter119+CD31+) and non-hematopoietic/non-endothelial (CD45Ter119CD31) subsets of callus cells were performed in unfractured tibial periosteal layer (UNFR) and fractured areas involving periosteal reaction (FRd2 and FRd6). (A) Percentage of hematopoietic (Hem+) and non-hematopoietic/non-endothelial (Hem) cells in callus tissue (left panel). qPCR analysis of PTX3 gene expression in total callus cell population and non-hematopoietic/non-endothelial (Hem) compartment of extracted cells (right panel). A total number of 12–16 mice per group were analyzed in 4 independent experiments. Values are shown as mean ± SD; statistically significant difference between corresponding total and Hem groups is marked on plots (*p < 0.001; unpaired Student’s t-test). (B) Hematopoietic compartment (CD45+Ter119+CD31+ subset) and non-hematopoietic/non-endothelial compartment (CD45Ter119CD31 subset) were separately analyzed for the expression of hematopoietic lineage markers (Ly6G, Ly6C, CD11b, B220, CD3) and osteoprogenitor cell markers (CD51, CD140b, CD105, αSma, Sca-1), respectively. (C) Expression of osteoblast-specific genes (Osx, ALP, BSP, Col1, OC) were assessed at early postfracture days in total callus tissue by qPCR and expressed as relative quantity compared to periosteal samples of unfractured bones (n = 4 per group). ALP, alkaline phosphatase; BSP, bone sialoprotein; Col1, α2-chain of type I collagen; OC, osteocalcin; Osx, osterix; PTX3, pentraxin 3; αSma, α-smooth muscle actin.
Figure 7
Figure 7
Role of PTX3 and FGF2 during in vitro differentiation of bone marrow cells from ptx3+/+ female mice. Bone marrow cells were extracted from ptx3+/+ female mice (10–12 weeks of age) and plated in OCL cultures (in the presence of RANKL and M-CSF) or OBL cultures (in the presence of AA and b-GP). Cells from two to three mice were pooled and three to four wells were done for each time point. (A) Expression of osteoblast-specific (Osx, ALP, OC) and osteoclast-specific (cFms, RANK, CalcR) genes were assessed during bone cell differentiation in parallel with the expression of PTX3 by qPCR. Mean ± SD from four independent experiments is reported. (B) Representative microphotographs of osteoblasts differentiated in vitro from bone marrow of ptx3+/+ female mice on B6 background, cytochemically stained for ALP. Osteoblast differentiation was evaluated by measurement of ALP+ surface area per well and expression of osteoblast-specific genes (Osx, Col1, BSP). Total colony surface was assessed by methylene blue staining. OBL cultures were treated with PTX3 (50 nM) or/and FGF2 (0.5 nM) in addition to AA and β-GP. (C) Osteoblast differentiation was evaluated by measurement of surface area covered by ALP+ osteoblast after treatment with either full-length PTX3, its N- or C-terminal domain (all used at 50 nM) in addition to FGF2 (0.25 nM or 0.5 nM). The experiments were repeated three times (n = 6–8 wells per group). Values are presented as mean ± SD; statistically significant difference between corresponding FGF2-treated groups is marked on plots (*p < 0.05; ANOVA with Student–Newman–Keuls post hoc test). (D) Expression of osteoblast-specific genes (Osx, Col1, BSP) in the presence of PTX3 (50 nM), FGF2 (0.25 nM), or a combination of PTX3 and FGF2. AA, ascorbic acid; ANOVA, analysis of variance; ALP, alkaline phosphatase; BSP, bone sialoprotein; CalcR, calcitonin receptor; cFms, colony-stimulating factor 1 receptor; Col1, α2-chain of type I collagen; OBL, osteoblast; OC, osteocalcin; OCL, osteoclast; Osx, osterix; PTX3, pentraxin 3; RANK, receptor activator of nuclear factor-κB.
Figure 8
Figure 8
Dissection of osteoprogenitor subpopulations within the fractured areas at early postfracture days in ptx3+/+ female mice. A stabilized closed transversal mid-tibial fracture model was applied in female ptx3+/+ mice (14–16 weeks of age). Callus tissue was assessed at 2 (FRd2) and 6 (FRd6) days postfracture by immunohistochemistry, flow cytometry, and qPCR. (A) Expression of PTX3, FGF2, osterix, and Runx2 was analyzed by immunohistochemistry on serial sections in unfractured tibial periosteal layer (UNFR) and mid-tibial fracture areas (FRd2 and FRd6) from ptx3+/+ female mice. Control stain (not shown) was performed using the secondary antibody only (size bar: 100 µm). Low-magnification images (far left panel, hematoxylin stained) is presented to show specimen orientation—intramedullary compartment comprising bone marrow (BM), bone cortex (BC), and, when applicable, fracture line (FL) and periosteal layer with callus tissue (P/C). Rectangles indicate area of interest shown at high magnification (size bar: 100 µm). Arrowheads indicate corresponding (positive) area on serial sections. (B) Flow cytometric analysis of PTX3+-positive subset within non-hematopoietic/non-endothelial (CD45Ter119CD31) population of cells in unfractured tibial periosteal layer (UNFR), periosteal layer of bones with inserted pin (PIN), and fractured areas involving periosteal reaction and callus tissue (FRd2 and FRd6). (C) Flow cytometric analysis of osteoprogenitor subsets expressing αSma, CD105, CD51, CD140b, or Sca-1 marker within PTX3+ population [shown in (B)] for female ptx3+/+ mice (n = 6–8 mice per group). (D) qPCR analysis of PTX3 and FGF2 gene expression in non-hematopoietic/non-endothelial (CD45Ter119CD31) compartment of cells extracted from unfractured tibial periosteal layer (UNFR), periosteal layer of bones with inserted pin (PIN), and mid-tibial fracture areas (FRd2 and FRd6) of female ptx3+/+ mice (n = 3–4 per group).

References

    1. Garlanda C, Bottazzi B, Magrini E, Inforzato A, Mantovani A. PTX3, a humoral pattern recognition molecule, in innate immunity, tissue repair and cancer. Physiol Rev (2017) 98(2):623–39.10.1152/physrev.00016.2017 - DOI - PMC - PubMed
    1. Inforzato A, Rivieccio V, Morreale AP, Bastone A, Salustri A, Scarchili L, et al. Structural characterization of PTX3 disulphide bond network and its multimeric status in cumulus matrix organization. J Biol Chem (2008) 283:10147–61.10.1074/jbc.M708535200 - DOI - PubMed
    1. Bottazzi B, Doni A, Garlanda C, Mantovani A. An integrated view of humoral innate immunity: pentraxins as a paradigm. Annu Rev Immunol (2010) 28:157–83.10.1146/annurev-immunol-030409-101305 - DOI - PubMed
    1. Daigo K, Inforzato A, Barajon I, Garlanda C, Bottazzi B, Meri S, et al. Pentraxins in the activation and regulation of innate immunity. Immunol Rev (2016) 274:202–17.10.1111/imr.12476 - DOI - PMC - PubMed
    1. Cunha C, Aversa F, Lacerda JF, Busca A, Kurzai O, Grube M, et al. Genetic PTX3 deficiency and aspergillosis in stem-cell transplantation. N Engl J Med (2014) 370:421–32.10.1056/NEJMoa1211161 - DOI - PubMed

Publication types

MeSH terms