. 2018 Feb 7;8(6):1540-1557.
doi: 10.7150/thno.22952. eCollection 2018.

The role of PTRF/Cavin1 as a biomarker in both glioma and serum exosomes

Affiliations

The role of PTRF/Cavin1 as a biomarker in both glioma and serum exosomes

Kai Huang et al. Theranostics. .

Abstract

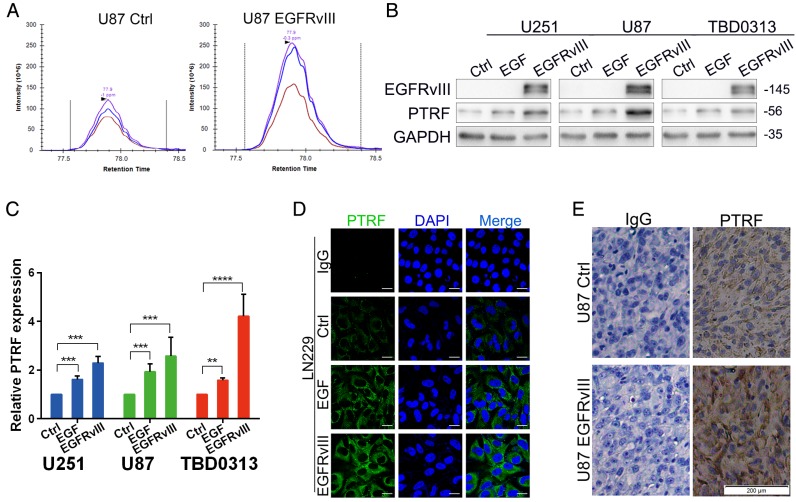
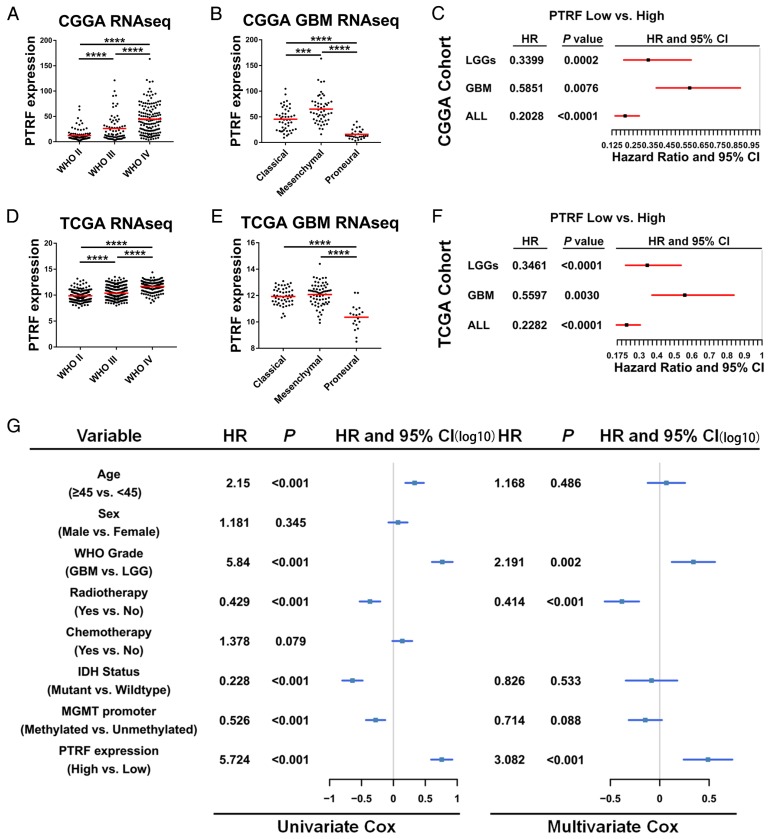
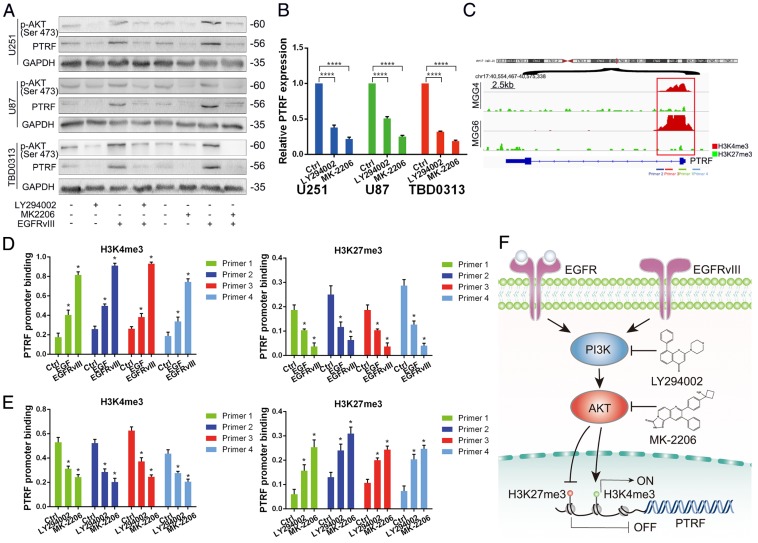
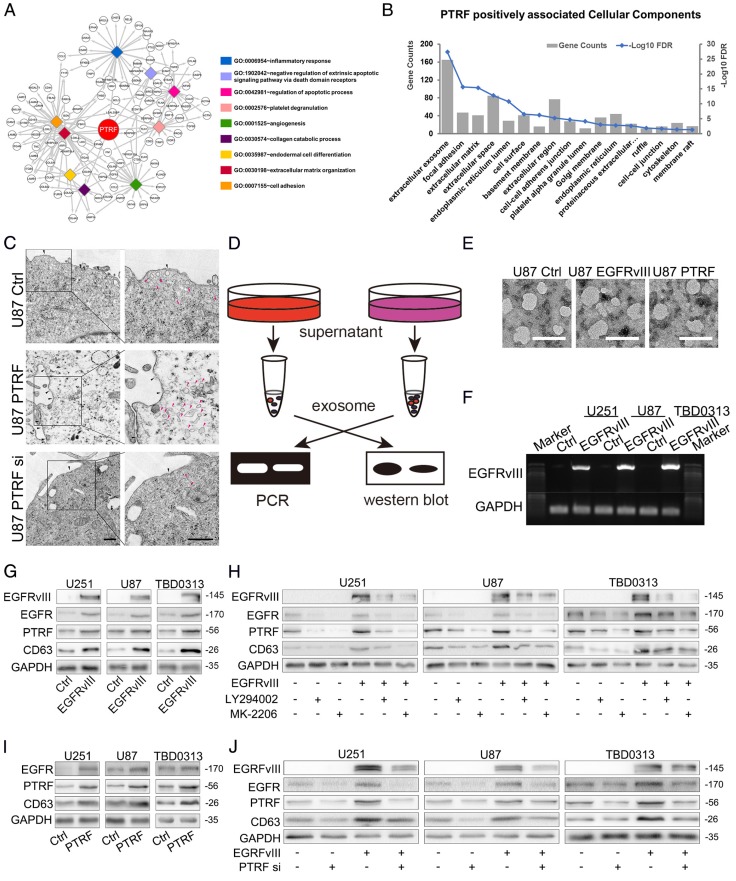
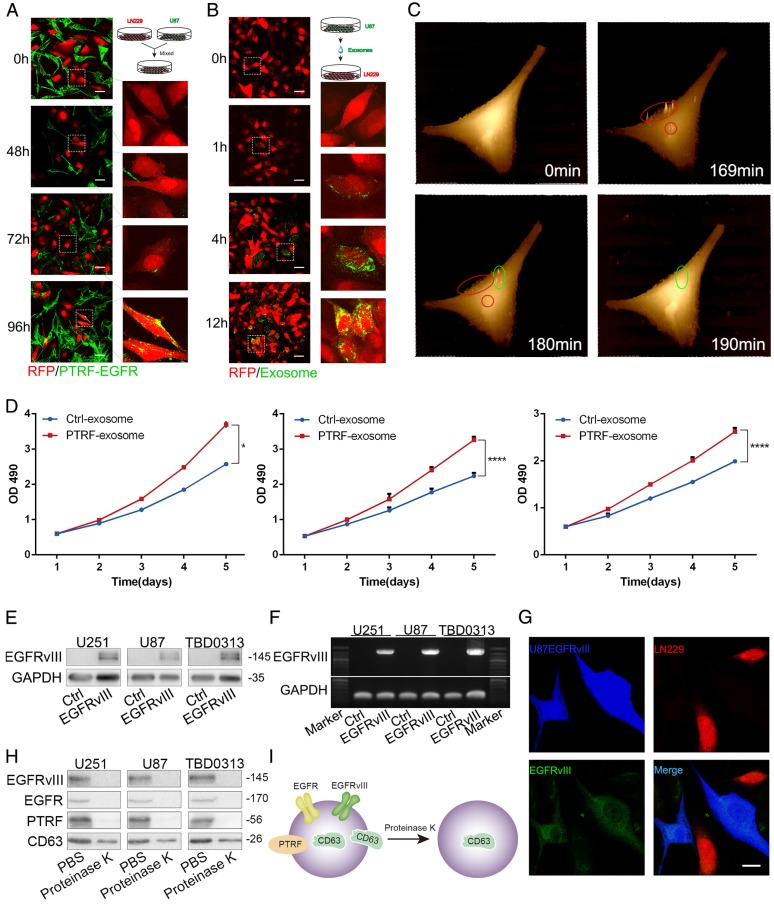
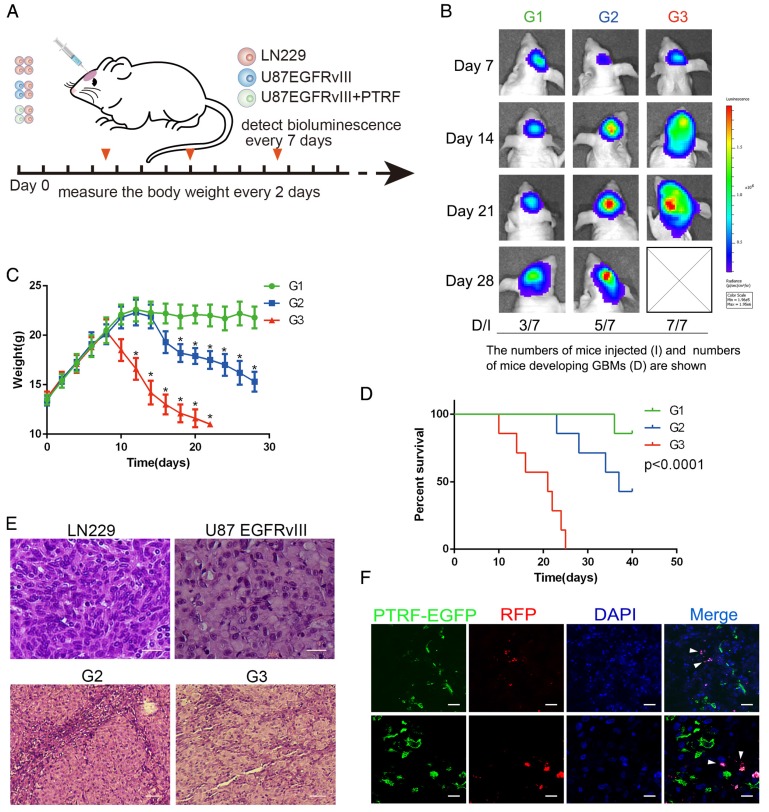
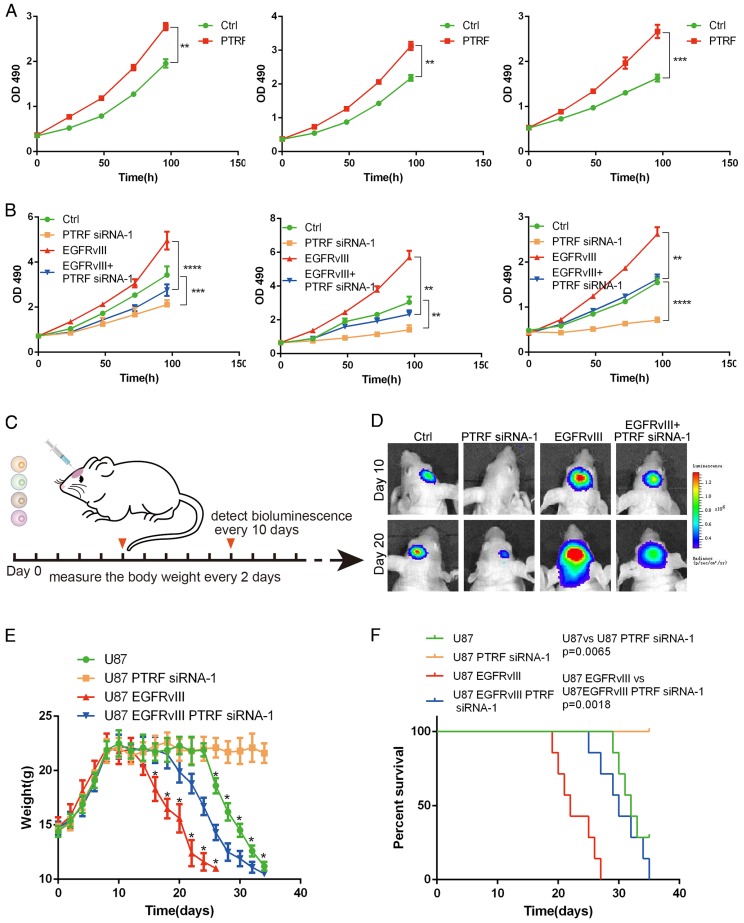
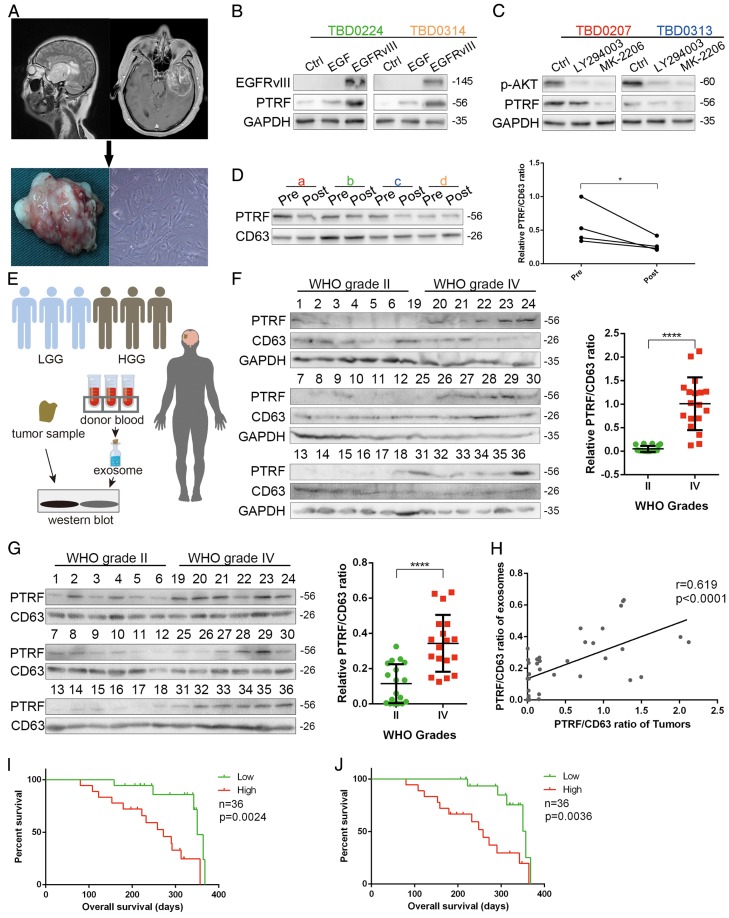
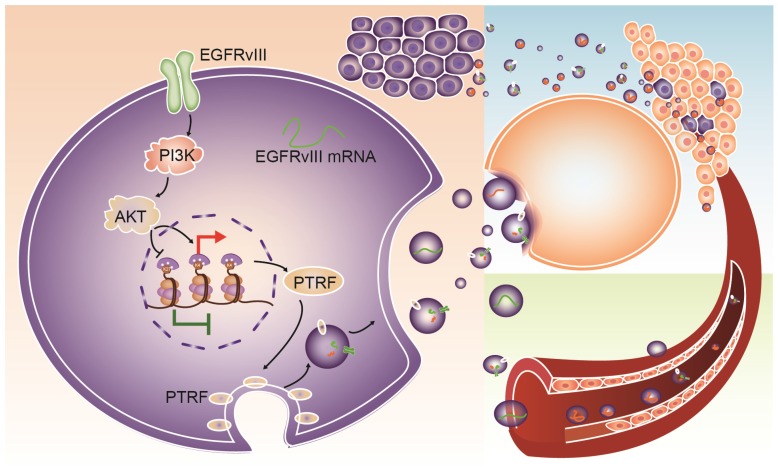
Exosomes play critical roles in intercellular communication in both nearby and distant cells in individuals and organs. Polymerase I and transcript release factor (PTRF), also known as Cavin1, has previously been described as a critical factor in caveola formation, and aberrant PTRF expression has been reported in various malignancies. However, the function of PTRF in tumor progression remains controversial, and its role in glioma is poorly understood. In this study, we report that PTRF is associated with malignancy grade and poor prognosis in glioma patients. Our previous study using two proteomics methods, tandem mass tag (TMT) and data-independent acquisition (DIA), showed that EGFRvIII overexpression increased PTRF expression at the protein level. In contrast, blocking PI3K and AKT using LY294002 and MK-2206, respectively, decreased PTRF expression, showing that PTRF is regulated in the EGFR/PI3K/AKT pathway. ChIP-PCR analysis showed that PTRF is transcriptionally regulated by the H3K4me3 and H3K27me3 modifications. Furthermore, PTRF overexpression increased exosome secretion and induced cell growth in vitro. More importantly, overexpressing PTRF induced the malignancy of nearby cells in vivo, suggesting that PTRF alters the microenvironment through intercellular communication via exosomes. Furthermore, analysis of clinical samples showed a positive correlation between tumor grade and PTRF expression in both tumor tissues and exosomes isolated from blood harvested from glioma patients, and PTRF expression in exosomes isolated from the sera of GBM patients was decreased after surgery. In conclusion, PTRF serves as a promising biomarker in both tumor samples and serum exosomes, thus facilitating the detection of glioma and potentially serving as a therapeutic target for glioblastoma multiforme.

Keywords: Extracellular vesicle; GBM; PTRF/Cavin1; exosome.


Conflict of interest statement

Competing Interests: The authors have declared that no competing interest exists.

Figures

Fig 1
Fig 1
PTRF expression is positively associated with EGFR and EGFRvIII. (A) After stably overexpressing EGFRvIII, DIA proteomic methods were used to evaluate total protein expression. Among these proteins, PTRF expression was increased. (B) GBM cell lines were either stimulated by EGF or transduced with EGFRvIII for 48 hours, and the expression of EGFRvIII, PTRF and GAPDH was evaluated by western blot. GAPDH served as the negative control. (C) RT-qPCR experiments were performed to detect PTRF mRNA expression. After EGF stimulation and EGFRvIII transduction, PTRF mRNA expression was gently increased. Error bars in the RT-qPCR results indicate the standard error of the mean. Significant differences in the experimental groups were compared with those of the control group (**P < 0.01, ***P<0.001, ****P<0.0001). (D) Confocal microscopy detected increased PTRF expression in LN229 cells stimulated by EGF or transduced with EGFRvIII. Scale bar: 20 μm. (E) Representative immunostaining results of PTRF in tumors from each group of nude mice. EGFRvIII increased PTRF expression in vivo. Scale bar: 200 μm.
Fig 2
Fig 2
PTRF is an independent biomarker in glioma diagnosis. (A and D) RNAseq data from the CGGA (A) and TCGA (D) cohorts were used to show PTRF expression levels in WHO II-IV gliomas. PTRF is positively associated with glioma WHO grades. (B and E) PTRF is enriched in patients with classical and mesenchymal GBM. (C and F) Kaplan-Meier curve showing that PTRF expression is associated with poor prognosis in glioma patients. (G) Cox proportional hazards regression analyses of PTRF expression and other characteristics in relation to overall survival in GBM from CGGA cohort.
Fig 3
Fig 3
PTRF is regulated by the H3K4me3 and H3K27me3 histone modifications in the EGFR/PI3K/AKT pathway. (A) Western blot showing that p-AKT and PTRF expression decreased with LY294002 and MK-2206 treatment. GAPDH served as the negative control. (B) qRT-PCR showing that the PTRF mRNA levels were decreased after treatment with LY294002 and MK-2206. (C) Using IGV, the PTRF promoter was enriched with H3K4me3 and H3K27me3 in glioma cell lines, but H3K4me3 binding was more important in the GSE46016 dataset. (D) ChIP-PCR assays showing that H3K4me3 exhibited increased binding to the PTRF promoter, while H3K27me3 exhibited decreased binding to the PTRF promoter after stimulation by EGF or transduction with EGFRvIII. (E) Chip-PCR assays showing that H3K4me3 exhibited decreased binding to the PTRF promoter, while H3K27me3 exhibited increased binding to the PTRF promoter after LY294002 and MK-2206 treatment. (F) Schematic illustration of the mechanism underlying PTRF regulation by the EGFRvIII/wt/PI3K/AKT pathway. Stimulation by EGF or transduction with EGFRvIII increased PTRF expression, while blocking PI3K and AKT decreased PTRF expression via the H3K4me3 and H3K27me3 modifications.
Fig 4
Fig 4
PTRF promotes exosome formation. (A) Genes from TCGA and CGGA cohorts positively correlated with PTRF expression were subjected to gene ontology (GO) analysis. The biological processes (BP) of these genes were mainly enriched in inflammatory response, regulation of apoptotic process, and most importantly, extracellular matrix organization. (B) The cellular components (CC) of these genes were mainly enriched in extracellular exosome. (C) Cultured cells were analyzed by transmission electron microscopy (TEM) scanning. U87 cells were treated by overexpression or knockdown of PTRF. Compare with control group, the numbers of caveolea and endocytic vesicles were both positively associated with PTRF expression. Black arrow head: caveolea, pink arrow head: endocytic vesicles, scale bar: 500nm. (D) Schematic overview of exosome detection. Exosomes were isolated from supernatants and subjected to PCR and western blot analysis. (E) Transmission electron microscopy was used to detect exosome products. Scale bar: 100 nm. (F) Exosomes were isolated from the supernatants of U87, U251 and TBD0313 cells transduced with vector or EGFRvIII. mRNA was then extracted, and PCR was performed. Electrophoresis was used to show that EGFRvIII mRNA can be detected in exosomes. (G) Western blot showing that exosome components, such as PTRF, EGFRvIII and EGFR, were increased after the transduction of EGFRvIII. (H) Western blot showing that PTRF, EGFRvIII and EGFR expression in exosomes was decreased after LY294002 and MK-2206 treatment. (I) Exosome components, such as PTRF and EGFR, were increased after the overexpression of PTRF, as determined by western blot. (J) Western blot showing that PTRF, EGFRvIII and EGFR expression in exosomes was decreased after PTRF silencing. For (G), (H), (I) and (J), GAPDH served as the negative control of the relative cell lysate levels.
Fig 5
Fig 5
PTRF induces intercellular communication via exosomes. (A) LN229 cells transduced with lenti-RFP and U87 cells transduced with PTRF-EGFP were mixed together for 0, 48, 72 or 96 hours. Confocal microscopy showed that PTRF-EGFP could be detected in LN229 cells. (B) Exosomes isolated from the supernatants of U87 cells transduced with PTRF-EGFP were added to LN229-RFP cells for 0, 1, 4 or 12 hours, and confocal microscopy showed that PTRF-EGFP was transferred to LN229 cells. The scale bars for (A) and (B) correspond to 50 μm. (C) LN229 cells were seeded in a 35-mm Petri dish and washed three times with L15 medium. Next, 2 ml of L15 medium was added to the Petri dish, and the cells were observed with a scanning ion conductive microscope (SICM). One photo was taken as the control, and 5 μg of exosomes isolated from U87 PTRF cell supernatants was then added. After continuously scanning for 4 hours, exosomes were determined to be absorbed by the cells within ten minutes (within the red and green circles). (D) LN229 cells were treated with equal amounts of exosomes isolated from the supernatants of U87, U251 and TBD0313 cells transduced with vector or PTRF. Compared with that of the control group, the proliferation rate of the PTRF group was increased. (E and F) Exosomes isolated from the supernatants of U87, U251 and TBD0313 cells transduced with vector or EGFRvIII were added to LN229 cells for 24 hours. Thereafter, proteins were extracted from the cells, and EGFRvIII was analyzed by western blot. Detection of the EGFRvIII protein showed its transfer to recipient cells (E). mRNA was extracted from the cells, and PCR was performed. Electrophoresis was used to show that EGFRvIII mRNA could be transferred to recipient cells (F). (G) LN229-RFP cells and U87EGFRvIII cells expressing EGFP were mixed together for 96 hours. A confocal assay staining for EGFRvIII showed that EGFRvIII was transferred to LN229 cells. Blue represents U87EGFRvIII cells, red represents LN229 cells and green represents stained EGFRvIII. The staining of U87 and LN229 mixing model was served as negative control which was seen in Fig. S5B. The scale bar corresponds to 20 μm. (H) Ten micrograms of exosomes isolated from the supernatants of U87, U251 and TBD0313 cells transduced with EGFRvIII were treated with 10 μl of proteinase K or PBS for 10 min. Western blot analysis showed that EGFRvIII, EGFR and PTRF were totally degraded, while CD63 was partly intact. (I) Cartoon showing EGFRvIII, EGFR and PTRF expression on exosome membranes and CD63 expression on both exosome membranes and inside exosomes.
Fig 6
Fig 6
PTRF overexpression increases exosome secretion in vivo. (A) Schematic representation of the mixed cell in vivo experiment. Mice were orthotopically injected with LN229 (G1), LN229+U87 EGFRvIII (G2) or LN229+EGFRvIII/PTRF (G3), and only LN229 cells were transduced with luciferase and RFP. Bioluminescence was detected every 7 days, and body weight was measured every other day. (B) Representative pseudocolor bioluminescence images of mice implanted with intracranial tumors on days 7, 14, 21 and 28. Tumors comprising LN229 cells were detected in 3/7, 5/7 and 7/7 mice of the G1, G2 and G3 groups, respectively. (C) Body weights of nude mice as measured every 2 days. (D) Kaplan-Meier curve showing that G3 mice had a shorter survival time than G1 and G2 mice. (E) H&E staining showed that LN229 cells grew more aggressively after being mixed with U87 EGFRvIII/PTRF. The scale bar corresponds to 50 μm (upper) and 20 μm (lower).(F) U87EGFRvIII/PTRF (green) and LN229 (red) cells were mixed before being orthotopically injected into mice, and tumor sections observed by confocal microscopy showed that PTRF-EGFP was transferred to LN229 cells (white arrow). The scale bars correspond to 50 μm (upper) and 20 μm (lower).
Fig 7
Fig 7
PTRF expression positively influences GBM cell proliferation in vivo and in vitro. (A) PTRF overexpression increased the proliferation rate of GBM cell lines in vitro. (B) Proliferation of GBM cell lines was inhibited after silencing PTRF. (C) Schematic representation of PTRF silencing in vivo. Bioluminescence was detected every 10 days, and mouse body weights were measured every other day. Mice were injected with U87, U87 PTRF RNAsi-1, U87EGFRvIII or U87EGFRvIII+PTRF siRNA-1. (D) Representative pseudocolor bioluminescence images of mice implanted with intracranial tumors on days 10 and 20. (E) Body weights of orthotopic nude mice were measured every 2 days. (F) Kaplan-Meier curve showing that mice with tumors transduced with PTRF siRNA-1 had better prognoses.
Fig 8
Fig 8
PTRF down-regulation is detectable after surgery. (A) Primary cell lines were isolated from four glioma patients and named TBD0207, TBD0224, TBD0313 and TBD0314. (B) TBD0224 and TBD0314 stimulated by recombinant EGF and transduced with EGFRvIII exhibited gradually increased PTRF expression, as determined by western blot. (C) p-AKT and PTRF expression was decreased significantly by PI3K and AKT inhibition by LY294002 and MK-2206, respectively, in the TBD0207 and TBD0313 cell lines. (D) Exosomes were isolated from sera of GBM patients before and after surgery. PTRF expression was down-regulated after surgery, as detected by western blot. CD63 was used as the negative control (left panel). Paired t-tests were used to analyze alterations of the PTRF/CD63 ratio (right panel, p<0.05, paired t-test) (E) Schematic illustration of clinical tumor samples and serum exosome detection. In total, 18 grade II and 18 grade IV glioma samples and their relative donated blood samples were analyzed. Total proteins from the tumor samples and exosomes extracted from the sera were lysed. Western blot was used to detect PTRF and CD63 expression. (F) PTRF and CD63 protein expression in 18 grade II and 18 grade IV glioma samples were detected by western blot (left panel). The PTRF/CD63 ratio was significantly higher in WHO grade IV glioma samples than in grade II glioma samples (right panel, p<0.0001, t-test). (G) Exosomes were isolated from sera of 18 grade II and 18 grade IV gliomas, and PTRF and CD63 protein expression was detected by western blot (left panel). The PTRF/CD63 ratio was significantly higher in WHO grade IV glioma samples than in grade II glioma samples (right panel, p<0.0001, t-test). For (B), (C), (D), (G) and (I), GAPDH served as the negative control. (H) The correlation between PTRF/CD63 ratios in tumor tissues and exosomes was analyzed. Each point denotes a tumor sample. Both ratios were positively related (r=0.619, p<0.0001). (I) The overall survival of 36 patients was evaluated according to their PTRF/CD63 ratio. The Kaplan-Meier survival curve showed that the PTRF/CD63 ratio was positively related to poor prognosis (p=0.0024). (J) The overall survival of 36 patients was evaluated according to their PTRF/CD63 ratio. The Kaplan-Meier survival curve showed that the PTRF/CD63 ratio was positively related to poor prognosis (p=0.0036).
Fig 9
Fig 9
Schematic mechanism for intercellular communication via exosomes. PTRF is a downstream effector of the EGFR/PI3K/AKT pathway via the H3K4me3 and H3K27me3 modifications. Exosomes from GBM cells delivered biological components, such as EGFRvIII, PTRF and EGFRvIII mRNA, to nearby cells and induced their malignancy. Exosomes could also be released into the blood and serve as a detectable biomarker.

References

    1. Cancer Genome Atlas Research N. Comprehensive genomic characterization defines human glioblastoma genes and core pathways. Nature. 2008;455:1061–8. - PMC - PubMed
    1. Brennan CW, Verhaak RG, McKenna A, Campos B, Noushmehr H, Salama SR. et al. The somatic genomic landscape of glioblastoma. Cell. 2013;155:462–77. - PMC - PubMed
    1. Wong AJ, Ruppert JM, Bigner SH, Grzeschik CH, Humphrey PA, Bigner DS. et al. Structural alterations of the epidermal growth factor receptor gene in human gliomas. Proc Natl Acad Sci U S A. 1992;89:2965–9. - PMC - PubMed
    1. Ekstrand AJ, James CD, Cavenee WK, Seliger B, Pettersson RF, Collins VP. Genes for epidermal growth factor receptor, transforming growth factor alpha, and epidermal growth factor and their expression in human gliomas in vivo. Cancer Res. 1991;51:2164–72. - PubMed
    1. Chu CT, Everiss KD, Wikstrand CJ, Batra SK, Kung HJ, Bigner DD. Receptor dimerization is not a factor in the signalling activity of a transforming variant epidermal growth factor receptor (EGFRvIII) The Biochemical journal. 1997;324( Pt 3):855–61. - PMC - PubMed

Publication types

MeSH terms