

Evaluation of the ethanol tolerance for wild and mutant Synechocystis strains by flow cytometry
- PMID: 29556479
- PMCID: PMC5856660
- DOI: 10.1016/j.btre.2018.02.005
Evaluation of the ethanol tolerance for wild and mutant Synechocystis strains by flow cytometry
Abstract
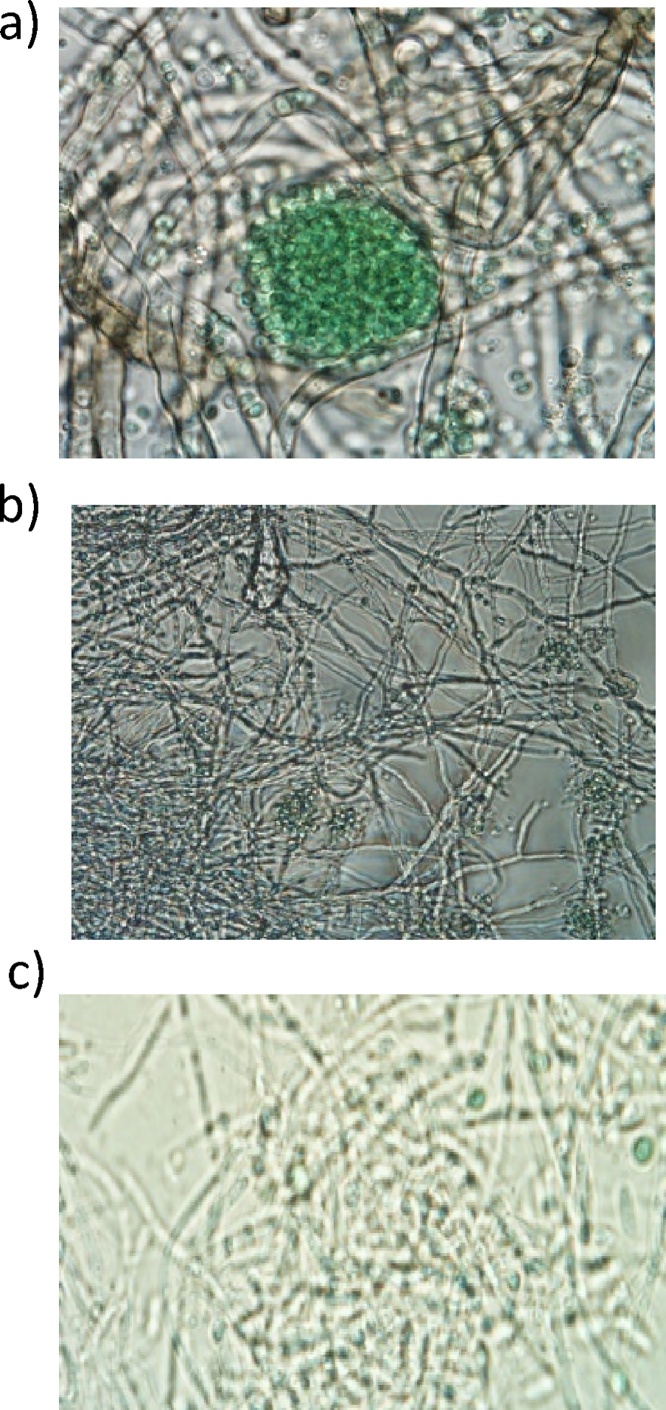
Flow cytometry was used to evaluate the effect of initial ethanol concentrations on cyanobacterial strains of Synechocystis PCC 6803 [wild-type (WT), and ethanol producing recombinants (UL 004 and UL 030)] in batch cultures. Ethanol recombinants, containing one or two metabolically engineered cassettes, were designed towards the development of an economically competitive process for the direct production of bioethanol from microalgae through an exclusive autotrophic route. It can be concluded that the recombinant Synechocystis UL 030 containing two copies of the genes per genome was the most tolerant to ethanol. Nevertheless, to implement a production process using recombinant strains, the bioethanol produced will be required to be continuously extracted from the culture media via a membrane-based technological process for example to prevent detrimental effects on the biomass. The results presented here are of significance in defining the maximum threshold for bulk ethanol concentration in production media.
Keywords: Enzymatic activity; Ethanol; Flow cytometry; Membrane permeability; Synechocystis wild and mutant strains; Tolerance.
Figures


Similar articles
-
Comparison of ethanol tolerance between potential cyanobacterial production hosts.J Biotechnol. 2018 Oct 10;283:140-145. doi: 10.1016/j.jbiotec.2018.07.034. Epub 2018 Jul 27. J Biotechnol. 2018. PMID: 30059699
-
Quantitative iTRAQ LC-MS/MS proteomics reveals metabolic responses to biofuel ethanol in cyanobacterial Synechocystis sp. PCC 6803.J Proteome Res. 2012 Nov 2;11(11):5286-300. doi: 10.1021/pr300504w. Epub 2012 Oct 23. J Proteome Res. 2012. PMID: 23062023
-
Identification of a transporter Slr0982 involved in ethanol tolerance in cyanobacterium Synechocystis sp. PCC 6803.Front Microbiol. 2015 May 18;6:487. doi: 10.3389/fmicb.2015.00487. eCollection 2015. Front Microbiol. 2015. PMID: 26052317 Free PMC article.
-
Development of yeast cell factories for consolidated bioprocessing of lignocellulose to bioethanol through cell surface engineering.Biotechnol Adv. 2012 Nov-Dec;30(6):1207-18. doi: 10.1016/j.biotechadv.2011.10.011. Epub 2011 Nov 4. Biotechnol Adv. 2012. PMID: 22085593 Review.
-
Comprehensive assessment of 2G bioethanol production.Bioresour Technol. 2020 Oct;313:123630. doi: 10.1016/j.biortech.2020.123630. Epub 2020 Jun 4. Bioresour Technol. 2020. PMID: 32561105 Review.
Cited by
-
Zymobacter palmae Pyruvate Decarboxylase is Less Effective Than That of Zymomonas mobilis for Ethanol Production in Metabolically Engineered Synechocystis sp. PCC6803.Microorganisms. 2019 Oct 27;7(11):494. doi: 10.3390/microorganisms7110494. Microorganisms. 2019. PMID: 31717863 Free PMC article.
-
Impact of the carbon flux regulator protein pirC on ethanol production in engineered cyanobacteria.Front Microbiol. 2023 Aug 15;14:1238737. doi: 10.3389/fmicb.2023.1238737. eCollection 2023. Front Microbiol. 2023. PMID: 37649635 Free PMC article.
-
Combinatorial use of environmental stresses and genetic engineering to increase ethanol titres in cyanobacteria.Biotechnol Biofuels. 2021 Dec 17;14(1):240. doi: 10.1186/s13068-021-02091-w. Biotechnol Biofuels. 2021. PMID: 34920731 Free PMC article. Review.
-
Novel Corrugated Long Period Grating Surface Balloon-Shaped Heterocore-Structured Plastic Optical Fibre Sensor for Microalgal Bioethanol Production.Sensors (Basel). 2023 Feb 2;23(3):1644. doi: 10.3390/s23031644. Sensors (Basel). 2023. PMID: 36772687 Free PMC article.
-
Understanding and engineering alcohol-tolerant bacteria using OMICS technology.World J Microbiol Biotechnol. 2018 Oct 19;34(11):157. doi: 10.1007/s11274-018-2542-4. World J Microbiol Biotechnol. 2018. PMID: 30341456 Free PMC article. Review.
References
-
- Cuellar-Bermudez S.P., Garcia-Perez J.S., Rittmann B.E. Photosynthetic bioenergy utilizing CO2: an approach on flue gases utilization for third generation biofuels. J. Clean. Prod. 2015;98:53–65.
-
- Charles C. International Institute for SustainableDevelopment; 2012. Should we be concerned about competition between food and fuel? Analysis of biofuel consumption mandates in the European Union and the United States.
-
- Weber C., Farwick A., Benish F., Boles E. Trends and challenges in the microbial production of lignocellulosic bioalcohol fuel. Appl. Microbiol. Biotechnol. 2010;87:1303–1315. - PubMed
-
- Gao Z., Zhao H., Li Z., Tan X., Lu X. Photosynthetic production of ethanol from carbon dioxide in genetically engineered cyanobacteria. Energy Environ. Sci. 2012;5:9857–9865.
-
- Dexter J., Fu P.C. Metabolic engineering of cyanobacteria for ethanol production. Energy Environ. Sci. 2009;2:857–864.
LinkOut - more resources
Full Text Sources
Other Literature Sources