

Assessment and prediction of road accident injuries trend using time-series models in Kurdistan
- PMID: 29556507
- PMCID: PMC5844126
- DOI: 10.1186/s41038-018-0111-6
Assessment and prediction of road accident injuries trend using time-series models in Kurdistan
Abstract
Background: Road traffic accidents are commonly encountered incidents that can cause high-intensity injuries to the victims and have direct impacts on the members of the society. Iran has one of the highest incident rates of road traffic accidents. The objective of this study was to model the patterns of road traffic accidents leading to injury in Kurdistan province, Iran.
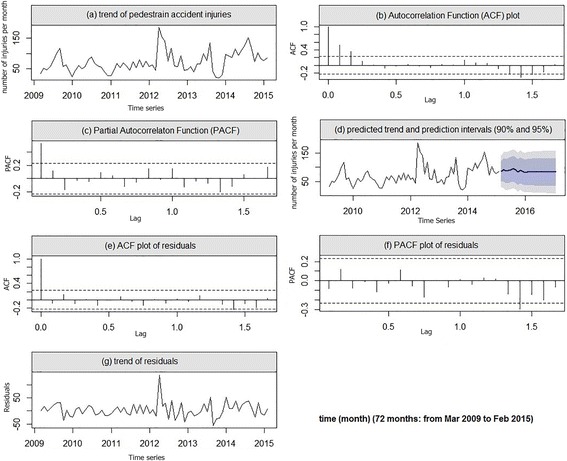
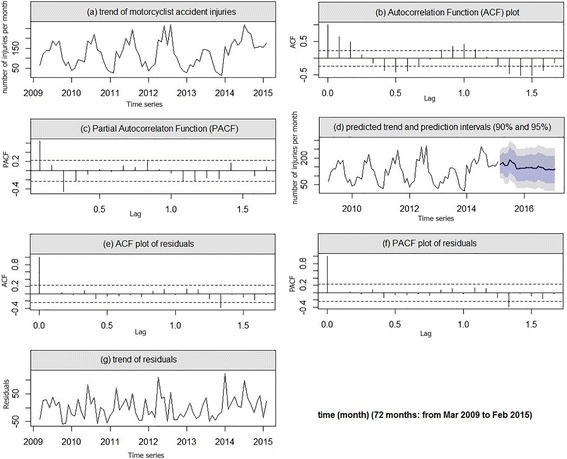
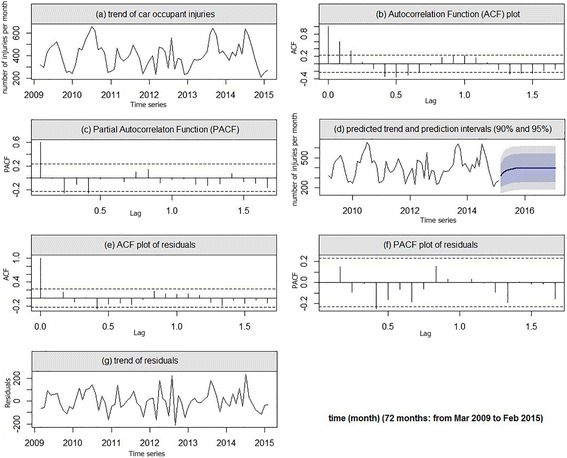
Methods: A time-series analysis was conducted to characterize and predict the frequency of road traffic accidents that lead to injury in Kurdistan province. The injuries were categorized into three separate groups which were related to the car occupants, motorcyclists and pedestrian road traffic accident injuries. The Box-Jenkins time-series analysis was used to model the injury observations applying autoregressive integrated moving average (ARIMA) and seasonal autoregressive integrated moving average (SARIMA) from March 2009 to February 2015 and to predict the accidents up to 24 months later (February 2017). The analysis was carried out using R-3.4.2 statistical software package.
Results: A total of 5199 pedestrians, 9015 motorcyclists, and 28,906 car occupants' accidents were observed. The mean (SD) number of car occupant, motorcyclist and pedestrian accident injuries observed were 401.01 (SD 32.78), 123.70 (SD 30.18) and 71.19 (SD 17.92) per year, respectively. The best models for the pattern of car occupant, motorcyclist, and pedestrian injuries were the ARIMA (1, 0, 0), SARIMA (1, 0, 2) (1, 0, 0)12, and SARIMA (1, 1, 1) (0, 0, 1)12, respectively. The motorcyclist and pedestrian injuries showed a seasonal pattern and the peak was during summer (August). The minimum frequency for the motorcyclist and pedestrian injuries were observed during the late autumn and early winter (December and January).
Conclusion: Our findings revealed that the observed motorcyclist and pedestrian injuries had a seasonal pattern that was explained by air temperature changes overtime. These findings call the need for close monitoring of the accidents during the high-risk periods in order to control and decrease the rate of the injuries.
Keywords: Prediction; Road accidents; Time-series models.
Conflict of interest statement
This study was approved by the ethics committee of Kurdistan University of Medical Sciences (IR.MUK. REC.1395.88).Not applicable.The authors declare that they have no competing interests.
Figures
References
-
- Hesari A, Esmaeli A. Estimates of deaths from traffic accidents on life expectancy at birth and the financial burden it (2002) Health Inf Manag. 2004;1(2):27–35.
-
- Marasy MR, Tabar IM. The burden of road traffic injuries in Isfahan, Iran in 2010. J Kerman Univ Med Sci. 2013;20(5):505–519.
-
- Yazdani CJ, Ahmadi BE, Ghadami M. Mapping of mortality rate in suburban accidents, Mazandaran Province, 2007-2010. J Mazandaran Univ Med Sci. 2012;22(97):50–58.
-
- Ghorbani A, Nabavi fard H, Khoshhal M, Hosseini H. Costs imposed on the effects of mortality due to traffic accidents (Sabzevar) Traffic Manag Stud. 2011;20:49–58.
-
- Ayatollahi SH, Hassanzadeh J, Ramezani A. The burden of traffic accidents in South Khorasan Province, Iran in 2005. Iran J Epidemiol. 2009;4(3):51–57.
LinkOut - more resources
Full Text Sources
Other Literature Sources
Miscellaneous
