

Phosphopeptidomics Reveals Differential Phosphorylation States and Novel SxE Phosphosite Motifs of Neuropeptides in Dense Core Secretory Vesicles
- PMID: 29556927
- PMCID: PMC5943185
- DOI: 10.1007/s13361-018-1915-0
Phosphopeptidomics Reveals Differential Phosphorylation States and Novel SxE Phosphosite Motifs of Neuropeptides in Dense Core Secretory Vesicles
Abstract
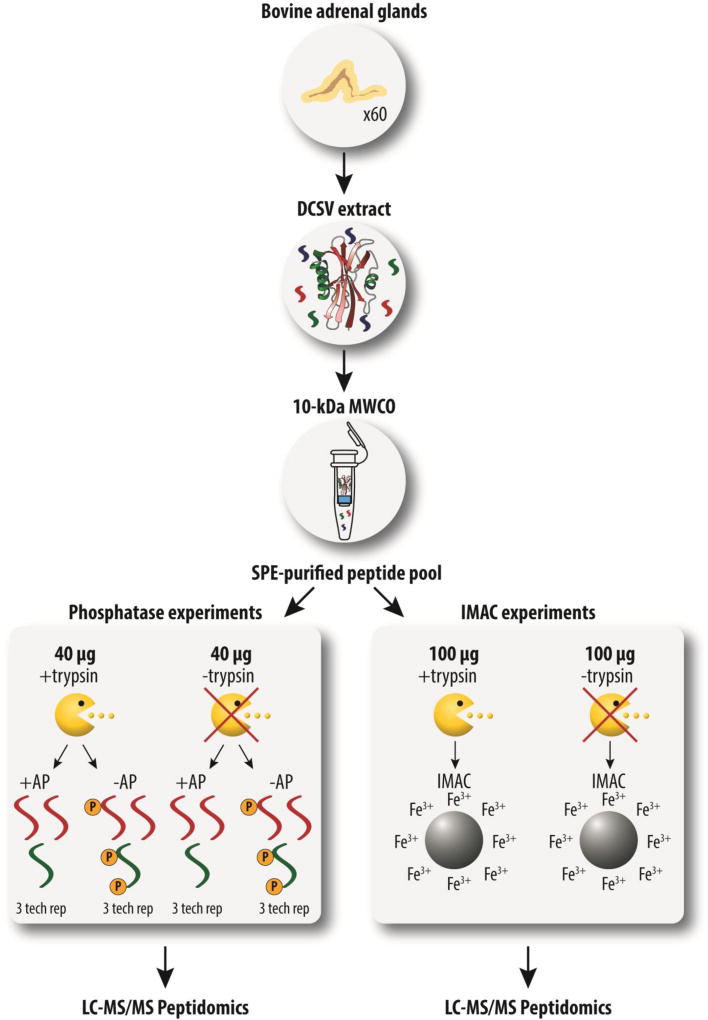
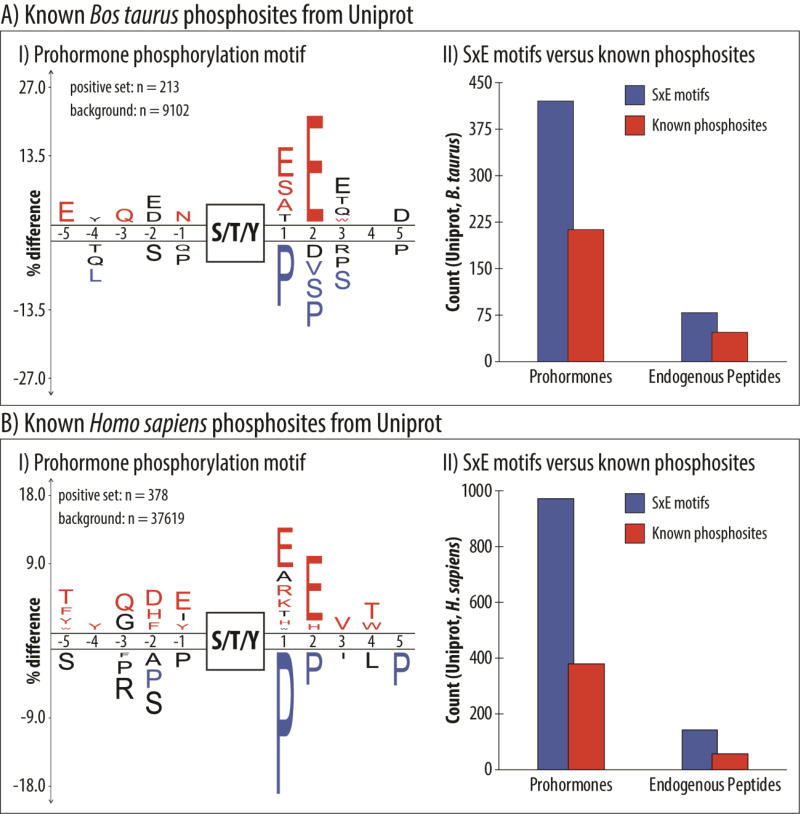
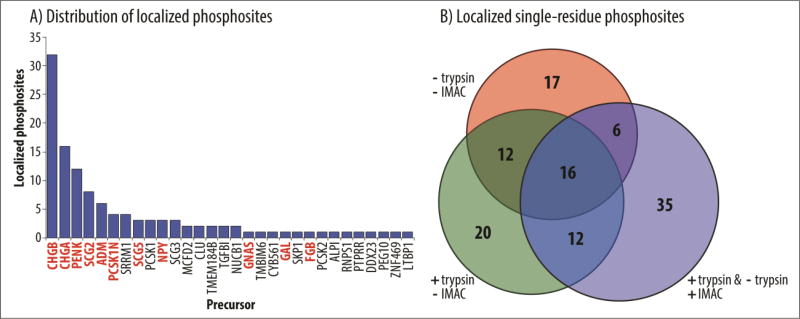
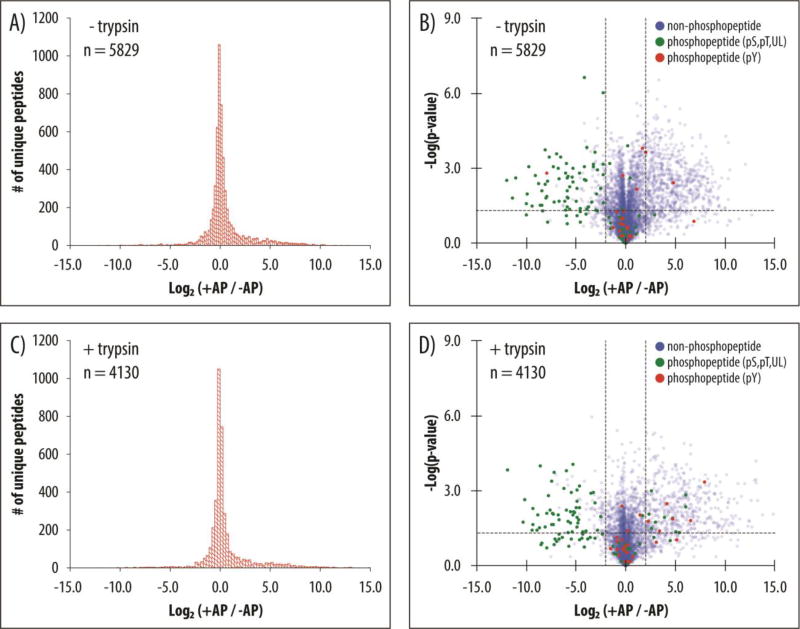
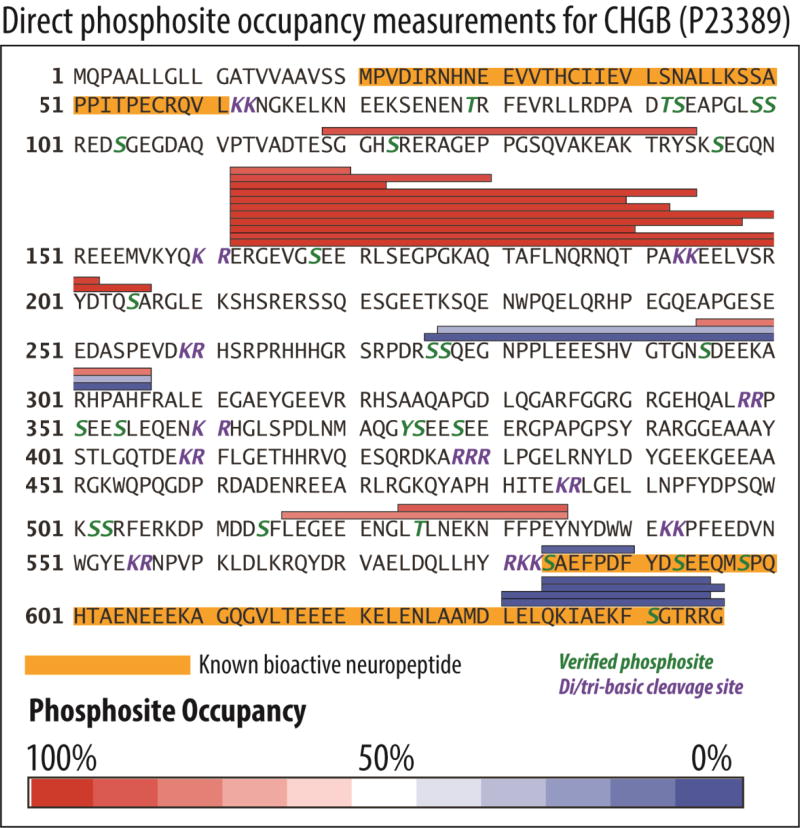
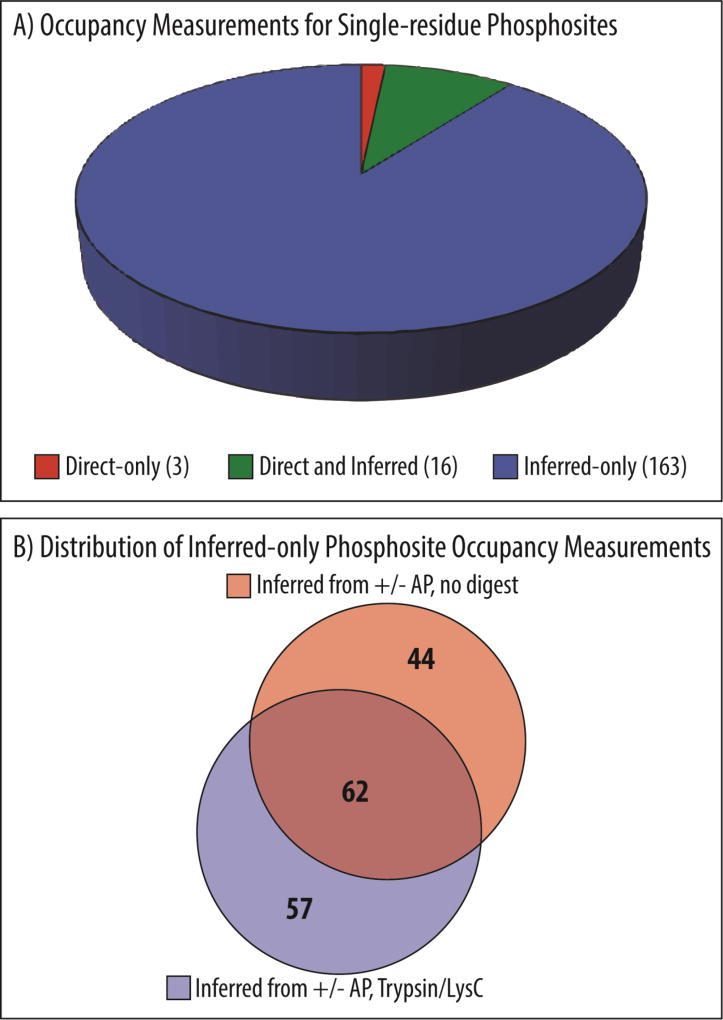
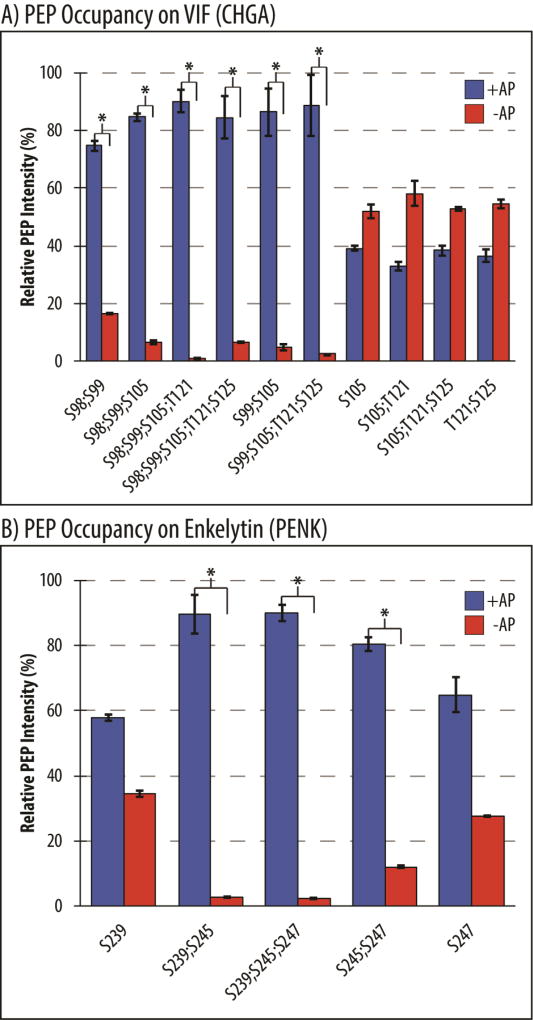
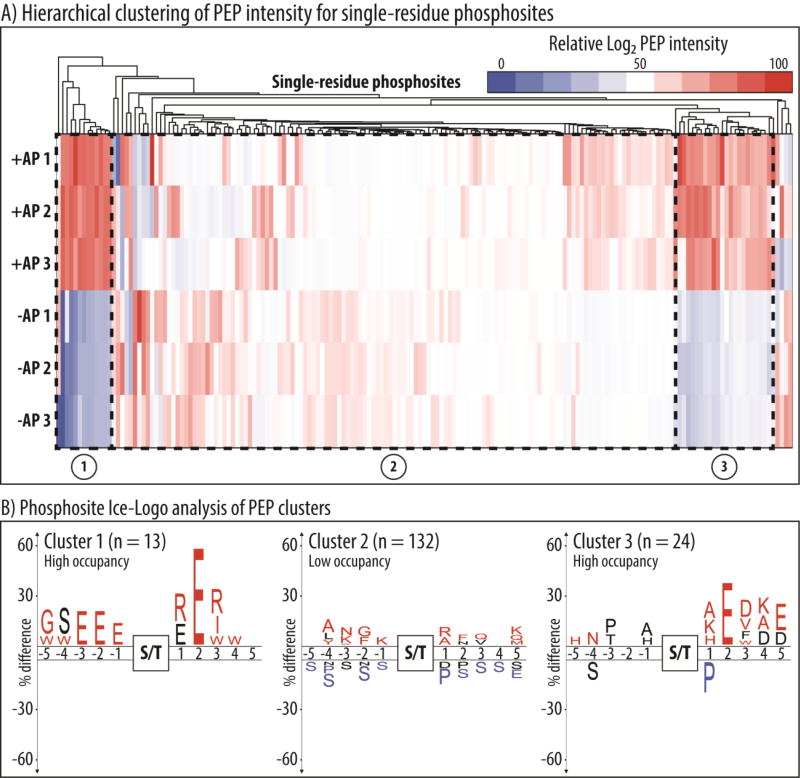
Neuropeptides are vital for cell-cell communication and function in the regulation of the nervous and endocrine systems. They are generated by post-translational modification (PTM) steps resulting in small active peptides generated from prohormone precursors. Phosphorylation is a significant PTM for the bioactivity of neuropeptides. From the known diversity of distinct neuropeptide functions, it is hypothesized that the extent of phosphorylation varies among different neuropeptides. To assess this hypothesis, neuropeptide-containing dense core secretory vesicles from bovine adrenal medullary chromaffin cells were subjected to global phosphopeptidomics analyses by liquid chromatography (LC)-mass spectrometry (MS/MS). Phosphopeptides were identified directly by LC-MS/MS and indirectly by phosphatase treatment followed by LC-MS/MS. The data identified numerous phosphorylated peptides derived from neuropeptide precursors such as chromogranins, secretogranins, proenkephalin and pro-NPY. Phosphosite occupancies were observed at high and low levels among identified peptides and many of the high occupancy phosphopeptides represent prohormone-derived peptides with currently unknown bioactivities. Peptide sequence analyses demonstrated SxE as the most prevalent phosphorylation site motif, corresponding to phosphorylation sites of the Fam20C protein kinase known to be present in the secretory pathway. The range of high to low phosphosite occupancies for neuropeptides demonstrates cellular regulation of neuropeptide phosphorylation. Graphical Abstract ᅟ.
Keywords: Adrenal medulla; Chromogranin; Fam20C; Neuroendocrine; Neuropeptide; Phosphatase; Phosphopeptidomics; Phosphosite; Phosphosite occupany; Post-translational modification (PTM); Proenkephalin; Prohormone; Secretogranin; Secretory vesicle; VIF.
Figures
Similar articles
-
Mass spectrometry-based neuropeptidomics of secretory vesicles from human adrenal medullary pheochromocytoma reveals novel peptide products of prohormone processing.J Proteome Res. 2010 Oct 1;9(10):5065-75. doi: 10.1021/pr100358b. J Proteome Res. 2010. PMID: 20704348 Free PMC article.
-
Diversity of Neuropeptide Cell-Cell Signaling Molecules Generated by Proteolytic Processing Revealed by Neuropeptidomics Mass Spectrometry.J Am Soc Mass Spectrom. 2018 May;29(5):807-816. doi: 10.1007/s13361-018-1914-1. Epub 2018 Apr 17. J Am Soc Mass Spectrom. 2018. PMID: 29667161 Free PMC article. Review.
-
Neuropeptidomics Mass Spectrometry Reveals Signaling Networks Generated by Distinct Protease Pathways in Human Systems.J Am Soc Mass Spectrom. 2015 Dec;26(12):1970-80. doi: 10.1007/s13361-015-1251-6. Epub 2015 Oct 19. J Am Soc Mass Spectrom. 2015. PMID: 26483184 Free PMC article. Review.
-
Endopin serpin protease inhibitors localize with neuropeptides in secretory vesicles and neuroendocrine tissues.Neuroendocrinology. 2009;89(2):210-6. doi: 10.1159/000162916. Epub 2008 Oct 8. Neuroendocrinology. 2009. PMID: 18840998 Free PMC article.
-
The novel role of cathepsin L for neuropeptide production illustrated by research strategies in chemical biology with protease gene knockout and expression.Methods Mol Biol. 2011;768:107-25. doi: 10.1007/978-1-61779-204-5_5. Methods Mol Biol. 2011. PMID: 21805239
Cited by
-
Quantitative Characterization of the Neuropeptide Level Changes in Dorsal Horn and Dorsal Root Ganglia Regions of the Murine Itch Models.J Proteome Res. 2020 Mar 6;19(3):1248-1257. doi: 10.1021/acs.jproteome.9b00758. Epub 2020 Feb 3. J Proteome Res. 2020. PMID: 31957451 Free PMC article.
-
FAM20C: A key protein kinase in multiple diseases.Genes Dis. 2023 Nov 23;12(2):101179. doi: 10.1016/j.gendis.2023.101179. eCollection 2025 Mar. Genes Dis. 2023. PMID: 39790934 Free PMC article. Review.
-
Neuropeptides and small-molecule amine transmitters: cooperative signaling in the nervous system.Cell Mol Life Sci. 2022 Aug 23;79(9):492. doi: 10.1007/s00018-022-04451-7. Cell Mol Life Sci. 2022. PMID: 35997826 Free PMC article. Review.
-
In-Depth Endogenous Phosphopeptidomics of Serum with Zirconium(IV)-Grafted Mesoporous Silica Enrichment.Anal Chem. 2024 May 28;96(21):8254-8262. doi: 10.1021/acs.analchem.3c02150. Epub 2024 May 10. Anal Chem. 2024. PMID: 38728223 Free PMC article.
-
An atlas of O-linked glycosylation on peptide hormones reveals diverse biological roles.Nat Commun. 2020 Aug 20;11(1):4033. doi: 10.1038/s41467-020-17473-1. Nat Commun. 2020. PMID: 32820167 Free PMC article.
References
-
- Frederickson RC. Enkephalin pentapeptides--a review of current evidence for a physiological role in vertebrate neurotransmission. Life Sci. 1977;21:23–42. - PubMed
-
- Hallberg M. Neuropeptides: metabolism to bioactive fragments and the pharmacology of their receptors. Med Res Rev. 2015;35:464–519. - PubMed
-
- Salem S, Jankowski V, Asare Y, Liehn E, Welker P, Raya-Bermudez A, Pineda-Martos C, Rodriguez M, Muñoz-Castañeda JR, Bruck H, Marx N, Machado FB, Staudt M, Heinze G, Zidek W, Jankowski J. Identification of the "Vasoconstriction Inhibiting Factor" (VIF), a Potent Endogenous Cofactor of Angiotensin II Acting on the AT2 Receptor. Circulation, CIRCULATIONAHA. 2015:114.013168. - PubMed
MeSH terms
Substances
Grants and funding
LinkOut - more resources
Full Text Sources
Other Literature Sources
Miscellaneous
