. 2018 Apr 23;10(4):194-206.
doi: 10.1039/C8IB00004B.

Shear dependent red blood cell adhesion in microscale flow

Affiliations

Shear dependent red blood cell adhesion in microscale flow

Erdem Kucukal et al. Integr Biol (Camb). .

Abstract

Non-adherence and deformability are the key intrinsic biomechanical features of the red blood cell (RBC), which allow it to tightly squeeze and pass through even the narrowest of microcirculatory networks. Blockage of microcirculatory flow, also known as vaso-occlusion, is a consequence of abnormal cellular adhesion to the vascular endothelium. In sickle cell disease (SCD), an inherited anaemia, even though RBCs have been shown to be heterogeneous in adhesiveness and deformability, this has not been studied in the context of physiologically relevant dynamic shear gradients at the microscale. We developed a microfluidic system that simulates physiologically relevant shear gradients of microcirculatory blood flow at a constant single volumetric flow rate. Using this system, shear dependent adhesion of RBCs from 28 subjects with SCD and from 11 healthy subjects was investigated using vascular endothelial protein functionalized microchannels. We defined a new term, RBC Shear Gradient Microfluidic Adhesion (SiGMA) index to assess shear dependent RBC adhesion in a subject-specific manner. We have shown for the first time that shear dependent adhesion of RBCs is heterogeneous in a microfluidic flow model, which correlates clinically with inflammatory markers and iron overload in subjects with SCD. This study reveals the complex dynamic interactions between RBC-mediated microcirculatory occlusion and clinical outcomes in SCD. These interactions may also be relevant to other microcirculatory disorders and microvascular diseases.


Figures

Figure 1.
Figure 1.. The shear gradient microfluidic system.
Shown is: (A) A schematic representation of the human microcirculatory system, with characteristic shear rates determined by the vessel geometry and local flow conditions. (B) The shear gradient channel, in which a shear gradient is formed at a single flow rate. (C) The assembled shear gradient microchannel is shown. Dimensions are in millimeters, and arrows indicate flow dimension.
Figure 2.
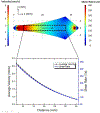
Figure 2.. Flow velocity and shear rate contours on a 2D plane 5 μm above the bottom surface.
Shown is the region of interest (ROI, dashed line) in which the data analyses were performed. As shown graphically, there is a 3-fold reduction in average velocity and shear rate through the defined ROI. Arrow indicates flow direction.
Figure 3.
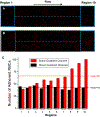
Figure 3.. Shear gradient adhesion of RBCs.
Shown is (A) HbSS RBCs after passage through a shear constant microchannel, with little variation in adhesion seen across the ROI. (B) Adherent cells across the shear gradient microchannel, in which adhesion increases with decreasing shear rates. (C) Quantification of adherent HbSS RBCs across shear constant - shear gradient microchannels. The overall difference between the means was more than 50% (p=0.002, one-way ANOVA). Blue rectangles in (A) and (B) represent the individual sub-regions.
Figure 4.
Figure 4.. The average shear dependent adhesion curves for subjects with HBAA (n=6) and HbSS (n=20) in LN functionalized microchannels.
Adhesion of HbSS RBCs declines with increasing shear rates whereas HbAA-containing RBCs do not exhibit significant shear-dependent adhesion with very low overall adhesion numbers. The shaded areas represent ±standard error of the mean (SEM).
Figure 5.
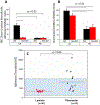
Figure 5.. Sample distribution of adherent deformable and non-deformable cell numbers in LN and FN functionalized microchannels across shear gradient channel.
Shown are linear fitted curves (dashed lines) and the corresponding equations used to quantify shear dependent adhesion data in LN (A) and FN (B) functionalized channels, such as the slope, from a single subject. The microchannel images are shown at top left corners to illustrate direction of the flow. Appearance of deformable and non-deformable RBCs are illustrated for each adhesion type. Scale bars are 5 μm.
Figure 6.
Figure 6.
Parameters defined to quantify shear dependent RBC adhesion. The data points are obtained from a single subject and represent the total RBC adhesion to LN. The dashed line is fitted through linear regression and extended above the maximum shear rate used in the study (~310 s−1) to determine the predicted shear value above which adhesion took place, which was defined as “adhesion threshold”. Normalized RBC shear gradient microfluidic adhesion (nSiGMA) index was calculated in the same fashion as SiGMA index, with the difference being the slope was determined based on normalized RBC adhesion numbers. The shaded region encompasses the typical physiological shear rate range for post capillary venules.
Figure 7.
Figure 7.. Shear dependent deformable and non-deformable HbSS RBC adhesion to LN & FN is heterogeneous.
Shown are calculated RBC SiGMA indices (absolute slope) for (A) raw data and (B) normalized data for deformable and non-deformable RBC adhesion in LN and FN functionalized microchannels. (C) Shown is the calculated “adhesion threshold” where cells are projected to no longer adhere. The blue dashed line represents a typical range of post-capillary shear rates between 112 s−1 and 952 s−1. The horizontal bracket lines between the individual groups show statistically significant difference based on a one-way ANOVA test with Tukey’s post-hoc test for multiple comparisons (p<0.01).
Figure 8.
Figure 8.
Shear dependent adhesion of HbSS RBCs to LN and clinical parameters. Shear dependent adhesion was lower (nSiGMA) in subjects with (A) an elevated white blood cell (WBC) count, (B) an elevated absolute netutrophil count (ANC), and (C) Ferritin. The dashed regions show the typical ranges in healthy individuals. The horizontal bracket lines between the two groups represent statistically significant difference based on a one-way ANOVA test with Tukey’s post-hoc test for multiple comparisons. The total number of subjects was 10 for each group.

References

    1. Herrick JB, The Yale journal of biology and medicine, 2001, 74, 179–184. - PMC - PubMed
    1. Rees DC, Williams TN and Gladwin MT, Lancet, 2010, 376, 2018–2031. - PubMed
    1. Wood DK, Soriano A, Mahadevan L, Higgins JM and Bhatia SN, Science translational medicine, 2012, 4, 123ra126. - PMC - PubMed
    1. Kuypers FA, Hematology/oncology clinics of North America, 2014, 28, 155–179. - PubMed
    1. Hebbel RP, Blood, 1991, 77, 214–237. - PubMed

Publication types

LinkOut - more resources