

doi: 10.1164/rccm.201802-0227LE.
Training for Lung Ultrasound Score Measurement in Critically Ill Patients
Collaborators,
Affiliations
- PMID: 29557671
- PMCID: PMC7205011
- DOI: 10.1164/rccm.201802-0227LE
Item in Clipboard
Training for Lung Ultrasound Score Measurement in Critically Ill Patients
Am J Respir Crit Care Med.
.
No abstract available
Figures
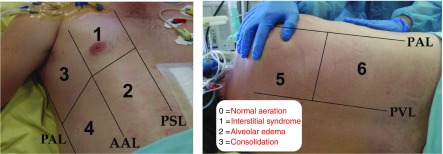
Lung ultrasound score (LUS) assessment. Six lung regions of interest (numbered in the figure), delineated by a parasternal line, anterior axillary line, posterior axillary line, and paravertebral line, are examined on each side. Each lung region is carefully examined in the longitudinal plane, and each intercostal space present in the region is examined in the transversal plane. The worst ultrasound pattern characterizes the region (regional LUS) using the following grading: 0 = normal aeration; 1 = moderate loss of aeration (interstitial syndrome, defined by multiple spaced B lines, or localized pulmonary edema, defined by coalescent B lines in less than 50% of the intercostal space examined in the transversal plane, or subpleural consolidations); 2 = severe loss of aeration (alveolar edema, defined by diffused coalescent B lines occupying the whole intercostal space); and 3 = complete loss of lung aeration (lung consolidation defined as a tissue pattern with or without air bronchogram). The LUS is calculated as the sum of the 12 regional scores. AAL = anterior axillary line; PAL = posterior axillary line; PSL = parasternal line; PVL = paravertebral line.
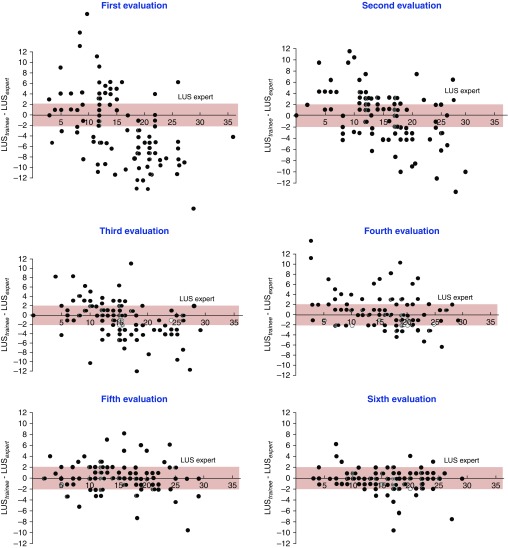
Difference between lung ultrasound scores (LUSs) measured by trainees and experts over six successive evaluations. The first evaluation was performed 2 hours after a lecture describing the method for measuring the LUS. Further evaluations were each separated by five ultrasound examinations performed by the trainee and supervised by the expert. The pink zone indicates the limit of agreement between trainees and experts.
References
-
- Volpicelli G, Elbarbary M, Blaivas M, Lichtenstein DA, Mathis G, Kirkpatrick AW, et al. International Liaison Committee on Lung Ultrasound (ILC-LUS) for International Consensus Conference on Lung Ultrasound (ICC-LUS). International evidence-based recommendations for point-of-care lung ultrasound. Intensive Care Med. 2012;38:577–591. - PubMed
-
- Bellani G, Rouby JJ, Constantin JM, Pesenti A. Looking closer at acute respiratory distress syndrome: the role of advanced imaging techniques. Curr Opin Crit Care. 2017;23:30–37. - PubMed
-
- Soummer A, Perbet S, Brisson H, Arbelot C, Constantin JM, Lu Q, et al. Lung Ultrasound Study Group. Ultrasound assessment of lung aeration loss during a successful weaning trial predicts postextubation distress. Crit Care Med. 2012;40:2064–2072. - PubMed
-
- Monastesse A, Girard F, Massicotte N, Chartrand-Lefebvre C, Girard M. Lung ultrasonography for the assessment of perioperative atelectasis: a pilot feasibility study. Anesth Analg. 2017;124:494–504. - PubMed
Publication types
LinkOut - more resources
Full Text Sources
Other Literature Sources
Medical
