. 2018 Apr 20;63(8):085019.
doi: 10.1088/1361-6560/aab83b.

Signal intensity analysis and optimization for in vivo imaging of Cherenkov and excited luminescence

Affiliations

Signal intensity analysis and optimization for in vivo imaging of Cherenkov and excited luminescence

Ethan P M LaRochelle et al. Phys Med Biol. .

Abstract

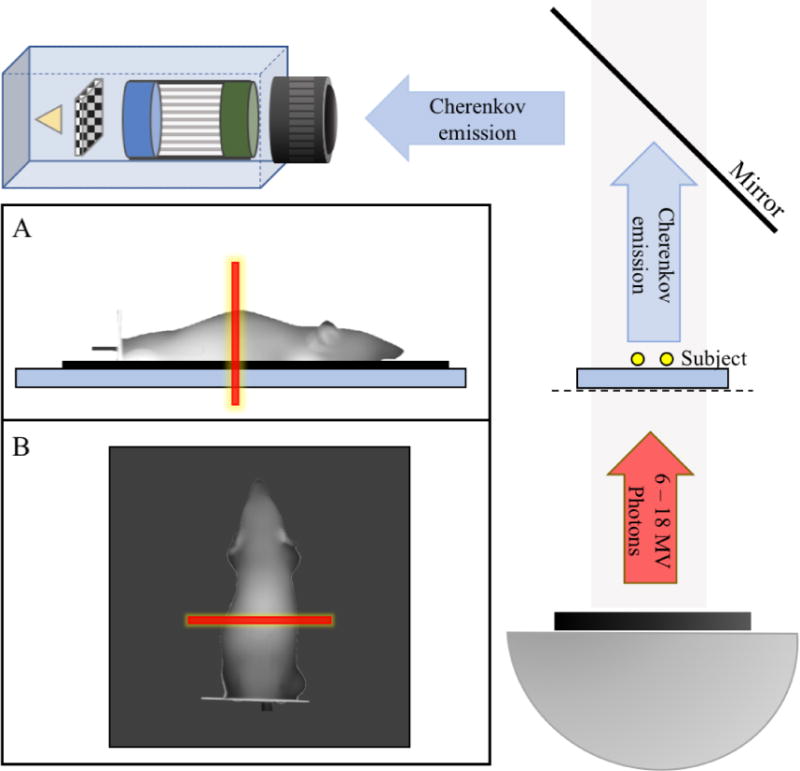
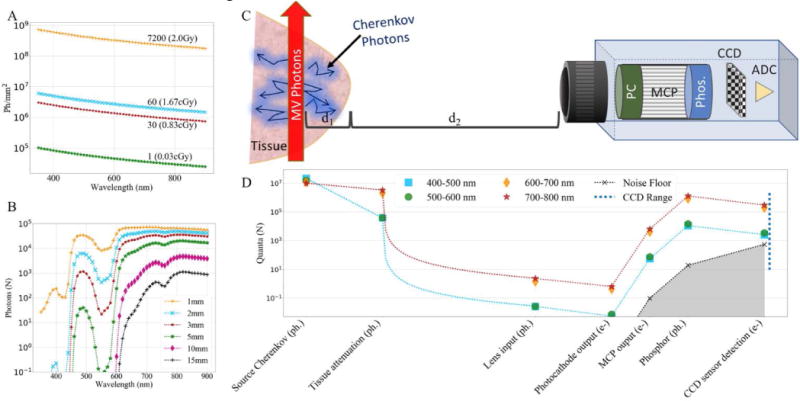
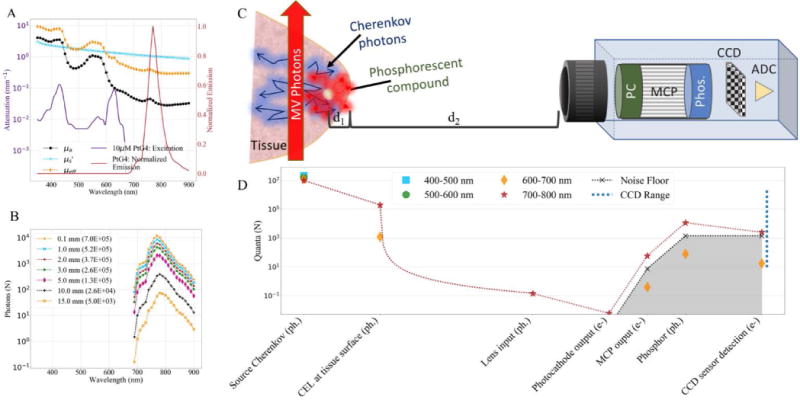
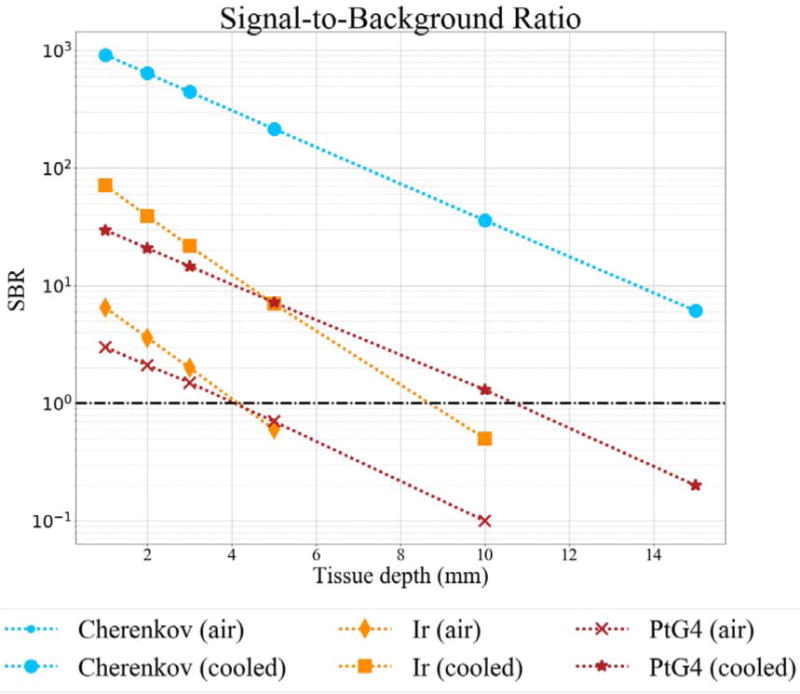
During external beam radiotherapy (EBRT), in vivo Cherenkov optical emissions can be used as a dosimetry tool or to excite luminescence, termed Cherenkov-excited luminescence (CEL) with microsecond-level time-gated cameras. The goal of this work was to develop a complete theoretical foundation for the detectable signal strength, in order to provide guidance on optimization of the limits of detection and how to optimize near real time imaging. The key parameters affecting photon production, propagation and detection were considered and experimental validation with both tissue phantoms and a murine model are shown. Both the theoretical analysis and experimental data indicate that the detection level is near a single photon-per-pixel for the detection geometry and frame rates commonly used, with the strongest factor being the signal decrease with the square of distance from tissue to camera. Experimental data demonstrates how the SNR improves with increasing integration time, but only up to the point where the dominance of camera read noise is overcome by stray photon noise that cannot be suppressed. For the current camera in a fixed geometry, the signal to background ratio limits the detection of light signals, and the observed in vivo Cherenkov emission is on the order of 100× stronger than CEL signals. As a result, imaging signals from depths <15 mm is reasonable for Cherenkov light, and depths <3 mm is reasonable for CEL imaging. The current investigation modeled Cherenkov and CEL imaging of two oxygen sensing phosphorescent compounds, but the modularity of the code allows for easy comparison of different agents or alternative cameras, geometries or tissues.


Figures

Figure 1
Figure 1
Geometry of the imaging system used for experimental validation. The LINAC gantry head is placed below the subject, providing a source of high energy photons. The subject is placed on the treatment couch with a mirror above to redirect photons towards the camera. (A) Side-view representation of the mouse phantom showing the radiation sheet in red. The mouse is placed on a 0.5–1.0cm thick water phantom to account for the buildup region of the radiation dose. (B) Top-view or camera-view representation of the mouse as seen by the ICCD with the radiation sheet superimposed.
Figure 2
Figure 2
(A) Cherenkov photons produced in 1 mm2 as the result of: a single radiation pulse (0.03cGy), 30 pulses (0.83cGy), 60 pulses (1.67cGy), and 7200 pulses (2Gy). (B) Cherenkov photon attenuation of 30 pulses (0.83cGy) observed at the tissue surface for photons emitted at various depths (d1). (C) Schematic depicting imaging system and components of interest. (D) Photon budget for a Cherenkov source at 3mm below the tissue surface (d1) generated by a 0.83cGy dose, as detected by a 2×2 binned-pixel. The blue dotted line at right represents the usable dynamic range of the sensor.
Figure 3
Figure 3
(A) Approximate tissue attenuation coefficients overlaid with extinction coefficient for 10μM PtG4 (left y-axis), and corresponding normalized emission spectrum (right y-axis). (B) Simulated photon count of CEL caused by 0.83cGy dose for a PtG4 source at various depths (d1) within tissue. (C) Schematic depicting imaging system and components of interest. (D) Photon budget for PtG4 CEL source at 3mm below the tissue surface (d1) generated by a 0.83cGy dose, as detected by a 2×2 binned-pixel. The blue dotted line at right represents the usable dynamic range of the sensor.
Figure 4
Figure 4
Theoretical Signal-to-Background ratio for Cherenkov and CEL detection with a photocathode room temperature, and cooled with dry nitrogen. Cherenkov values are the same.
Figure 5
Figure 5
Cherenkov image frames of a mouse phantom captured with varying numbers of accumulations on chip (AOC).
Figure 6
Figure 6
(A) Cherenkov image frame of a mouse phantom captured using 2 accumulations on chip; (B) Normalized histogram of intensity count for region of image receiving radiation dose (inside white area in (A)); (C) Normalized histogram of intensity count for background area around mouse phantom (outside green area in (A)); (D) Median pixel intensity of previously defined regions for different AOCs, where error bars show standard deviation of pixel intensities in region; (E) Signal-to-background ratio and signal to noise ratio for varying AOCs
Figure 7
Figure 7
(A) Room-light image of mouse with two flank tumors injected with PtG4. (B) Single Cherenkov frame of interest during scanned imaging. (C) Single phosphorescence frame. (D) Regions of interests identified on phosphorescence frame, which were used to generate values shown in table.

References

    1. Zhang R, et al. Biomed Opt Express. 10. Vol. 3. Optical Society of America; 2012. Čerenkov radiation emission and excited luminescence (CREL) sensitivity during external beam radiation therapy: Monte Carlo and tissue oxygenation phantom studies; p. 2381. - DOI - PMC - PubMed
    1. Zhang R, et al. Superficial dosimetry imaging based on Čerenkov emission for external beam radiotherapy with megavoltage x-ray beam. Med Phys. 2013;40(10):101914. doi: 10.1118/1.4821543. - DOI - PMC - PubMed
    1. Glaser AK, et al. Phys Med Biol. 14. Vol. 59. IOP Publishing; 2014. Optical dosimetry of radiotherapy beams using Cherenkov radiation: the relationship between light emission and dose; pp. 3789–3811. - DOI - PubMed
    1. Glaser AK, et al. Med Phys. 7. Vol. 42. American Association of Physicists in Medicine; 2015. Optical cone beam tomography of Cherenkov-mediated signals for fast 3D dosimetry of x-ray photon beams in water; pp. 4127–4136. - DOI - PMC - PubMed
    1. Zhang R, et al. Opt Lett. 5. Vol. 40. Optical Society of America; 2015. Cherenkov-excited luminescence scanned imaging; p. 827. - DOI - PubMed

Publication types