. 2018 Jun 1;128(6):2473-2486.
doi: 10.1172/JCI96121. Epub 2018 May 7.

UHRF1 epigenetically orchestrates smooth muscle cell plasticity in arterial disease

Affiliations

UHRF1 epigenetically orchestrates smooth muscle cell plasticity in arterial disease

Leonardo Elia et al. J Clin Invest. .

Abstract

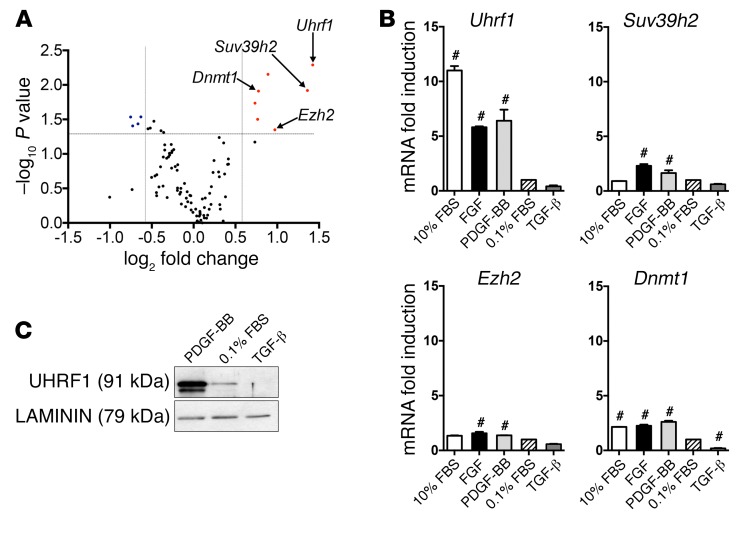
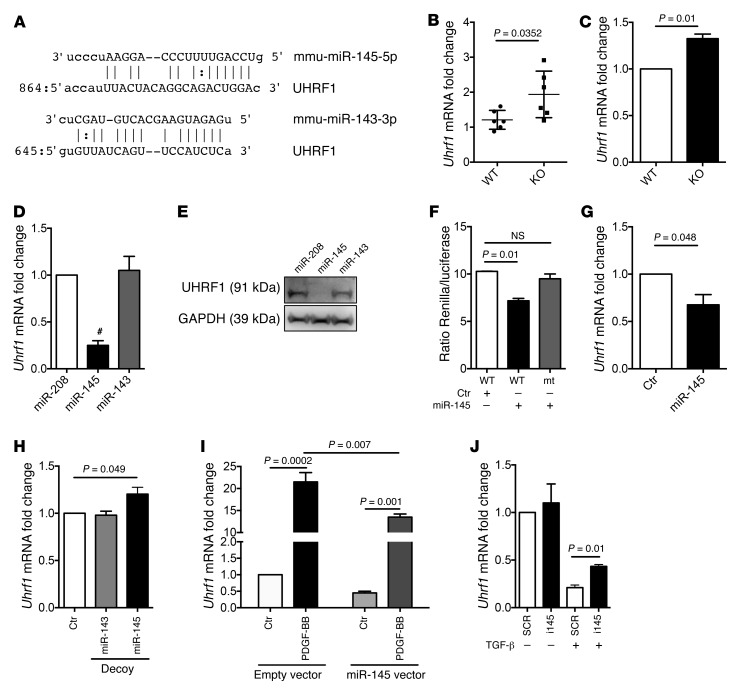
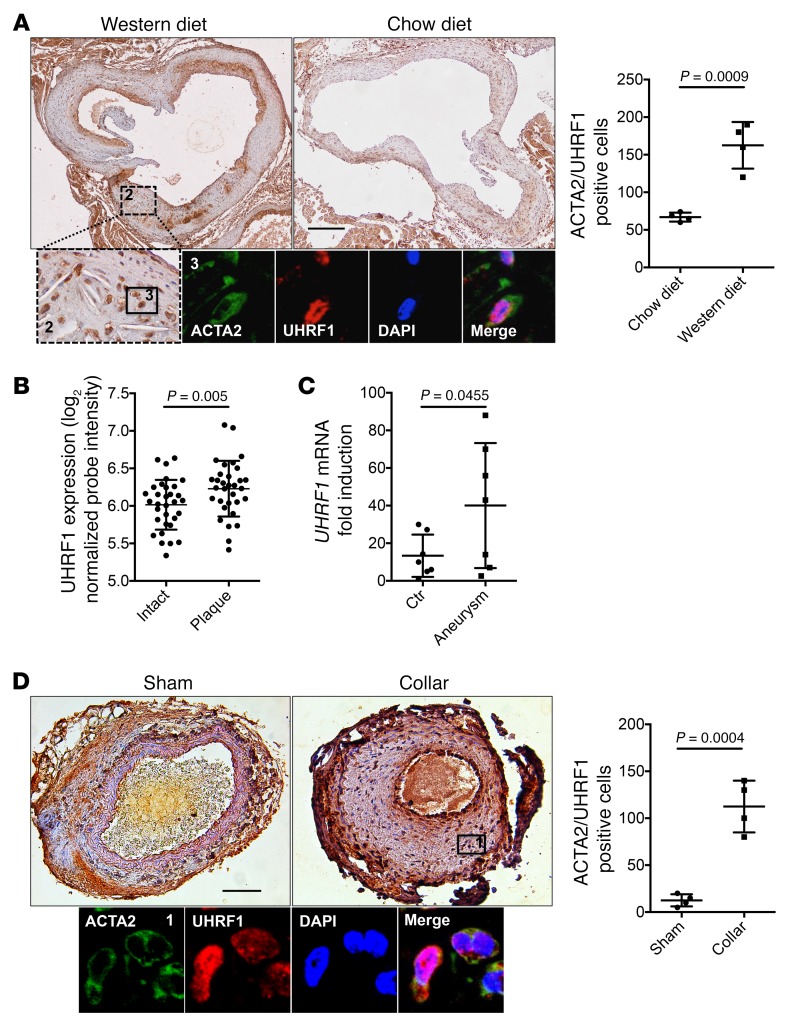
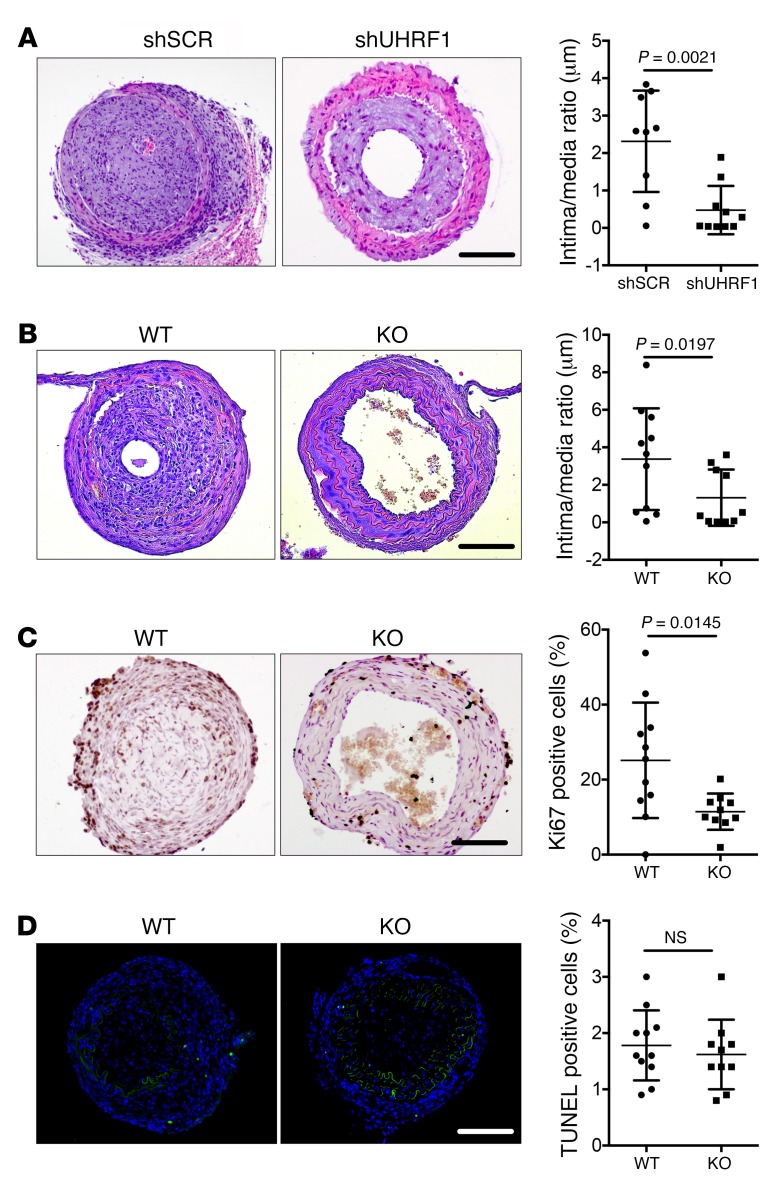
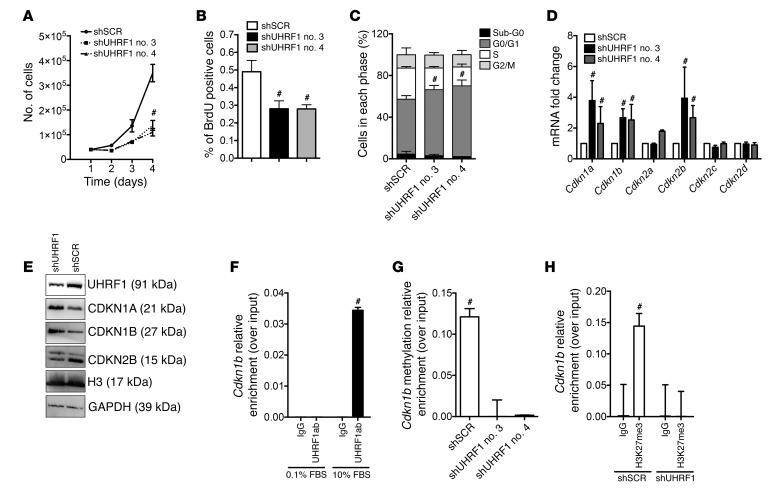
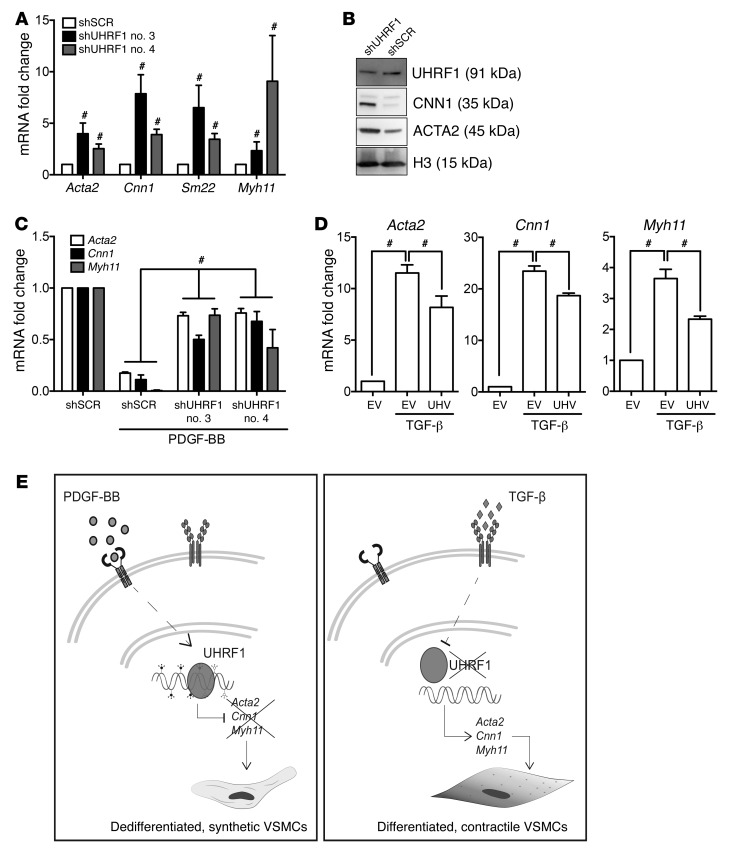
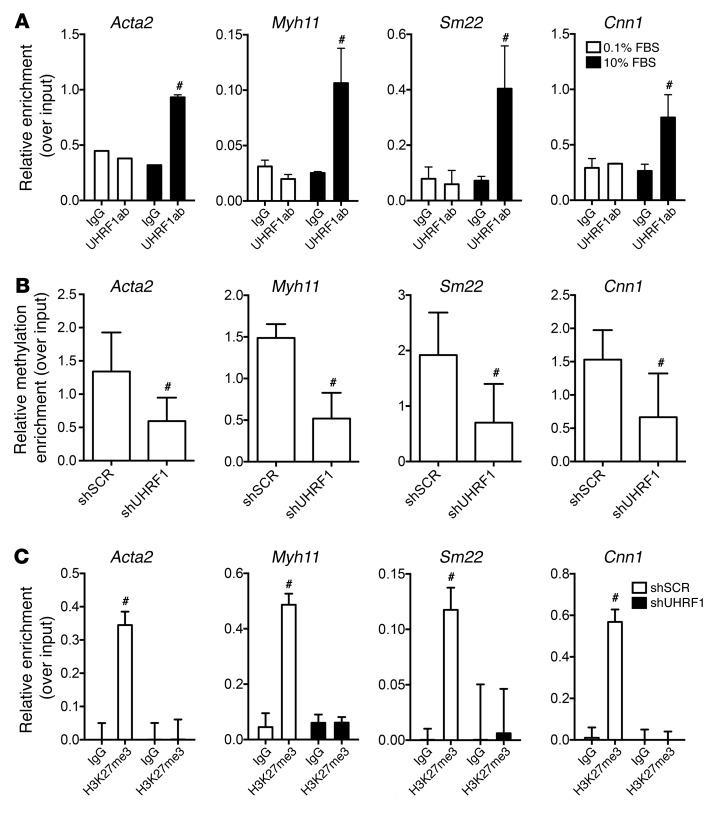
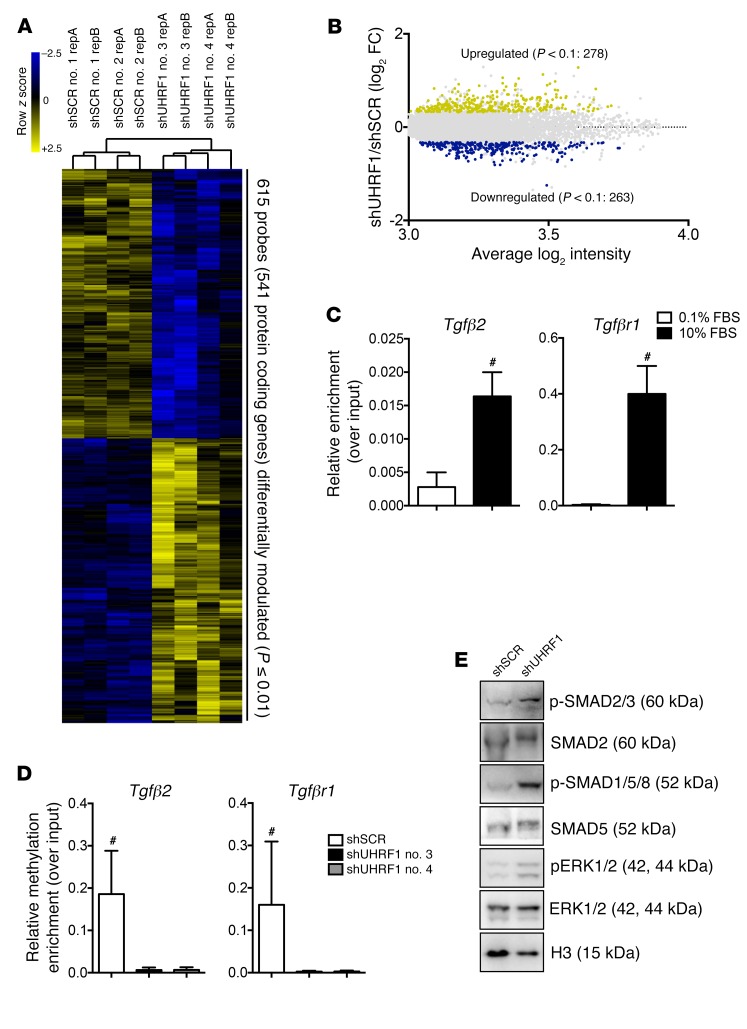
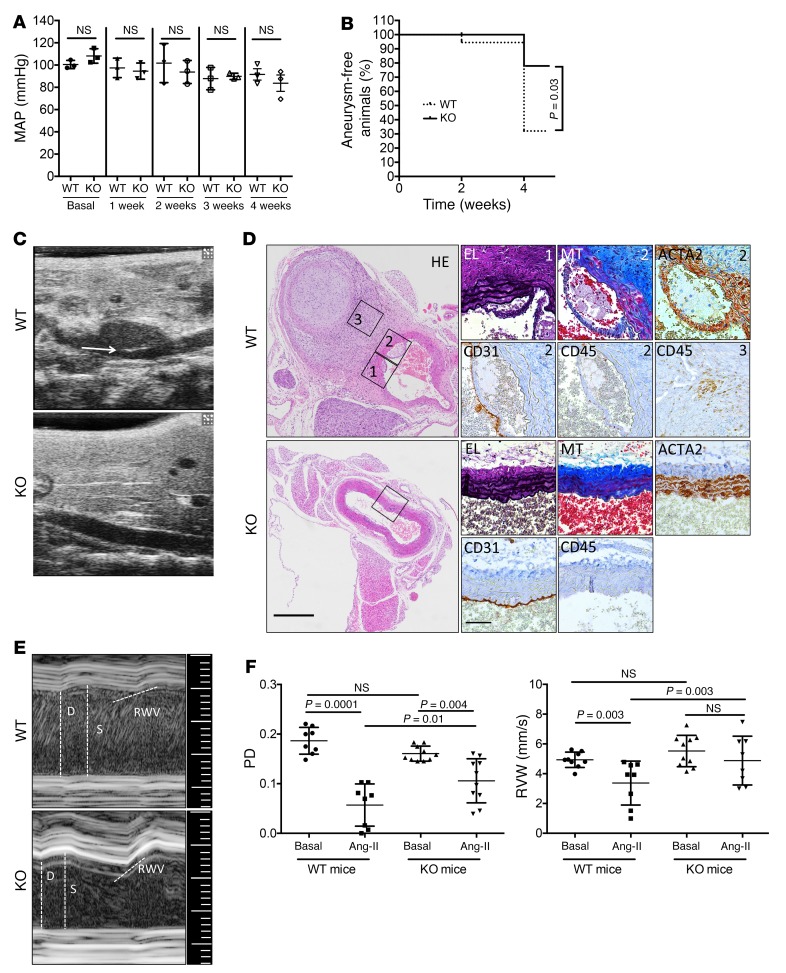
Adult vascular smooth muscle cells (VSMCs) dedifferentiate in response to extracellular cues such as vascular damage and inflammation. Dedifferentiated VSMCs are proliferative, migratory, less contractile, and can contribute to vascular repair as well as to cardiovascular pathologies such as intimal hyperplasia/restenosis in coronary artery and arterial aneurysm. We here demonstrate the role of ubiquitin-like containing PHD and RING finger domains 1 (UHRF1) as an epigenetic master regulator of VSMC plasticity. UHRF1 expression correlated with the development of vascular pathologies associated with modulation of noncoding RNAs, such as microRNAs. miR-145 - pivotal in regulating VSMC plasticity, which is reduced in vascular diseases - was found to control Uhrf1 mRNA translation. In turn, UHRF1 triggered VSMC proliferation, directly repressing promoters of cell-cycle inhibitor genes (including p21 and p27) and key prodifferentiation genes via the methylation of DNA and histones. Local vascular viral delivery of Uhrf1 shRNAs or Uhrf1 VSMC-specific deletion prevented intimal hyperplasia in mouse carotid artery and decreased vessel damage in a mouse model of aortic aneurysm. Our study demonstrates the fundamental role of Uhrf1 in regulating VSMC phenotype by promoting proliferation and dedifferentiation. UHRF1 targeting may hold therapeutic potential in vascular pathologies.

Keywords: Cardiovascular disease; Cell Biology; Epigenetics; Mouse models; Vascular Biology.


Conflict of interest statement

Conflict of interest: The authors have declared that no conflict of interest exists.

Figures

Figure 1
Figure 1. Regulation of Uhrf1 expression in response to mediators contributing to VSMC phenotypic switching.
(A) Analysis of the expression of 96 epigenetic genes in PDGF-BB–treated primary murine VSMCs with microfluidic cards. After global normalization, the statistical analysis was performed on 2 experimental duplicates compared with control cells (grown in a serum-deprived condition) and plotted versus the values of fold changes. A gene was arbitrarily considered modulated if fold induction was <0.6 to >2 compared with control and if the P value of such a difference was less than 0.05. (B) RT-qPCR gene expression analysis of VSMCs treated with different stimuli. The control sample (0.1% FBS) was set as 1. Results are the average of at least 3 independent experiments, and error bars indicate SD. #P < 0.05. (C) Representative Western blot showing UHRF1 levels in VSMCs treated with PDGF-BB (25 ng/ml) or TGF-β (10 ng/ml). Unpaired 2-tailed Student’s t test was used to compare means for A, and 1-way ANOVA with Tukey’s multiple comparisons test was used for B. #Adjusted P < 0.05.
Figure 2
Figure 2. miR-145–mediated regulation of Uhrf1.
(A) Putative binding sites for miR-143 and miR-145 on the 3′ UTR of Uhrf1. (B) Uhrf1 expression in aortas of miR-143– and miR-145–KO mice, measured by RT-qPCR. (C) Uhrf1 expression measured by RT-qPCR in 3 different preparations of VSMCs isolated from miR-143– and miR-145–KO mice, cultured in medium with 10% FBS. (D and E) Representative RT-qPCR RNA analysis and immunoblot of the target gene UHRF1 in miR-143– and miR-145–KO VSMCs transduced with adenovirus expressing miR-208, miR-145, or miR-143 and grown in medium with 10% FBS. (F) Luciferase reporter assay on A7r5 cells stably expressing miR-145 (Ctr, cells transduced with the empty vector) with a Renilla reporter gene linked to the WT or mutated (mt) Uhrf1 3′ UTR. (G) Uhrf1 expression in WT VSMCs transduced with a lentivirus expressing miR-145 (Ctr, cells transduced with the empty vector and cells cultured in medium with 10% FBS). (H) Uhrf1 expression in WT VSMCs transduced with lentivirus expressing sponge sequences (Decoys) targeting miR-143 or miR-145 and empty vector, as measured by RT-qPCR (cells cultured in medium with 10% FBS). (I) Uhrf1 expression in WT VSMCs transduced with a lentivirus expressing miR-145 and treated with PDGF-BB (25 ng/ml) (Ctr, cells treated with vehicle). (J) Uhrf1 expression in WT VSMCs transfected with an anti–miR-145 LNA (i145) oligo and treated with TGF-β (10 ng/ml) (SCR, cells treated with scrambled oligo). All results are the average of at least 3 independent experiments and error bars indicate SD. To compare means, an unpaired 2-tailed Student’s t test was used for B, C, D, G, and J, whereas 1-way ANOVA with Tukey’s multiple comparisons t test was used for F, H, and I. #P < 0.05. Adjusted P value is shown in F, H, and I.
Figure 3
Figure 3. UHRF1 is upregulated during atherosclerosis development and vascular injury.
(A) Representative immunostaining and quantification for UHRF1 on aortic cross sections of ApoE–/– mice fed with chow and Western diets (colorimetric images showing UHRF1 in brown, immunofluorescence showing UHRF1 in green and ACTA2 in red). Scale bar: 1 mm. Labels 2 and 3 indicate the specific areas from where the insets have been obtained. (B and C) UHRF1 expression analysis on atheroma plaque versus paired macroscopically intact tissue of 32 patients (GSE43292). The y axis indicates normalized UHRF1 probe intensity (ID 8024900) measured by Affymetrix Human Gene 1.0 ST Array (B) or abdominal aortic aneurytic vessels measured by RT-qPCR (C). (D) Representative immunostaining and quantification for UHRF1 on carotid sections of ApoE–/– mice undergoing collar placement (Collar) or a sham procedure (Sham) (colorimetric images showing UHRF1 in brown, immunofluorescence showing UHRF1 in green and ACTA2 in red). Scale bar: 100 μm. Error bars indicate SD. To compare means, we used the Wilcoxon matched paired test in B and the unpaired 2-tailed Student’s t test in A, C, and D.
Figure 4
Figure 4. Effect of Uhrf1 modulation in an in vivo model of restenosis.
(A) Representative H&E staining and quantification of carotid sections of ApoE–/– mice infused with shSCR or shUHRF1 viruses undergoing collar placement. (B) Representative H&E staining and experimental quantification of carotid sections of Uhrf1 WT (ApoE–/–UHRF1wt/wtcre/ERT2) and KO (ApoE–/–UHRF1fl/flcre/ERT2) mice undergoing collar placement. (C) Representative immunostaining and quantification for Ki67 on carotid sections of Uhrf1 WT and KO mice undergoing collar placement (Ki67 in brown). (D) Representative TUNEL staining and quantification of carotid sections from Uhrf1 WT and KO mice undergoing collar placement (TUNEL+ cells in green). Error bars indicate SD. To compare means, we used the Mann Whitney U test in A and B and the unpaired 2-tailed Student’s t test in C and D. Scale bars: 100 μm.
Figure 5
Figure 5. Uhrf1 regulates VSMC plasticity in vitro.
(A) Proliferation curve of VSMCs stably expressing shSCR or shUHRF1. To determine growth curves, 2 × 10⁴ cells/ml were plated in 6-well plates and cultured with 10% FBS. The number of viable cells was counted for 3 days. (B) Proliferation measured by BrdU incorporation in shSCR and shUHRF1 SMCs. (C) Cell-cycle analysis of shSCR- and shUHRF1-expressing SMCs. (D and E) RNA and protein analysis of different cyclins involved in VSMC phenotypic switch. (F) ChIP analysis showing UHRF1 enrichment on the Cdkn1b promoter in proliferating cells. Data are presented as mean relative enrichment over input ± SD of 3 biological repeats. (G) Results from methyl-ChIP experiments showing reduction of methylation at the promoter in the absence of Uhrf1. Data are presented as mean relative enrichment over input ± SD of 3 biological repeats. (H) ChIP showing the enrichment of H3K27me3 in control VSMCs compared with UHRF1-silenced cells. Data are presented as mean relative enrichment over input ± SD of 3 biological repeats. If not otherwise stated, the results are the average of at least 3 independent experiments and error bars indicate SD. To compare means, 1-way ANOVA with Tukey’s multiple comparisons test was used. #Adjusted P < 0.05.
Figure 6
Figure 6. Role of Uhrf1 on VSMC function and differentiation.
(A and B) RT-qPCR and Western blot showed an increase in several differentiation markers in Uhrf1-silenced VSMCs (cells cultured in medium with 10% FBS). (C) VSMC differentiation marker expression in Uhrf1-silenced cells treated with PDGF-BB (cells cultured in medium with 0.1% FBS). (D) VSMC differentiation marker expression in cells overexpressing human UHRF1 treated with TGF-β (cells cultured in medium with 0.1% FBS). EV, empty vector; UHV, UHRF1 vector. (E) Schematic illustration representing data shown in AD. The results are the average of at least 3 independent experiments. Error bars indicate SD. To compare means, unpaired 2-tailed Student’s t test was used for D and 1-way ANOVA with Tukey’s multiple comparisons t test was used for A and C. #P < 0.05 (P value is adjusted only in A and C).
Figure 7
Figure 7. UHRF1 binding on VSMC differentiation genes.
(A) ChIP assay showing UHRF1 enrichment at the Myh11, Acta2, Cnn1, and Sm22 promoters during VSMC dedifferentiation. Mouse primary VSMCs were cultured in a serum-deprived condition (0.1% FBS) or with 10% FBS. (B) Methyl ChIP assay showing reduced methylation at the Myh11, Acta2, Cnn1, and Sm22 promoters in the absence of Uhrf1. (C) ChIP assay showing H3K27me3 enrichment at the Myh11, Acta2, Cnn1, and Sm22 promoters in the absence of Uhrf1. Data are presented as mean relative enrichment over input ± SD of 3 biological repeats. To compare means, unpaired 2-tailed Student’s t test was used. #P < 0.05.
Figure 8
Figure 8. Effects of Uhrf1 absence in vitro.
(A) Hierarchical clustering heat map of 615 probes differentially expressed between shUHRF1 and shSCR (P ≤ 0.1, –1.3 ≤ fold-change ≥ 1.3). (B) Dot plot, with blue dots representing downregulated protein-coding genes (263) and yellow dots representing upregulated protein-coding genes (278) in shUHRF1 and shSCR cells. (C) ChIP assay showing UHRF1 enrichment at the Tgfβ2 and Tgfβr1 promoters in proliferating VSMCs (cells cultured with 10% FBS). Data are presented as mean relative enrichment over input ± SD of 3 biological repeats. (D) Methyl ChIP assay showing reduced methylation at the Tgfβ2 and Tgfβr1 promoters in the absence of UHRF1 (cells cultured with 10% FBS). Data are presented as mean relative enrichment over input ± SD of 3 biological repeats. (E) Representative Western blots showing activation of the canonical TGF-β pathway in Uhrf1-silenced VSMCs. Error bars indicate SD. To compare means, we used unpaired 2-tailed Student’s t test in C and 1-way ANOVA with Tukey’s multiple comparisons t test in D. #P < 0.05 (P value is only adjusted in D).
Figure 9
Figure 9. Effects of Uhrf1 absence in vivo.
(A) Mean arterial blood pressure (MAP) of WT and KO mice as measured by telemetry. Measurements started before tamoxifen injection (Basal) and were continued for 4 weeks after induction. Symbols represent individual mice; horizontal bars indicate means (n = 3 KO and 3 WT animals). (B) Survival curve for the appearance of aneurysm formation in WT and KO animals, y axis shows the percentage of mice that did not develop the pathology (n = 11 KO and 10 WT animals). (C) Representative bidimensional echo-Doppler images of abdominal aortas of Ang-II–infused KO (Ang-II) mice compared with controls (WT). The white arrow indicates an example of aortic rupture in WT control. (D) Representative cross sections of aneurysms forming in abdominal aortas of WT and KO mice. HE, H&E; MT, ECM deposition by Masson Trichrome staining; EL, elastin by van Gieson’s staining; ACTA2, immune-staining for smooth muscle actin; CD31, immune-staining for platelet and endothelial cell adhesion molecule 1 (PECAM1); CD45, immune-staining for leukocyte common antigen (LCA). Scale bars 400 μm (big panels) and 50 μm (small panels). Labels 1, 2 and 3 indicate the specific areas from where the insets have been obtained. (E) Representative echo-Doppler images of abdominal aortas of Ang-II–infused KO mice compared with controls (WT), and (F) quantitative analysis of the pulse diameters (PD) and radial wall velocity (RWV). To compare groups, we used the log-rank Mantel-Cox test in B and unpaired 2-way ANOVA in A and F. Adjusted P value shown for A and F. NS indicates not statistically significant.

Similar articles

Cited by

References

    1. Owens GK. Regulation of differentiation of vascular smooth muscle cells. Physiol Rev. 1995;75(3):487–517. doi: 10.1152/physrev.1995.75.3.487. - DOI - PubMed
    1. McDonald OG, Wamhoff BR, Hoofnagle MH, Owens GK. Control of SRF binding to CArG box chromatin regulates smooth muscle gene expression in vivo. J Clin Invest. 2006;116(1):36–48. doi: 10.1172/JCI26505. - DOI - PMC - PubMed
    1. Dobin A, et al. STAR: ultrafast universal RNA-seq aligner. Bioinformatics. 2013;29(1):15–21. doi: 10.1093/bioinformatics/bts635. - DOI - PMC - PubMed
    1. Findeisen HM, Kahles FK, Bruemmer D. Epigenetic regulation of vascular smooth muscle cell function in atherosclerosis. Curr Atheroscler Rep. 2013;15(4):319. doi: 10.1007/s11883-013-0319-7. - DOI - PubMed
    1. Nishiyama A, et al. Uhrf1-dependent H3K23 ubiquitylation couples maintenance DNA methylation and replication. Nature. 2013;502(7470):249–253. doi: 10.1038/nature12488. - DOI - PubMed

Publication types

MeSH terms