Clinical Trial
. 2018 Jun 1;128(6):2310-2324.
doi: 10.1172/JCI97449. Epub 2018 Apr 23.

Coexisting genomic aberrations associated with lymph node metastasis in breast cancer

Affiliations
Clinical Trial

Coexisting genomic aberrations associated with lymph node metastasis in breast cancer

Li Bao et al. J Clin Invest. .

Abstract

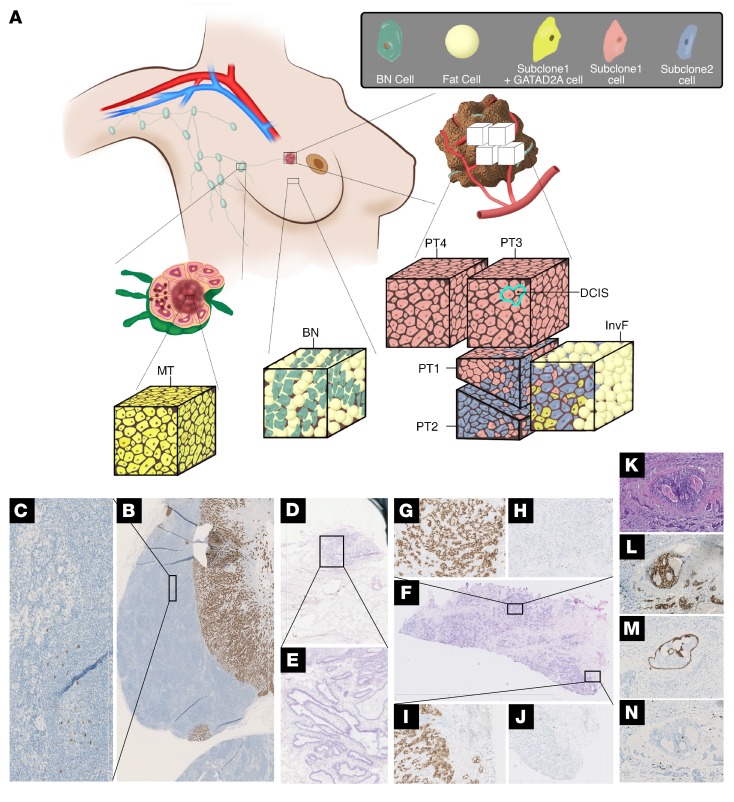
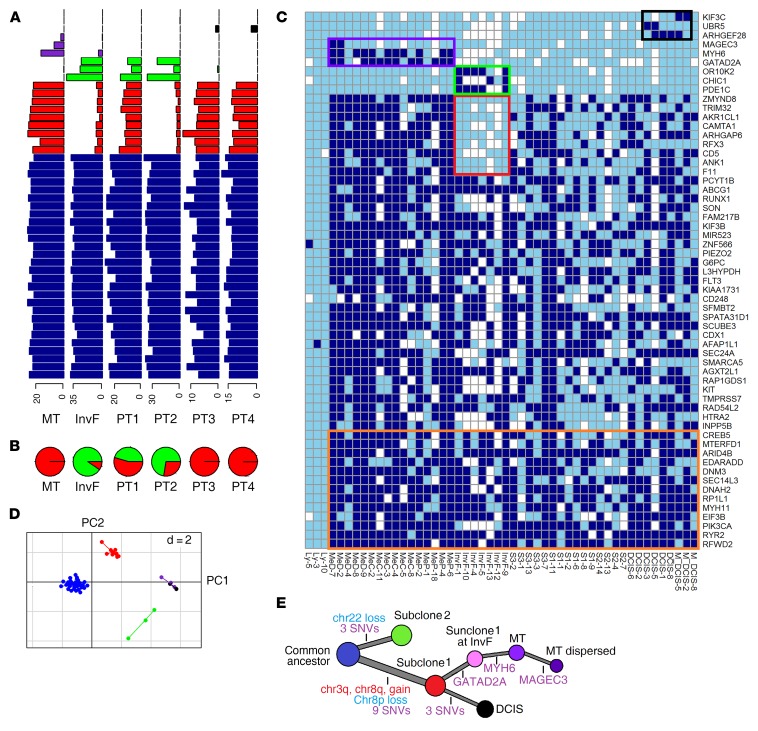
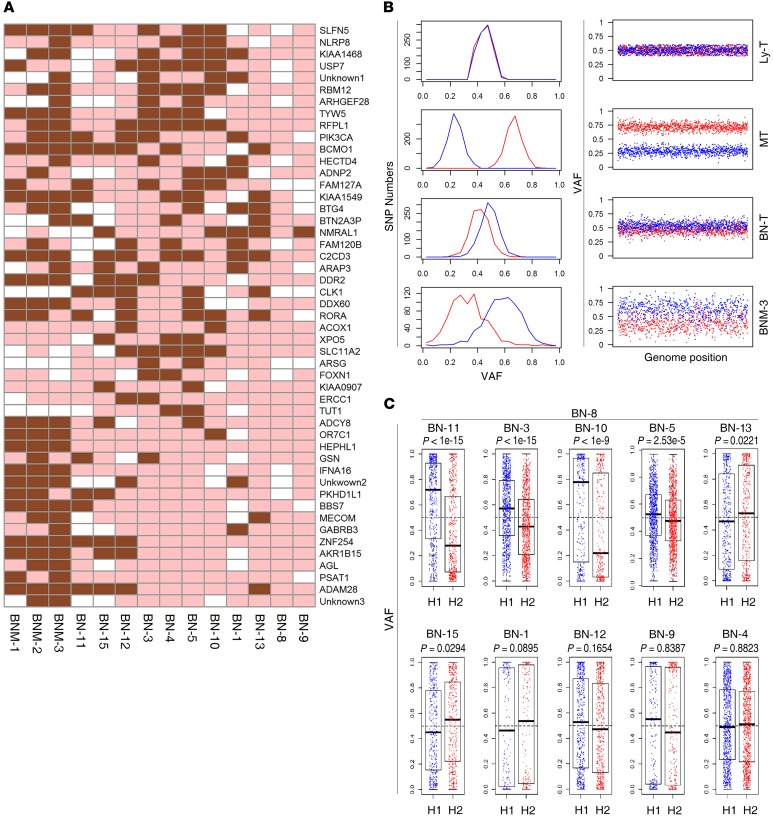
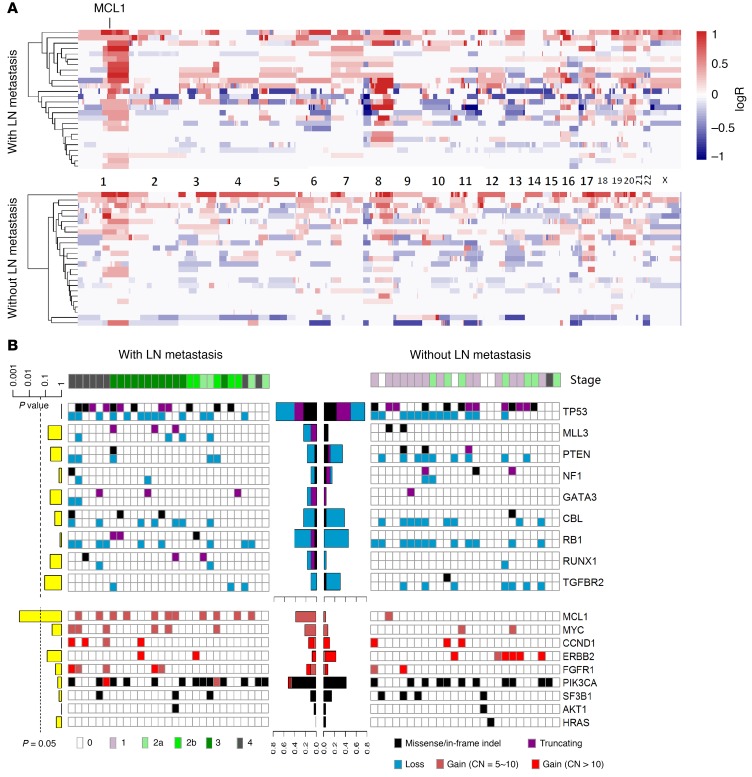
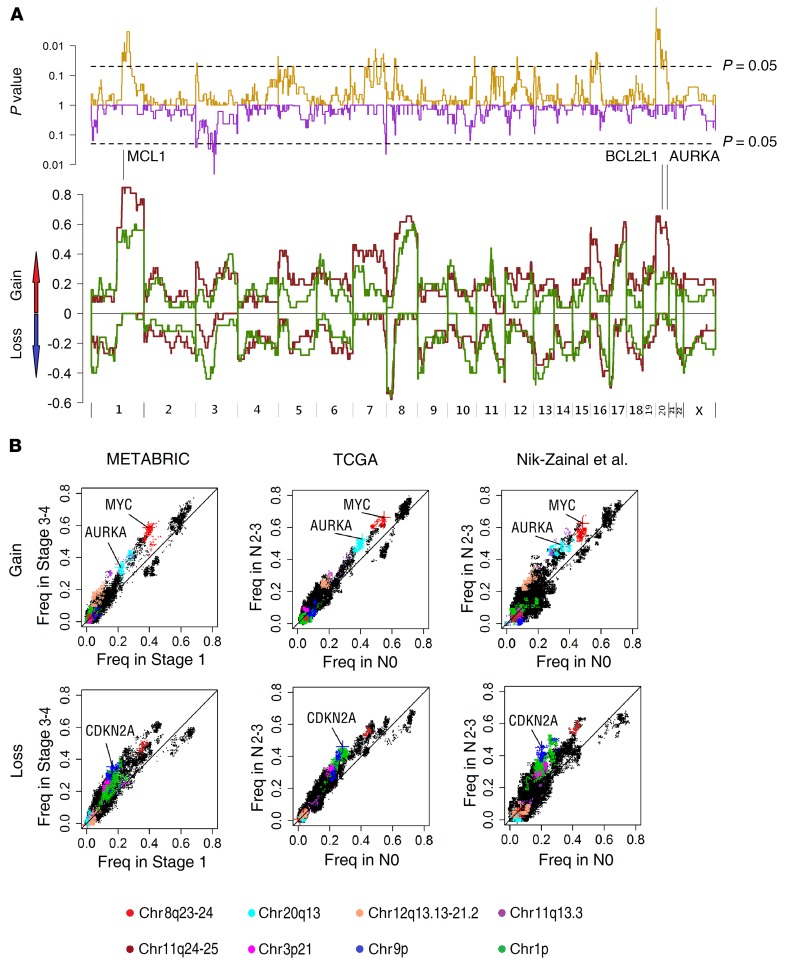
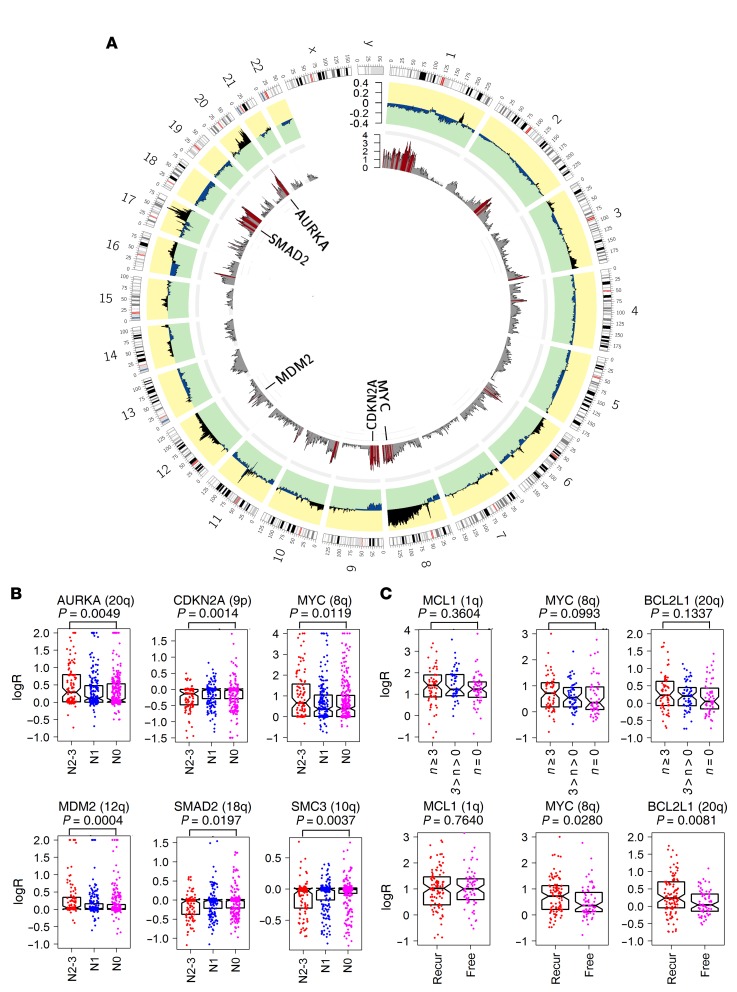
Single cancer cell-sequencing studies currently use randomly selected cells, limiting correlations among genomic aberrations, morphology, and spatial localization. We laser-captured microdissected single cells from morphologically distinct areas of primary breast cancer and corresponding lymph node metastasis and performed whole-exome or deep-target sequencing of more than 100 such cells. Two major subclones coexisted in different areas of the primary tumor, and the lymph node metastasis originated from a minor subclone in the invasive front of the primary tumor, with additional copy number changes, including chr8q gain, but no additional point mutations in driver genes. Lack of metastasis-specific driver events led us to assess whether other clonal and subclonal genomic aberrations preexisting in primary tumors contribute to lymph node metastasis. Gene mutations and copy number variations analyzed in 5 breast cancer tissue sample sets revealed that copy number variations in several genomic regions, including areas within chr1p, chr8q, chr9p, chr12q, and chr20q, harboring several metastasis-associated genes, were consistently associated with lymph node metastasis. Moreover, clonal expansion was observed in an area of morphologically normal breast epithelia, likely driven by a driver mutation and a subsequent amplification in chr1q. Our study illuminates the molecular evolution of breast cancer and genomic aberrations contributing to metastases.

Keywords: Breast cancer; Genetic variation; Genetics; Molecular genetics; Oncology.


Conflict of interest statement

Conflict of interest: The authors have declared that no conflict of interest exists.

Figures

Figure 1
Figure 1. Subclone distribution within different tissues of the analyzed breast cancer patient.
(A) Schematic representation of the tissues analyzed by WES of single cells and cell pools and the distribution of the different subclones within these areas. MT, metastasis. (B) Axillary lymph node containing large MT stained for estrogen receptor. (C) Magnification of an area of the lymph node exhibiting normal architecture and morphology, but also containing disseminated single cancer cells. (D) H&E-stained section of the BN-T including normal breast ducts. (E) Magnification of an area of D showing normal breast epithelia. (F) H&E-stained section of the primary tumor biopsy provides a spatial overview of the 3 solid growth tumor areas selected for LCM in addition to the InvF. (G and H) Solid growth area 2 (PT2). (I and J) Border of solid growth area 1 (PT1) including the InvF. H and J are stained for Ki-67, while G and I are stained for ER. Original magnification: ×12.5 (D, E, F); ×100 (B, C, K, L, M, N); ×50 (G, H, I, J). Section containing area of DCIS stained with H&E (K), and for ER (L), CK14 (M), and Ki-67 (N). (M) The intact myoepithelial layer is visualized by staining for CK14.
Figure 2
Figure 2. SNV analysis of breast cancer single cells and cell pools identified 2 dominant subclones and additional spatial location–specific subclones.
(A) AF of breast cancer–specific SNVs in 6 cell pools of distinct morphologically defined breast tumor areas (lymph node metastasis, InvF, and 4 distinct areas within the solid invasive growth [PT1, PT2, PT3, PT4]). Presumed clonal SNVs located in CNV regions were not shown for distorted VAF. Blue, clonal SNVs; red, subclone 1–specific SNVs; green, subclone 2–specific SNVs; purple, metastases-specific SNVs; black, DCIS-specific SNVs. (B) Fraction of the 2 dominant subclones in each cell pool estimated by least square fit (red, subclone 1; green, subclone 2). (C) Heatmap of breast cancer–specific SNVs identified in breast cancer single cells (dark blue, mutated; sky blue, WT; white, WT and sequencing depth of less than ×8). Clonal SNVs predicted not to change protein structure and clonal SNVs with median sequencing depths of less than ×50 in the 57 single cells are not shown, while all subclonal SNVs are shown. Colored boxes encapsulate the group-specific SNVs (the same color code for each group as in A is used), except for the orange box, which denotes clonal SNVs located in CNV regions. (D) PCA of SNVs based on allele frequencies in breast cancer cell pools (the same color code for each group as in A is used). Two dimensions were shown (d = 2). (E) The evolutionary tree of the single cell–sequenced breast cancer. Accumulation of chromosome gains and losses as well as somatic mutations are represented by red, blue, and purple, respectively.
Figure 3
Figure 3. Mutations and CNV of chr1q in normal breast epithelial single cells and cell pools.
(A) Heatmap depicting BN-T–specific SNVs identified by sequencing of 11 normal single breast epithelial cells and 3 normal cell pools (brown, mutated; pink, WT; white, WT and sequencing depth of less than 8×). (B) Two distinct haplotypes of chr1q in 4 samples, including Ly-T, lymph node metastasis tissue, BN-T, and a population of macroscopically dissected normal breast epithelial cells (BNM-3). The left panels show the distribution of SNP allele frequencies of haplotypes 1 (red) and 2 (blue) in the amplified genome region chr1q, while the horizontal axis shows VAF and the vertical axis the number of SNPs within the corresponding VAF. The right panels plot SNP allele frequencies of haplotypes 1 (red) and 2 (blue) across chr1q, while the horizontal axis shows coordinate of SNPs in chr1q and the vertical axis shows the AF. Haplotype 1 was amplified in MT, while haplotype 2 was amplified in BN-T and BNM. (C) LOH of chr1q in BN single cells. Variant allele frequencies of SNPs in 2 haplotypes of chr1q are shown as blue and red points (the same color code for each haplotype as in B). P values of LOH in each cell were calculated using Wilcoxon’s rank sum test. Error bars represent the values of median, upper, and lower quartiles and maximum and minimum.
Figure 4
Figure 4. Comparison of mutations and CNVs in the Chinese sample set of 54 primary breast cancers between patients with and without lymph node metastasis revealed MCL1 is more frequently altered in primary cancers of patients with lymph node metastases.
(A) Heatmaps of CNVs of primary tumors from a Chinese sample set of 54 breast cancer patients with (upper panel) and without (lower panel) lymph node metastasis. Gain and loss are displayed by red and blue, respectively. (B) Mutational spectrum of 54 primary breast cancers with (left panel) and without (right panel) lymph node metastasis. The left panel (yellow bar plot) shows P values (Fisher’s exact test) for aberrant samples in the 2 subgroups for each gene. The middle panel (bar plot) shows the proportion of aberrant samples in each subgroup.
Figure 5
Figure 5. Genome regions associated with lymph node metastasis in breast cancers identified by whole-genome association analysis of frequencies of copy number gains and losses.
(A) Frequency of CNAs in the 54 Chinese primary breast cancer patients with (brown line) or without lymph node metastasis (green line) across the whole genome. chr1q (MCL1) and chr20 (BCL2L1, AURKA) gains were more frequent in primary tumors of patients with lymph node metastasis. The top panel shows the P values (Fisher’s exact test) of gain/loss frequency between the 2 subgroups. (B) Comparison of gain and loss frequencies between ER+ patients without lymph node metastasis (N0) and with high burden of lymph node metastasis (N2–N3) in the data sets of METABRIC (n = 403 vs. 78), TCGA (n = 265 vs. 106), and Nik-Zainal et al. (n = 131 vs. 63; ref. 28). The different genome regions are indicated by different colors.
Figure 6
Figure 6. Genome regions associated with lymph node metastasis in breast cancers identified by whole-genome association analysis of detailed copy ratios.
(A) Differences in the average logR (outer circle) across the whole genome between primary ER+ breast cancers of patients with N0 (265 samples) and N2–N3 (106 samples) lymph node metastasis status (data from TCGA). P value of each gene (inner circle) was calculated for the logRs between the 2 groups (Wilcoxon’s rank sum test); red bars denote genes with P < 0.02. (B) Comparison of copy ratios of AURKA (chr20q), CDKN2A (chr9p), MYC (chr8q), MDM2 (chr12q), SMAD2 (chr18q), and SMC3 (chr10q) in the TCGA ER+ breast cancers grouped according to patient lymph node status (N0, N1, and N2–N3,). Significance of difference between N0 and N2–N3 groups was tested by Wilcoxon’s rank sum test. Each point represents the copy ratio of 1 sample. (C) Comparison of copy ratios of MCL1, MYC, and BCL2L1 in 170 Danish primary ER+ breast cancers grouped according to the number of positive lymph nodes of the patient (of n = 0, 0 < n < 3, and n ≥ 3) and recurrence status (recurrence [Recur] vs. without recurrence [Free]). Significance of difference between n = 0 and n ≥ 3 groups and between recurrence and without recurrence groups was tested by Wilcoxon’s rank sum test. Each point represents the copy ratio of 1 sample. Error bars in B and C represent the values of median and upper and lower quartiles.

Similar articles

Cited by

References

    1. Valastyan S, Weinberg RA. Tumor metastasis: molecular insights and evolving paradigms. Cell. 2011;147(2):275–292. doi: 10.1016/j.cell.2011.09.024. - DOI - PMC - PubMed
    1. Cheung KJ, Ewald AJ. A collective route to metastasis: Seeding by tumor cell clusters. Science. 2016;352(6282):167–169. doi: 10.1126/science.aaf6546. - DOI - PMC - PubMed
    1. Minn AJ, et al. Lung metastasis genes couple breast tumor size and metastatic spread. Proc Natl Acad Sci U S A. 2007;104(16):6740–6745. doi: 10.1073/pnas.0701138104. - DOI - PMC - PubMed
    1. Budhu A, Wang XW. Transforming the microenvironment: a trick of the metastatic cancer cell. Cancer Cell. 2012;22(3):279–280. doi: 10.1016/j.ccr.2012.08.018. - DOI - PubMed
    1. Yu M, et al. Circulating breast tumor cells exhibit dynamic changes in epithelial and mesenchymal composition. Science. 2013;339(6119):580–584. doi: 10.1126/science.1228522. - DOI - PMC - PubMed

Publication types