

Blood pressure-lowering treatment strategies based on cardiovascular risk versus blood pressure: A meta-analysis of individual participant data
- PMID: 29558462
- PMCID: PMC5860698
- DOI: 10.1371/journal.pmed.1002538
Blood pressure-lowering treatment strategies based on cardiovascular risk versus blood pressure: A meta-analysis of individual participant data
Abstract
Background: Clinical practice guidelines have traditionally recommended blood pressure treatment based primarily on blood pressure thresholds. In contrast, using predicted cardiovascular risk has been advocated as a more effective strategy to guide treatment decisions for cardiovascular disease (CVD) prevention. We aimed to compare outcomes from a blood pressure-lowering treatment strategy based on predicted cardiovascular risk with one based on systolic blood pressure (SBP) level.
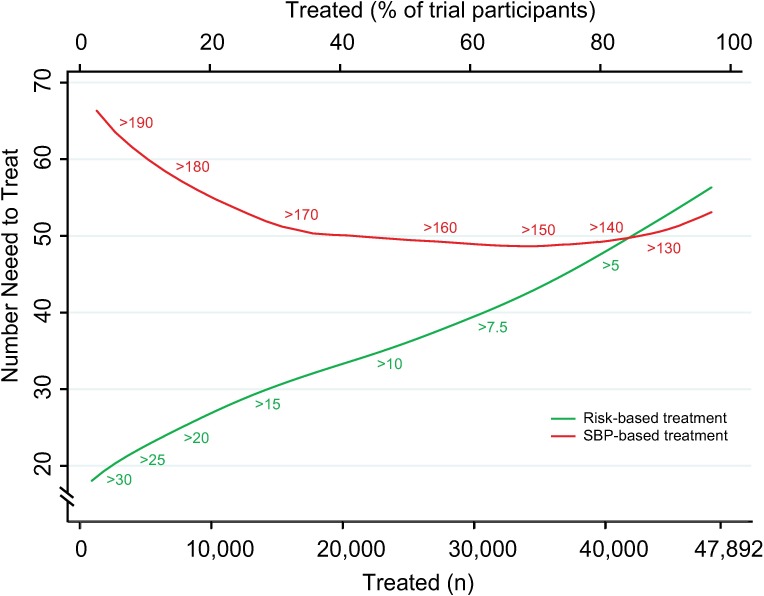
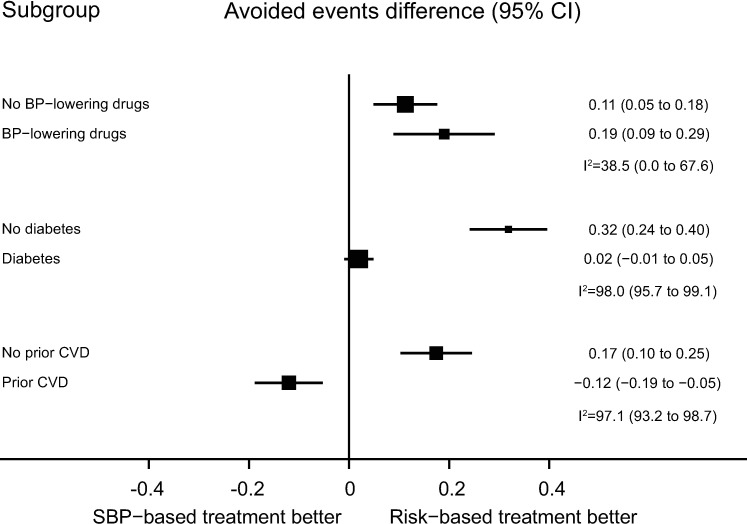
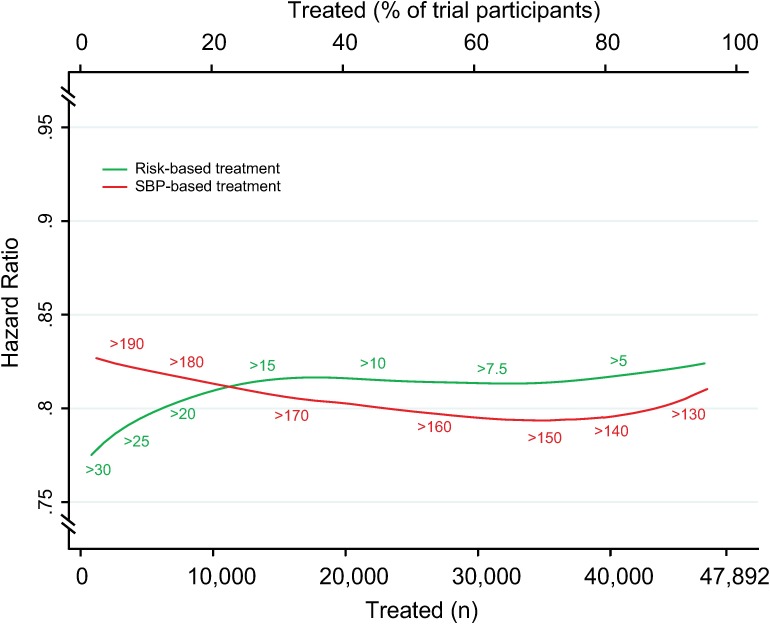
Methods and findings: We used individual participant data from the Blood Pressure Lowering Treatment Trialists' Collaboration (BPLTTC) from 1995 to 2013. Trials randomly assigned participants to either blood pressure-lowering drugs versus placebo or more intensive versus less intensive blood pressure-lowering regimens. We estimated 5-y risk of CVD events using a multivariable Weibull model previously developed in this dataset. We compared the two strategies at specific SBP thresholds and across the spectrum of risk and blood pressure levels studied in BPLTTC trials. The primary outcome was number of CVD events avoided per persons treated. We included data from 11 trials (47,872 participants). During a median of 4.0 y of follow-up, 3,566 participants (7.5%) experienced a major cardiovascular event. Areas under the curve comparing the two treatment strategies throughout the range of possible thresholds for CVD risk and SBP demonstrated that, on average, a greater number of CVD events would be avoided for a given number of persons treated with the CVD risk strategy compared with the SBP strategy (area under the curve 0.71 [95% confidence interval (CI) 0.70-0.72] for the CVD risk strategy versus 0.54 [95% CI 0.53-0.55] for the SBP strategy). Compared with treating everyone with SBP ≥ 150 mmHg, a CVD risk strategy would require treatment of 29% (95% CI 26%-31%) fewer persons to prevent the same number of events or would prevent 16% (95% CI 14%-18%) more events for the same number of persons treated. Compared with treating everyone with SBP ≥ 140 mmHg, a CVD risk strategy would require treatment of 3.8% (95% CI 12.5% fewer to 7.2% more) fewer persons to prevent the same number of events or would prevent 3.1% (95% CI 1.5%-5.0%) more events for the same number of persons treated, although the former estimate was not statistically significant. In subgroup analyses, the CVD risk strategy did not appear to be more beneficial than the SBP strategy in patients with diabetes mellitus or established CVD.
Conclusions: A blood pressure-lowering treatment strategy based on predicted cardiovascular risk is more effective than one based on blood pressure levels alone across a range of thresholds. These results support using cardiovascular risk assessment to guide blood pressure treatment decision-making in moderate- to high-risk individuals, particularly for primary prevention.
Conflict of interest statement
I have read the journal's policy and the authors of this manuscript have the following competing interests: KR receives a stipend as a specialty consulting editor for
Figures


Comment in
-
Primary prevention of cardiovascular disease: The past, present, and future of blood pressure- and cholesterol-lowering treatments.PLoS Med. 2018 Mar 20;15(3):e1002539. doi: 10.1371/journal.pmed.1002539. eCollection 2018 Mar. PLoS Med. 2018. PMID: 29558473 Free PMC article.
References
-
- James PA, Oparil S, Carter BL, Cushman WC, Dennison-Himmelfarb C, Handler J, et al. 2014 evidence-based guideline for the management of high blood pressure in adults: report from the panel members appointed to the Eighth Joint National Committee (JNC 8). JAMA. 2014;311(5):507–20. Epub 2013/12/20. doi: 10.1001/jama.2013.284427 . - DOI - PubMed
-
- Krause T, Lovibond K, Caulfield M, McCormack T, Williams B. Management of hypertension: summary of NICE guidance. BMJ. 2011;343:d4891 Epub 2011/08/27. doi: 10.1136/bmj.d4891 . - DOI - PubMed
-
- Weber MA, Schiffrin EL, White WB, Mann S, Lindholm LH, Kenerson JG, et al. Clinical practice guidelines for the management of hypertension in the community: a statement by the American Society of Hypertension and the International Society of Hypertension. J Clin Hypertens (Greenwich). 2014;16(1):14–26. Epub 2013/12/18. doi: 10.1111/jch.12237 . - DOI - PMC - PubMed
-
- Mancia G, Fagard R, Narkiewicz K, Redon J, Zanchetti A, Bohm M, et al. 2013 ESH/ESC guidelines for the management of arterial hypertension: the Task Force for the Management of Arterial Hypertension of the European Society of Hypertension (ESH) and of the European Society of Cardiology (ESC). Eur Heart J. 2013;34(28):2159–219. Epub 2013/06/19. doi: 10.1093/eurheartj/eht151 . - DOI - PubMed
-
- Jackson R, Lawes CM, Bennett DA, Milne RJ, Rodgers A. Treatment with drugs to lower blood pressure and blood cholesterol based on an individual's absolute cardiovascular risk. Lancet. 2005;365(9457):434–41. Epub 2005/02/01. doi: 10.1016/S0140-6736(05)17833-7 . - DOI - PubMed
Publication types
MeSH terms
Substances
LinkOut - more resources
Full Text Sources
Other Literature Sources
Medical
